




No CrossRef data available.
The spread of Standard Albanian: An illustration based on an analysis of vowels
Published online by Cambridge University Press: 27 April 2006
Abstract
Modern Standard Albanian is a young variety, proclaimed in 1972 at the Congress of Orthography in Tirana. It is based on the Tosk variety, one of the two main varieties (Tosk and Gheg) of the Albanian language, which is spoken in the South of the country. The aim of the current investigation is to look at the way in which this Standard is realized by its representatives, the educated speakers of four geographical regions: South Albania, Middle Albania, North Albania, and Kosovo. The analysis is based on the realization of stressed vowels. It can be shown that there are striking differences between the speakers of the Republic of Albania and Kosovo, whereas within Albania, speakers from the different geographical regions adopt characteristic features from the other geographical regions. The spread of Standard Albanian is, therefore, not solely an intrusion of the Tosk-based variety into the Gheg varieties, but rather, speakers counterbalance among their varieties on the basis of the alleged variety.This article is a considerably revised version of a presentation given at the 2nd International Conference on Language Variation in Europe at Uppsala University in June, 2003. We are grateful for the comments of participants there and especially grateful for helpful comments by Werner Deutsch and two anonymous referees.
Information
- Type
- Research Article
- Information
- Copyright
- © 2006 Cambridge University Press
THE ALBANIAN LANGUAGE
Albanian is an Indo-European language with about 5 to 6 million speakers living mostly in the Republic of Albania, Kosovo, the former Yugoslavian Republic of Macedonia, Yugoslavia (Montenegro and Serbia), Italy (southern parts and Sicily), Greece, Bulgaria, Turkey, Syria, and Egypt. According to prevailing opinion, the Albanian language forms a branch of its own within the Indo-European language family (Hetzer, 1995). The question as to whether the Albanian language originates from Illyrian or Thrako-Dacian still needs to be answered. Taking into account the history and continuity of colonization, an origination from Illyrian is preferred (Hetzer, 1995).
The Albanian language is divided into two principal dialects, Tosk (toskërishtja) and Gheg (gegërishtja). The river Shkumbin marks the border between the two dialects. Gheg is spoken to the north and Tosk to the south of the river. A strip of about 10 km to 20 km south of the city Elbasan, stretching from the coast to lake Ohrid, is generally agreed to be the transition zone between Tosk and Gheg. Both Gheg and Tosk can be further subdivided. Hetzer (1995), following Desnickaja (1968), subdivided Gheg into Northern Gheg (Shkodër and Kosovo), Middle, and South Gheg, with further subdivisions for Northern Gheg. Tosk is further subdivided into Northern Tosk (the basis for the Modern Standard, see also Byron, 1976), Lab (Gjirokastër), and Çam (Konispol, Epirus) in the South. This classification suggests that there is no influence of national borders on the dialect continuum.
There are considerable differences between the Tosk and the Gheg varieties.
1Hetzer (1995) gives a concise overview of the differences among the geographically divided dialects.

is the result of a sound change of the Gheg variant.
2We thank the anonymous referee for this information.
Standard varieties are upheld by the elite of a speech community. However, traditional dialectology usually gives no description referring to the education of the speakers. In the case of Albanian, it is therefore rather difficult to find a basis for comparison. An indirect inference on the spoken Standard language of Gheg3
Before the proclamation of Modern Standard Albanian, two literary variants existed, a Gheg variety and a Tosk variety. Those familiar with either the Tosk or the Gheg literary variants were the respective elites. The spoken language of these elites differed from the various regional dialects and is assumed to have been the spoken Standard language. “Standard Gheg,” therefore, refers to a language variety that has been spoken by the educated people of North Albania before the unified Tosk-based Standard was proclaimed and pushed through.
Beci (1995), in his introduction, for example, describes the Gheg equivalent of the schwa as a back, rounded, and nasalized vowel

, however, the analysis of his speakers rendered an unrounded and nonnasal vowel.
Byron explicated that the “standardization of Albanian phonology is closely tied to regularization of orthography” (Byron, 1976:78).
DEVELOPMENT OF MODERN STANDARD ALBANIAN
Generally, the starting point for the development of a standard language is the desideratum of a certain speech community to unify the diverse varieties spoken within that community. The basis for the origination of a standard is an appropriate literary language (Coulmas, 2000). Therefore, the development of the spoken standard language cannot be seen independently of the literary language.
Within the Albanian speech community, the necessity for a unified Albanian Standard language was all the more pressing since language—in a community of cultural and religious diversity—provided the possibility of a unifying bond against foreign rule (Nehring, 2000). At the turn of the century, Xhuvani (cited after Byron) held the view that “dialectal preferences should be suppressed in the interest of important national needs: he saw a standard language as a unifying cultural force, njisia e gjuhës âsht njisia e kombit, ‘unity of the language is unity of the nation’” (Byron, 1976:57). On the other hand, this request was not an easy task, first of all, because no standardized alphabet existed, and secondly, because in the 19th and 20th centuries, two equally important literary variants, the Northern Gheg variety and the Tosk variety, based on the two main Albanian dialects, coexisted (Lloshi, 1999).
The 1908 Congress of Manastir was a turning point in the development of the Standard Albanian language insofar as it paved the way for the adoption of the Roman alphabet. As a next step, both at the Literary Committee in Shkodër (1916/1917) and at the Lushnjë Congress (1920), a compromise was made by favoring the variety of Elbasan as a common basis for the Standard Albanian language. The reason for choosing the Elbasan variety was understandability for both North Gheg and Tosk speakers as well as the vicinity of the newly founded capital Tiranë. In 1923, the Elbasan variety of South Gheg was proclaimed the official Albanian Standard language. However, this variety never succeeded in becoming the basis for a Standard Albanian language and consequently, the two main varieties (North Gheg and Tosk) remained as two separate entities (Lloshi, 1999). Educational books existed both in Gheg and Tosk, and therefore Tosk was taught in Gheg schools and Gheg was taught in Tosk schools (Hetzer & Finger, 1993). After World War II, work on the creation of a sole Standard language was resumed and in 1953, the National Conference on Orthography recommended that literary Albanian should be based on the Tosk variant. According to Hetzer (1995), the new Standard language also contains many Gheg features, especially as concerns morphosyntax, so that, strictly speaking, the Standard Albanian language is not merely a poor copy of the Tosk variety, but is easily distinguishable from the Tosk varieties. The 1968 Conference of Prishtinë marked a pivotal point in the discussion. Under the heading of “One Nation—One Language” the new Standard version was adopted as standard in Kosovo, thus abandoning the Gheg standard.6
Thereby, Albanians in Kosovo answered the Serbian threat of inventing a different Albanian language called “shiftarski jezik” and stabilized their national identification with the rest of Albanians (Lloshi, 1999).
The development of the Standard Albanian was not a natural evolutionary process, but a sociopolitical decision.
- Especially due to foreign rule, but also because of cultural and religious diversity among Albanians, national identity could best and most easily be conveyed via a unified language. The climax of this response towards external pressure was the 1968 Conference of Prishtinë.
- The necessity of a quick response towards external pressure impeded a natural, evolutionary process, a process that usually runs over centuries and during which the cultural and economic elites gradually counterbalance among their varieties (as has been the case e.g., in Dutch, see Haar, 2001).
- Since the compromise of the Elbasan version failed, two equally
potent cultural elites remained. As is often the case when two competing
varieties face each other, the one favored by those holding political
power becomes accepted (e.g., Queen's English, see Schröder, 2001). At that time in Albania,
political powers favored the Tosk variety.7
It has to be appended that basing the Standard Albanian language on the Tosk variety is not only a communist invention. To take the Tosk variety as the basis has its root in the 19th century.
In Albania, the main supporters of Modern Standard Albanian are people with middle and higher education (Nehring, 2002). As concerns the spoken Standard language, it can, however, be assumed that people educated before 1972 might speak different Standard varieties (based on Tosk and Gheg, respectively) in contrast to people educated after 1972.
OBJECT OF INVESTIGATION
The current investigation is an analysis of Modern Standard Albanian as it is spoken by representatives of four important geographical regions. Is it possible to speak of a uniform Standard language or are there considerable differences between the speakers of North and South Albania? Do national borders have an influence on the spoken Albanian Standard? The classification we presented of dialect regions suggests that national borders are of small relevance. The 1968 Conference of Prishtinë fosters the same line of argumentation. On the other hand, language politics of educational systems within and outside the Republic of Albania differ considerably, naturally leaving their marks.
The analysis is based on the articulation of the stressed vowels. Stressed vowels have been chosen because, following the theory of Natural Phonology (Dressler, 1984), it is the stressed positions that are foregrounded, both from a perceptual and from an articulatory point of view. Therefore, if someone intends to speak a Standard variety, he or she will concentrate on the stressed positions in the first instance.8
For an analysis of spontaneous speech and vowels in unstressed positions, see Granser and Moosmüller (2001).
Three high vowels (front unrounded, front rounded, and back rounded)
Three mid vowels (front unrounded, central unrounded, and back rounded)
One low vowel.
Regional differences are to be expected especially as concerns the realization of the schwa, since the Gheg varieties lack this phoneme. On the basis of three educated speakers of Shkodër, Beci (1995) described an unnasalized, unrounded back vowel

in positions where Tosk varieties put a schwa. Beci's observation not only points to the difference with the Tosk varieties, but also to the difference with the Gheg dialects. Therefore, a word like këllëf “cover: indef” would have the following representations:
9As defined in endnote 3.

The Standard varieties, therefore, differ from the Gheg dialects insofar as nasalization and rounding is missing. To further complicate matters, central vowels tend to be articulated either as a front or as a back vowel (see e.g., Fant, 2001 for Swedish; Stratka, 1978 for German, Catalan, Bulgarian, and Chinese; Martin, 1998 for Québécois; Granser & Moosmüller, 2002 for Albanian). Therefore, a surface back unrounded and unnasalized vowel

can be interpreted both as an allophone of

or as a phoneme of its own.
Further differences are to be expected as concerns the realization of the vowel /a/ which has only one representation for Tosk, whereas two phonemes, which additionally differ in duration, have to be assumed for the Gheg varieties.
METHOD
Twelve male subjects with either an academic background or a university entrance diploma (3 from North Albania, 3 from Middle Albania, 3 from South Albania, and 3 from Kosovo) were asked to read a list of words, a list of sentences, a literary text, and to speak spontaneously. For the current investigation, the stressed vowels of the list of read sentences have been analyzed.
The recorded material was digitized at 22.05 kHz, 16 bits using the acoustic workstation STX.10
All prosodically strong vowels (1562 in total) have been labeled and frame-by-frame formant frequency contours have been produced. The first 3 formants were calculated using Linear Predictive Coding (LPC) with 26 coefficients, a preemphasis of 0.9, a frame width of 46 ms, and a 2-ms frame shift. Linear time standardization was performed. One-way analyses of variance (ANOVAs) were calculated for each vowel.For the acoustic description of small vowel inventories, the first two formants (F1 and F2) are sufficient. The vowels of small inventories can therefore be represented in the traditional F1/F2 plane. However, due to the nonlinear relationship between articulatory settings and acoustic output (e.g., Carré, 2004; Stevens, 1989), an F1/F2 representation in Hz is not comprehensive and cannot illustrate articulatory adjustments. The psychoacoustically defined Bark scale links formant values to perception, which seems a more realistic representation (see Iivonen, 1994, 1995 for a discussion). It has to be emphasized, though, that large vowel inventories (e.g., the vowel system of Standard Austrian German) cannot be captured by an F1/F2 chart. The third formant (F3) has to be considered, as well. Processing formant data in Bark additionally yields a normalization, which only points out the perceptually relevant differences. Therefore, it has been decided to additionally present and process data in Bark. The articulatory interpretation of the data has been performed independently and follows the theoretical framework presented in Fant (2004) and Wood (1979).
RESULTS
General results
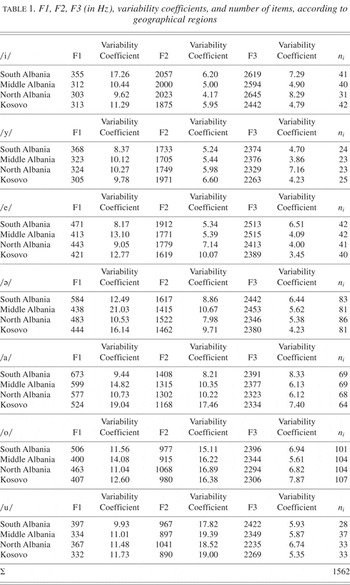
Table 1 gives the mean values, the variability coefficients,
11The variability coefficient is a percentual expression of the variance. It is calculated according to the equation: V = (100*s)/x, where V = variability coefficient, s = standard deviation, and x = arithmetic mean. The variability coefficient allows a comparison of the variance of values with different sizes.

. These results are in accordance with Wood (1979) and Fant (2004).

has alternating locations, in the South, it is predominantly a palatal one, in Middle and North Albania, a central one,
12According to the calculations of Båvegård and Fant (1996), the constriction location of the

is approximately 6.4 cm from the incisors, that is,

is located near [u]. It has, of course, a different constriction degree and lip configuration.
F1, F2, F3 (in Hz), variability coefficients, and number of items, according to geographical regions

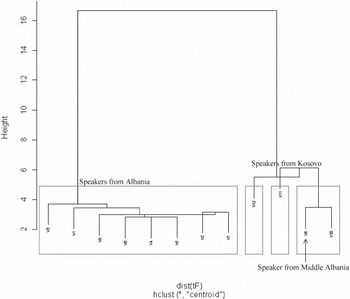
A cluster analysis (see Figure 1) on the raw data of all three formants (in Bark) of all vowels of the 12 speakers produced two main clusters; basically, the Albanian speakers are discerned from the speakers from Kosovo. Only one speaker from Middle Albania is grouped with the speakers from Kosovo. The speakers from Kosovo are further subdivided, each speaker building a cluster of his own.

Cluster analysis of all speakers over the mean values of all vowels (F1, F2, F3 in Bark).
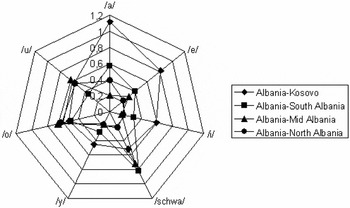
To get a clearer picture of how the speakers from Kosovo differ from the speakers from Albania, Euclidian distances for each vowel from the mean of all Albanian speakers
13Modern Standard Albanian is a young standard, therefore, it is not yet clear which values to define as default values for Modern Standard Albanian vowels. Due to cross-language differences, it is not admissible to take measurements of a language with a similar or even the same vowel inventory as basis. Therefore, it has been decided to take the mean values of all Albanian speakers as starting point.

takes a special position. Speakers from Middle and South Albania and Kosovo show large distances, the distances of South Albania and Kosovo are about equally large; they go, however, in opposite directions (see Figure 3). The speakers from North Albania—except for /o/ and /u/—center quite well around the overall mean values and consequently, expose the shortest distances. These results indicate that the speakers from North Albania do not group with the speakers from Kosovo; this result is also reflected in Pearson's correlation coefficient, which gives no relationship between Kosovo and North Albania (r = −0.31).

Euclidian distances for all vowels (F1, F2, F3 in Bark) of the speakers of four regions to the mean of all Albanian speakers.

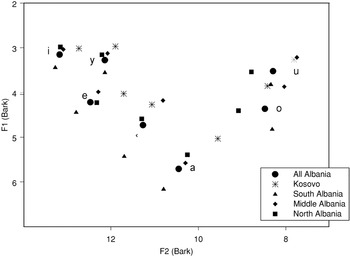
Vowel chart (F1/F2 in Bark) of the mean values of all vowels in strong position. The speakers are grouped according to Albania (speakers from South + Middle + North Albania), Kosovo, South Albania, Middle Albania, and North Albania.
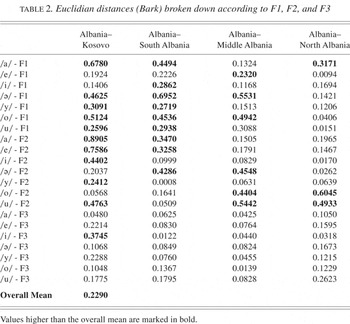
Going into more detail, predominantly the first and second formants are responsible for between-group distances (see Table 2). In Table 2 the values that are higher than the overall mean values of all distances are marked in bold. It can easily be seen that Kosovo has the most marked values, followed by South Albania. Distances are the least for North Albania.
Euclidian distances (Bark) broken down according to F1, F2, and F3

From Table 2 it can be deduced that the distances as concerns the third formant are negligible, therefore the between-group differences can be read off from a F1/F2 plot of the vowels (Figure 3). Figure 3 indicates high between-group variability, and, in fact, the between-group variability is statistically significant for F1 and F2 of all vowels. However, excluding the speakers of Kosovo, F2 of the high front vowels /i/ and /y/ is no more statistically significant.
All the speakers of all four regions show great divergences from the mean Albanian values for the back rounded vowels /o/ and /u/. These great between-group differences are most probably due to great contextual variation in the consonant-vowel-consonant transitions (discussed later). Next come the vowels

. The divergence from the Albanian mean is most pronounced for the vowel /a/ of the speakers from Kosovo; they articulate this vowel as a back vowel

, which is additionally more closed than the Albanian variant. The speakers from South Albania, however, also differ considerably from the Albanian mean with respect to the vowel /a/. Their variant is a front vowel /a/. All speakers except the speakers from North Albania diverge considerably from the mean value of the mid central vowel

. The difference is most pronounced for the speakers from South Albania, who expose a front and more open articulation

, whereas the speakers from Kosovo and Middle Albania prefer a back configuration

. As concerns the front vowels /i, y, e/, only the speakers from Kosovo diverge considerably from the mean values.
These overall results show that the speakers from Kosovo diverge considerably from the speakers from Albania, and, most interestingly, they diverge especially from the speakers from North Albania, although, from a dialectological point of view, the speakers from North Albania and Kosovo should have similar results. A detailed look at within-vowel variability offers a further understanding of the data.
Within vowel variability
The back rounded vowels
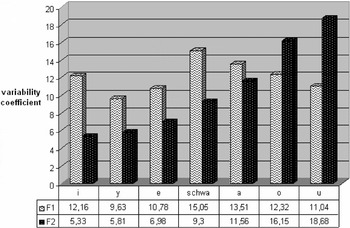
Within vowel variability is high especially among the back rounded vowels, the schwa and /a/ (see Figure 4).The highest variability is found for the second formant among the back rounded vowels /o/ and /u/. This variability, however, is solely due to phonetic context. A sequence like

tona ‘our: fem’ or

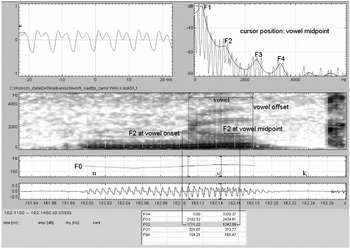
kush ‘who’ starts with a high F2, changes slowly towards a more or less low F2 (target) and then rises again towards the next segment. As an example, Figure 5 shows the sequence nuk /nuk/ ‘not: adv’. The duration of the vowel is 70 ms; due to the alveolar place of articulation of the preceding segment, F2 starts very high. Though F2 continuously drops, it does not ultimately reach the values for an adequate target for the vowel /u/, due to the velar place of articulation of the following segment. Cases such as these are, of course, well known in phonetics; in the current investigation, they account for the high variability of the back rounded vowels /o/ and /u/. Therefore, the high variability of the back rounded vowels is phonetically motivated, consequently having no sociolinguistic impact and is therefore no longer of interest in this investigation.

Variability coefficients of all vowels (F1, F2) analyzed, pooled over all speakers.

Spectrogramm of nuk ‘not: ADV’ of a male speaker from Durrës (speaker 5). Bottom panel: waveform window; next to bottom panel: fundamental frequency (F0); middle panel: spectrogram window; left upper panel: waveform zoom window; right upper panel: amplitude spectrum window.
The vowel /a/
The high variability of the vowels

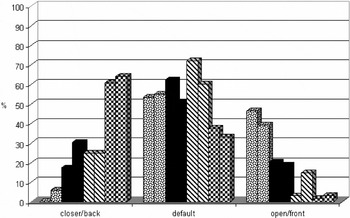
, however, cannot to be explained very easily. In the previous section it has been shown that the vowel /a/ exposes the most striking differences between the four geographical regions. Yet, all speakers have a high range of within-speaker variability, as well. To investigate this within-speaker variability, three zones have been defined for both F1 and F2 of the vowel /a/ (see Figure 6). For each formant, the mean value of all Albanian speakers has been calculated and set as the default value. Starting from this default value, ± 0.5 Bark gave the default range. Values higher than the default range were defined as either open (F1) or front (F2) articulation. Values lower than the default range were defined as either more closed (F1) or back (F2) articulation. For the vowel /a/, this calculation gave a default range of 560–670 Hz for F1 and a default range of 1240–1440 Hz for F2.

The defined zones for the vowel /a/. South Albania: black dots on white; Middle Albania: black; North Albania: angular stripes on white; Kosovo: chessboard pattern. The first bar of each region represents F1, the second bar represents F2.
Each region is represented to a different degree in each zone (see Figure 6) except for the low F1, which never occurs for the speakers from South Albania. The speakers from South Albania hardly ever articulate a back vowel

, whereas the speakers from Kosovo hardly ever articulate a front vowel [a]. The default values are achieved most frequently by the speakers from Albania, the speakers from Kosovo predominantly articulate a back vowel, which can be additionally rounded. Nevertheless, both the back and the front configuration of the vowel /a/ can be found in the realizations of all speakers from all geographical regions. The differences between the geographical regions concern the quantitative distribution of a given configuration, but not the quality.
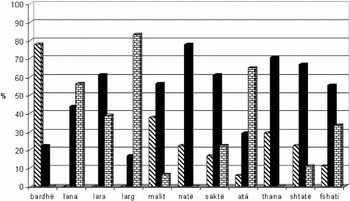
Furthermore, the observed variability is context-independent. It is not phonetically motivated and is not even consistent within one and the same item. Though the stressed vowel /a/ in thana ‘cornel: def’ is articulated as a back vowel twice by speaker 6 (Middle Albania), he articulates it once as an open vowel and once as a more closed vowel. The same speaker realizes the stressed vowel /a/ in atá ‘they: pron-masc’ once as a back vowel and once as a front vowel. Figure 7 gives the distribution of back, default and front articulation (in percent) of selected items.

Itemized distribution of the defined zones of the vowel /a/ in stressed position as realized by the speakers from Albania. F2 < 1240 Hz: angular stripes on white; F2 = 1240–1440 Hz: black; F2 > 1440 Hz: bricks.
It can be seen in Figure 7 that high agreement as regards front or back articulation can only be observed for two items: i/e bardhë ‘white: adj’ favors a clear back articulation (78%) and larg ‘far: adv’ a clear front articulation (83%). Not even a nasal environment triggers a back articulation of the vowel, as can be concluded from the items lana ‘Lana (name of a river)’, malit ‘mountain: abl’, natë ‘night: indef’, and thana ‘cornel: def’. Therefore, it is not possible to deduce which vowel quality will occur from either the item as such, or from the phonetic context.
However, one further trace should be considered. According to Beci (1995), the Gheg dialects discern four different low vowels: a short front vowel /a/ and a long back vowel

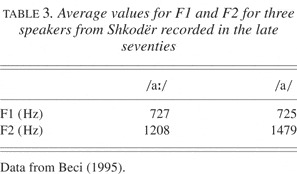
. Both vowels can occur either as oral or nasal vowels. As concerns openness, the long and short vowel do not differ, the difference only affects the front/back dimension. Average values for F1 and F2 for the oral vowels according to the results of Beci (1995) are given in Table 3.
Average values for F1 and F2 for three speakers from Shkodër recorded in the late seventies

The results presented in Table 3 are consistent, that is, items with defined long /a/ vowels are always articulated as back vowels and items with defined short /a/ vowels are always articulated as front vowels.14
Unfortunately, Beci (1995) did not give any values for duration; his distinctions are based on theoretical assumptions.
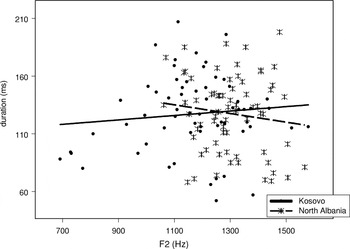
Following the line of traditional dialectology, the speakers grouped as Gheg speakers are from North Albania and Kosovo. Since the correlation of quantity and quality is described as a Gheg feature, it has been tested in the current investigation, whereas the speakers from North Albania and Kosovo expose the same correlation between vowel duration and vowel quality. Figure 8 gives a duration/F2 plot for all /a/ vowels of the speakers from North Albania and Kosovo.

Scatterplot duration / F2 of all /a/vowels in stressed position of the speakers of North Albania and of Kosovo.
It can be seen from Figure 8 that there is absolutely no correlation between vowel duration and vowel quality for the speakers from North Albania (Pearson's r = −0.13) or the speakers from Kosovo (Pearson's r = 0.11).
Therefore, it can be concluded that the distribution as concerns the quality of the vowel /a/ is independent of the phonetic context and that each vowel quality can be observed in each geographical region, though to a different degree.
The central vowel


The case of the central vowel

is similar to that of /a/. The variability both on the high/low dimension and on the front/back dimension is large. The articulation of the schwa at its extremes reaches from a rather high or a rather low back articulation

to a mid or low front articulation

. All intermediate steps can be observed in between, that is, on all dimensions graduality is given. It has to be emphasized that the back articulation is both [-round] and [-nasal] (except for nasal environment) for all speakers (Granser & Moosmüller, 2002), and therefore clearly differs from the Gheg dialect, which shows a back, rounded, nasal vowel instead (Beci, 1995).
15However, it has to be noted that the speakers analyzed by Beci (1995), who are educated speakers, do not use the so described dialect variant either, but articulate a back unrounded vowel. Therefore, even in the analysis conducted by Beci, social differences emerge, although they are not named.

For many languages it has been observed that phonemic schwa vowels show a tendency towards the periphery, either front or back. Fronting has taken place in Québécois, where the schwa has merged with

(Martin, 1998).
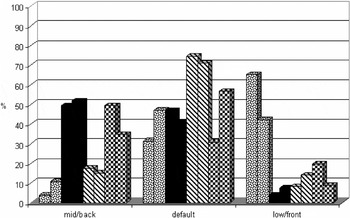
Three zones have been defined in the same way as for the vowel /a/, resulting in a default (central) range of 445–560 Hz for F1 and of 1410–1640 Hz for F2. It can be seen from Figure 9 that all speakers of all four regions are represented in each articulation zone, though, as it has been observed for the vowel /a/, as well, to a different degree. Contrary to the results for the vowel /a/, speakers from Kosovo do not diverge that much from the Albanian speakers.

The defined zones for the vowel . South Albania: black dots on white; Middle Albania: black; North Albania: angular stripes on white; Kosovo: chessboard pattern. The first bar of each region represents F1, the second bar represents F2.
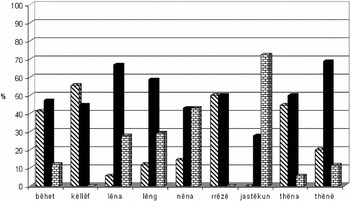
In the same way as for the vowel /a/, the variability of the schwa is context-independent; neither a phonetic motivation (e.g., consonantal environment) nor a dependency on specific lexical items could be found. Figure 10 gives the distribution of the articulation of the

with respect to some selected items.

Itemized distribution of the defined zones of the vowel in stressed position as realized by the speakers of Albania. F2 < 1410 Hz: angular stripes on white; F2 = 1410–1640 Hz: black; F2 > 1640 Hz: bricks.
Only the item jastëkun ‘cushion: def–acc’ shows a relatively clear preference for front articulation; no clear preference can be observed for the other items. Some items completely lack either front (këllëf ‘cover: indef’ or rrëzë ‘at the foot of:

) or back (jastëkun ‘cushion: def–acc’) articulation, but no item is restricted to only one zone. The predominantly back articulation in këllëf might be additionally phonetically motivated, since both the plosive and the lateral are velar consonants. However, no such motivation can be found for rrëzë, which exposes a high amount of back articulation, as well. Therefore, in the same way as for the vowel /a/, it can be concluded that the variability of the schwa is independent of the phonetic context and that each vowel quality can be observed in each geographical region, though to a different degree.
The front vowels
The front vowels /i, y, e/ expose the least amount of variability, both between groups and within items. From a sociolinguistic point of view, the differences are only relevant as concerns the speakers from Kosovo, who expose a different formant pattern.
DISCUSSION
Traditional Albanian dialectology emanates from a dialectal continuum that is not determined by political borders. This assumption cannot be made for Modern Standard Albanian. There are striking differences between the speakers from Kosovo and speakers from the Republic of Albania, affecting all vowels of the Standard vowel system. Given the fact that educational systems have a large impact on the adoption of Standard forms (Hernández-Campoy & Jiménez-Cano, 2003) and the fact that from 1972 onwards Modern Standard Albanian has been taught at all schools in the Republic of Albania, these results are not surprising. Moreover, the importance of national borders, both for the creation and for the maintenance of a Standard language, has often been pointed out (e.g., Barbour & Stevenson, 1990; Hernández-Campoy & Jiménez-Cano, 2003). The formation of a new nation largely fosters the wish for a Standard language (see e.g., the formation of Austrian Standard German, Moosmüller, 1991).
Modern Standard Albanian is a young standard and, moreover, has not naturally or gradually evolved. Milroy's (2001) definition of standardization being the imposition of a “legitimized” uniformity upon linguistic variation for prestige reasons might be questioned, especially for German (Kuhlmann, 1999); however, on first sight, it seems to hold for the formation of the Modern Albanian Standard. From 1972 onwards, the prescribed Standard language has been taught in schools and has been used in the media and literature.
Methodologically and theoretically, one has to decide whether to analyze a Standard variety in interaction with other (regional or social) varieties, or whether to investigate the speech behavior of social elites across geographically defined regions, and consequently, remain within the same social variety. The first type of investigation we find, for example, in Hernández-Campoy & Jiménez-Cano (2003) on the spread of the Standard in Murcian Spanish, where the Standard variety “wins” over the local dialects. According to Trudgill's (1986) definition, this would point to a case of diffusion. On the other hand, in dealing with the speech behavior of regionally diverse social elites, leveling—again according to Trudgill (1986), the reduction or attrition of sociolinguistically marked variants—rather than diffusion can be observed (see e.g., the studies by Kerswill, 2001 or Fabricius, 2002, both on Received Pronunciation).
In the current investigation, being of the second type, things look a bit different. The high amount of variability of vowel production would point to a situation of diffusion (Kerswill, 2002). This would mean that the Tosk-based Standard would diffuse in some way or other into the Gheg-based varieties. However, this is not the case. No decrease of Standard vowel articulation from the South towards the North can be observed; on the contrary, the speakers from North Albania seem to be the least divergent from the defined default values (see Figure 2). Therefore, it cannot be said that the Tosk-based Standard variety is gradually replacing the Gheg variety of the cultural elite.
On the other hand, strictly speaking, neither can we say that it is a situation of leveling, as observed for RP. In British English, there exists a well-defined and officially accepted Standard variety which has its historically positioned speakers (the social elites). This variety simply undergoes certain changes.
Modern Standard Albanian is also well defined and officially accepted, however, this variety lacks historicity. This opens the possibility for the speakers of all regions who work with the alleged variety, to take the prescribed Standard rather as a frame within which one can move. It rather looks as if the North influences the South and the South influences the North, so that ultimately, a counterbalanced Standard variety might emerge. A further example will exemplify this interpretation.
In the Gheg varieties, final unstressed schwas are deleted. The modern Standard variety, based on Tosk, prescribes the articulation of word-final schwa, as can be seen from the following examples:

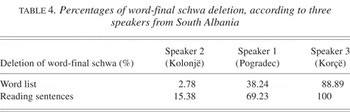
However, word-final unstressed schwa is deleted even by the speakers from South Albania, though to different degrees and dependant on the speech style (least often in the word list, more often in the reading list of sentences, see Table 4).Two results important for the hypothesis that word-final schwa deletion will be adopted by Tosk speakers can be read from Table 4:
- The eldest speaker (speaker 2) exposes the least amount of schwa deletion, and
- All speakers expose a higher amount of schwa deletion in reading sentences as compared to reading the word list.
Percentages of word-final schwa deletion, according to three speakers from South Albania

Therefore, it can be assumed that Modern Standard Albanian will adopt this feature traditionally ascribed to Gheg varieties.17
One Northern Albanian speaker, when reading the word list, did not apply word-final schwa deletion. After having read the list once, he pondered upon the fact that, usually, this vowel is not pronounced in such position. He then replicated this reading task.
For the Gheg varieties, it is also described that the preceding stressed vowel is lengthened by final schwa deletion (compensatory lengthening). This coupled process could, however, not be observed for any of the speakers. For the Tosk speakers, it could be tested whether there is a difference in vowel duration according to schwa deletion or schwa pronunciation. The Pearson correlation coefficient reveals no such difference(r = 0.79). For the Gheg speakers (North Albania and Kosovo) minimal pairs of the type vete

versus vetë

have been compared, again rendering no differences in the duration of the preceding stressed vowel (r = 0.65).
Therefore, it is not so much a spread or diffusion going from South to North that can be observed, but rather a counterbalance among the educated people of the whole of Albania to gradually form a Standard language on the basis of the prescribed variety.
References
REFERENCES
Barbour, Stephen, &
Stevenson, Patrick.
(1990).
Variation in German: A critical approach to German
sociolinguistics.
Cambridge:
Cambridge University Press.
Båvegård, Mats, &
Fant, Gunnar.
(1996).
Parameterized VT Area Function Inversion.
Paper presented at the 4th International Conference on Spoken
Language Processing, Philadelphia, PA, October 3–6.
Beci, Bahri.
(1995).
Të folmet veriperëndimore të Shqipërisë dhe
sistemimi fonetik i së folmes së Shkodrës.
Tiranë,
Akademia e Shkencave e RSh.
Byron, Janet.
(1976).
Selection among alternates in language standardization: The case of
Albanian.
The Hague:
Mouton.
Carré, René.
(2004).
From an acoustic tube to speech production.
Speech Communication
42:227–240.Google Scholar
Coulmas, Florian.
(2000).
Die Frage des Standards.
Grazer Linguistische Monographien
11:21–34.Google Scholar
Desnickaja, Agnija V.
(1968).
Albanskij jazyk i ego dialekty
[Die albanische Sprache und ihre Dialekte].
Leningrad:
Nauka.
Dressler, Wolfgang U.
(1984).
Explaining natural phonology.
Phonology Yearbook
1:29–50.Google Scholar
Fabricius, Anne.
(2002).
Weak vowels in modern RP: An acoustic study of happy-tensing and
KIT/schwa shift.
Language Variation and Change
14:211–237.Google Scholar
Fant, Gunnar.
(2001).
Swedish vowels and a new three-parameter model.
TMH-Quarterly Progress and Status Report
1:43–49.Google Scholar
Fant, Gunnar.
(2004).
Speech acoustics and phonetics: Selected writings.
The Hague:
Mouton.
Granser, Theodor, &
Moosmüller, Sylvia.
(2001).
The schwa in Albanian.
Proceedings of the 7th International Conference on Speech
Communication and Technology, Eurospeech, Aalbourg.
317–320.
Granser, Theodor, &
Moosmüller, Sylvia.
(2002).
Phonemic schwa—A challenge for natural phonology? The case of
Albanian.
In
K. Dziubalska-Kołaczyk &
J. Weckwerth (eds.),
Future challenges for natural linguistics.
München:
Lincom Europa.
165–178.
Haar, Carel ter.
(2001).
Die niederländische Hochsprache. In
K. Ehlich,
J. Ossner, &
H. Stammerjohann (eds.),
Hochsprachen in Europa. Entstehung, Geltung, Zukunft.
Freiburg im Breisgau:
Fillibach.
123–144.
Hernández-Campoy, Juan Manuel,
&
Jiménez-Cano, José
María.
(2003).
Broadcasting standardisation: An analysis of the linguistic
normalisation process in Murcian Spanish.
Journal of Sociolinguistics
7(3):321–347.Google Scholar
Hetzer, Armin.
(1995).
Nominalisierung und verbale Einbettung in Varietäten des
Albanischen.
Wiesbaden:
Harrassowitz.
Hetzer, Armin, &
Finger, Zuzanna.
(1993).
Lehrbuch der albanischen Schriftsprache.
Hamburg:
Helmut Buske.
Iivonen, Antti.
(1994).
A psychoacoustical explanation for the number of major IPA
vowels.
Journal of the International Phonetic Association
24:73–90.Google Scholar
Iivonen, Antti.
(1995).
Explaining the dispersion of the single-vowel occurrences in an
F1/F2 Space.
Phonetica
52:221–227.Google Scholar
Kerswill, Paul.
(2001).
Mobility, meritocracy and dialect leveling: The fading (and phasing)
out of received pronunciation.
Proceedings of the Third Tartu Conference on British
Studies.
University of Tartu,
Estonia. (http://www.shunsley.eril.net/armoore/lang/dialect.PDF).
Kerswill, Paul.
(2002).
Koineization and accommodation. In
J. K. Chambers,
P. Trudgill, &
N. Schilling-Estes (eds.),
The handbook of language variation and change.
Oxford:
Blackwell.
669–702.
Kuhlmann, Heide.
(1999).
Orthographie und Politik. Zur Debatte um die deutsche
Rechtschreibreform.
Hannover:
Magisterarbeit.
Lloshi, Xhevat.
(1999).
Albanian. In
U. Hindrichs (ed.),
Handbuch der Südosteuropa-Linguistik.
Wiesbaden:
Harrasowitz Verlag.
277–299.
Martin, Pierre.
(1998).
À Québec, a-t-on l'schwa? In
Y. Duhoux (ed.),
Langue et langues. Hommage à Albert Maniet.
Louvain-la-Neuve:
Peeters.
163–179.
Milroy, James.
(2001).
Language ideologies and the consequences of standardization.
Journal of Sociolinguistics
5:530–555.Google Scholar
Moosmüller, Sylvia.
(1991).
Hochsprache und Dialekt in Österreich: Soziophonologische
Untersuchungen zu ihrer Abgrenzung in Wien, Graz, Salzburg und
Innsbruck.
Köln, Weimar:
Böhlau.
Nehring, Gerd-Dieter.
(2000).
Der albanische Alphabetenkongress 1908: Reflexionen aus
standardsprachlicher Sicht.
Zeitschrift für Balkanologie
36:57–75.Google Scholar
Nehring, Gerd-Dieter.
(2002).
Albanisch. In
M. Okuka &
G. Krenn (eds.),
Lexikon der Sprachen des europäischen Ostens.
Klagenfurt/Celovec:
Wieser Verlag.
47–65.
Schröder, Konrad.
(2001).
Englisch als Nachbarsprache, Englisch als internationale
Sprache.
In
K. Ehlich,
J. Ossner, &
H. Stammerjohann (eds.),
Hochsprachen in Europa: Entstehung, Geltung, Zukunft.
Freiburg im Breisgau:
Fillibach.
301–308.
Stevens, Kenneth N.
(1989).
On the quantal nature of speech.
Journal of Phonetics
17:3–46.Google Scholar
Stratka, Georges.
(1978).
A propos du classement articulatoire des voyelles. In
Hans-Heinrich Wängler (ed.),
Festschrift für Otto von Essen.
Hamburg:
Buske.
437–460
(Hamburger Phonetische Beiträge 25).
Trudgill, Peter.
(1986).
Dialects in contact.
Oxford:
Blackwell.
Wood, Sidney.
(1979).
A radiographic analysis of constriction location for vowels.
Journal of Phonetics
7:25–43.Google Scholar
F1, F2, F3 (in Hz), variability coefficients, and number of items, according to geographical regions
Cluster analysis of all speakers over the mean values of all vowels (F1, F2, F3 in Bark).
Euclidian distances for all vowels (F1, F2, F3 in Bark) of the speakers of four regions to the mean of all Albanian speakers.
Vowel chart (F1/F2 in Bark) of the mean values of all vowels in strong position. The speakers are grouped according to Albania (speakers from South + Middle + North Albania), Kosovo, South Albania, Middle Albania, and North Albania.
Euclidian distances (Bark) broken down according to F1, F2, and F3
Variability coefficients of all vowels (F1, F2) analyzed, pooled over all speakers.
Spectrogramm of nuk ‘not: ADV’ of a male speaker from Durrës (speaker 5). Bottom panel: waveform window; next to bottom panel: fundamental frequency (F0); middle panel: spectrogram window; left upper panel: waveform zoom window; right upper panel: amplitude spectrum window.
The defined zones for the vowel /a/. South Albania: black dots on white; Middle Albania: black; North Albania: angular stripes on white; Kosovo: chessboard pattern. The first bar of each region represents F1, the second bar represents F2.
Itemized distribution of the defined zones of the vowel /a/ in stressed position as realized by the speakers from Albania. F2 < 1240 Hz: angular stripes on white; F2 = 1240–1440 Hz: black; F2 > 1440 Hz: bricks.
Average values for F1 and F2 for three speakers from Shkodër recorded in the late seventies
Scatterplot duration / F2 of all /a/vowels in stressed position of the speakers of North Albania and of Kosovo.
The defined zones for the vowel . South Albania: black dots on white; Middle Albania: black; North Albania: angular stripes on white; Kosovo: chessboard pattern. The first bar of each region represents F1, the second bar represents F2.
Itemized distribution of the defined zones of the vowel in stressed position as realized by the speakers of Albania. F2 < 1410 Hz: angular stripes on white; F2 = 1410–1640 Hz: black; F2 > 1640 Hz: bricks.
Percentages of word-final schwa deletion, according to three speakers from South Albania
 You have
Access
- 8
- Cited by