Introduction
Performance indicators are all the rage in comparative analyses of health care systems (Schneider and Squires, Reference Schneider and Squires2017). Analysts invoke scorecards, rankings, report cards, benchmarks, and a dizzying number of metrics and data sources in the quest to measure performance. We focus here on one indicator frequently used to assess access to effective ambulatory care – hospitalization for ambulatory care sensitive conditions (ACSC). The research in this paper grew out of a meeting of researchers and policymakers in Québec and New York City focused on ACSC hospitalizations in the two largest cities in the Province of Québec and New York State – Montreal and New York. We focus on what our analysis reveals about each city, as well as how it might contribute to the long history of comparing the health care systems of the United States and Canada.
Health care financing in Canada and the United States were similar in the mid-1950s, but after Canada consolidated its hospital and medical insurance programs across 13 provinces and territories (1957–1972), the nations’ health systems diverged (Canadian Museum of History, 2007). Canadian public health insurance system offers universal, first-dollar coverage for hospital and physician services. The United States – even after implementation of the Patient Protection and Affordable Care Act (ACA) – continues to operate a patchwork system of public and private health insurance with roughly eight million uninsured and many million more underinsured residents. The Canadian health system is defended by proponents as a model of national health insurance (NHI) that would improve access to ambulatory care in the United States (PNHP; Marmor). Less enthusiastic critics note that despite recent success in reforming primary care, for example in Québec and Ontario, Canadian health care continues to be an ‘underachiever’ (Lewis, Reference Lewis2015).
Based on a 2014 Commonwealth Fund report assessing health care system performance in 11 high-income nations, the US ranks last (11th) on overall performance, and Canada comes out as 10th (Davis et al., Reference Davis, Stremikis, Squires and Schoen2014). The gap between last and second-to-last is still striking, as evidenced by the following findings. Due to cost concerns, 39% of US respondents did not visit a doctor, 31% did not obtain a recommended test, treatment or follow-up, and 30% did not fill a prescription or skipped a dose (Schoen et al., Reference Schoen, Osborn, Squires and Doty2013). In Canada, only 7, 14 and 8%, respectively, reported experiencing the same cost-related access barriers (Schoen et al., Reference Schoen, Osborn, Squires and Doty2013). Despite these differences between Canadian and US respondents, neither proponents nor critics of Canadian NHI would rest their case only on three indicators based on survey data. There are many more dimensions of health system performance to consider, all of which must be interpreted in the social and institutional context of their respective health care systems. Indeed, there is a literature of empirical studies comparing the Canadian and US health systems to which this paper seeks to contribute in two respects.
Our first concern is methodological. Since both Canada and the United States are federal systems allowing for considerable health policy variation among provinces and states, we think it is important to focus on specific provinces, states or cities to improve understanding of health system performance. After using a common indicator (ACSC hospitalizations) to assess access to effective ambulatory care in Montreal and New York, we explore how a comparison of these cities can shed light on the importance of social and institutional context for interpreting performance indicators.
Our second concern is substantive. We focus on whether health insurance improves access to ambulatory care. Within New York, in comparing access of all residents to Medicare beneficiaries 65 years of age and over, we present evidence of how health insurance coverage may affect hospitalization rates for ACSC (hereafter referred to as ACSC rates) within the same social and institutional context. Yet, one has only to examine the experience of health systems with NHI coverage to recognize that this does not solve all access problems. Although eliminating financial barriers is a necessary condition for improving access to health services, it is clearly not sufficient (Levesque et al., Reference Levesque2013). Despite recent efforts to improve access to high-quality primary care in Québec and Ontario, the effects have been modest, at best (Riverin et al., Reference Riverin, Li, Naimi and Strumpf2017). In following this line of research, we update and extend previous studies by Billings et al. (Reference Billings, Anderson and Newman1996) on selected US and Canadian cities, Roos and Mustard on Winnipeg in the province of Manitoba, and Gusmano et al. (Reference Gusmano, Rodwin and Weisz2006) on New York, London and Paris. In addition, we extend previous work on variations in Canadian ACSC rates (Sanchez et al., Reference Sanchez, Vellanky, Herring, Liang and Jia2008) by including Québec.
We begin with our rationale for comparing urban health systems, followed by an explanation of our methods and presentation of findings along three dimensions: (1) average age-adjusted ACSC rates in Montreal and New York, highlighting population-wide comparisons with those among older people (65+) who have universal health insurance coverage in both cities; (2) variation across neighbourhoods within each city, highlighting the relationship between neighbourhood poverty and ACSC rates; (3) results of logistic regression analyses for each city, which estimate the association between ACSC rates and neighbourhood poverty (per cent of households with income below half of the median), controlling for other potential confounders. In our discussion of these findings, we suggest that the use of ACSC rates to assess the cross-national performance of ambulatory care should not be separated from further analysis of social and institutional context, including health system organization. We conclude with hypotheses for future research, and based on conversations at our meeting of researchers and policymakers, propose some opportunities for mutual learning among local policymakers struggling to address the ambulatory care needs of an aging population with growing rates of chronic illness.
Rationale for comparing urban health systems
An important advantage of comparing health systems in cities is the ability to examine “comparable spatial boundaries within which to assemble local data on the characteristics of populations, the density of medical resources, the extent of health insurance coverage, and other neighbourhood and health system characteristics” (Rodwin and Gusmano, Reference Rodwin and Gusmano2002). For this reason, we focus our comparison of Montreal and New York on the geographic boundaries delineated by the islands of Montreal and Manhattan (New York County). These boundaries differ from the City of Montreal and the City of New York. The islands of Montreal and Manhattan, referred to as Montreal and New York in the rest of this paper, share many important characteristics. Both are the historic centers of their respective cities, have similar population size (1.6 million in New York; 1.9 million in Montreal), and similar life expectancies at birth. Both cities have diverse populations including a large number of foreign-born residents (28.9% in New York and 30.7% in Montreal) and a mix of some of the highest and lowest-income populations within their respective nations. In New York, 31% of households were below one-half of the median household income in 2011; in Montreal, the comparable figure is ~22%.
Both cities function as central hubs for employment and medical resources, with Manhattan hospitals drawing 41% of their patient admissions from the rest of the New York City boroughs and beyond while the corresponding figure in Montreal is 29%. This concentration of tertiary care, both academically-affiliated and not, is a common characteristic among these cities. In contrast to Montreal, however, New York has a much higher physician and hospital bed density (Table 1).
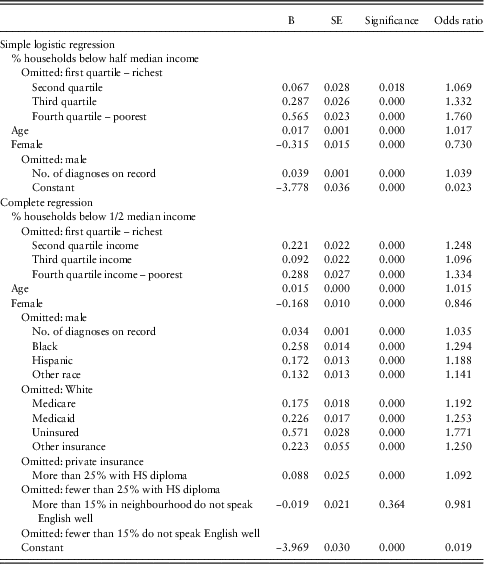
Logistic regression results for characteristics associated with ambulatory care sensitive conditions hospitalizations in Manhattan, total population, 2011–2013

Sources: Hospital discharge data for the period 2011–2013 are from the Statewide Planning and Research Cooperative System (SPARCS), which includes information for all residents of New York discharged from all non-Federal hospitals in New York State, excluding the population cared for in Veterans Administration hospitals. Household income and population data for New York are from the American Community Survey, 2011–2013.
Reflecting the Federal and provincial/state systems in which they reside, health insurance coverage is quite different in Montreal and New York. Nearly all residents of Montreal have first-dollar health insurance coverage (with no co-insurance) for hospital and physician services under the Régie de l’Assurance Maladie du Québec (RAMQ), the Québec Health Insurance Agency. Universal coverage for prescription drugs in Québec is provided by a mix of public and private insurance. Important gaps in coverage still exist for other services, notably outpatient mental health and dental care.
Although the ACA has expanded health insurance coverage, and New York State has a generous Medicaid programme, hundreds of thousands of New Yorkers remain uninsured and thousands of others are underinsured with high-deductible health plans that do not provide first-dollar coverage for primary and preventive care. As a result of national and state policies, New York City, like the rest of the United States, relies on a fragmented employer-based private health insurance system and public health insurance coverage for eligible beneficiary groups such as older or severely disabled people (Medicare), very poor people (Medicaid), children whose parents’ income does not meet Medicaid eligibility standards (Child Health Insurance Program) and veterans (Veterans Health Administration). Since the implementation of the ACA, there is now the option for all legal residents to purchase subsidized health insurance on regulated markets. Such health insurance must provide a standardized set of ‘essential benefits’ with some choice among varying deductibles and co-insurance; but they are characterized by restricted networks of preferred providers, outside of which health care becomes even more expensive.
Compared to health insurance coverage, the organization and delivery of health care services are somewhat more similar in these two cities. The majority of primary care physicians in both Montreal and New York work in private, office-based fee-for-service practices, with solo practices becoming rare. In New York, large multispecialty groups and hospital-owned practices increasingly dominate the market, and new walk-in centers (retail clinics and urgent care centers), are growing across the city, many in such corporate pharmacies as CVS, Duane Reade and Walgreens. All of these practices share complex contracting arrangements with multiple payers. In addition, there is a continually changing organization of safety-net providers who care for the uninsured and undocumented. In Montreal, Family Medicine Groups and Network Clinics are making multidisciplinary, team-based practices increasingly common. These clinics are usually independently managed by the participating physicians. Integrated Health and Social Services Centres (CISSS/CIUSSS) are regional health authorities responsible for managing local health and social service networks that operate within their geographic borders. These networks include local community health centres, community groups, pharmacies, some hospitals and other partners (Ministère de la Santé et des Services sociaux, 2015).
Methods
ACSC rates as an indicator of access to ambulatory care
ACSC rates are recognized – in the United States, Canada, Spain and Britain – as a valid indicator of access to ambulatory care (Casanova and Starfield, Reference Casanova and Starfield1995; Sanderson and Dixon, Reference Sanderson and Dixon2000; Brown et al., Reference Brown, Goldacre, Hicks and Rourke2001), ACSCs are diagnoses for which access to timely and appropriate primary care services, including specialty services for the management of chronic disease, should decrease or avoid the need for hospitalization. Examples of such diagnoses include congestive heart failure, asthma and diabetes.
High ACSC rates, among residents of an area, often reflect barriers to primary care (Pappas et al., Reference Pappas, Hadden, Kozak and Fisher1997), an important measure of access. Previous research in the United States and Canada suggests that individuals without health insurance, as well as those with insurance from lower-income neighbourhoods, are more likely to be admitted to hospitals with ACSC because they are less likely to receive appropriate and timely ambulatory care (Hadley et al., Reference Hadley, Steinberg and Feder1991; Weissman et al., Reference Weissman, Gatsonis and Epstein1992; Billings et al., Reference Billings, Anderson and Newman1996; Roos and Mustard, Reference Roos and Mustard1997; Gusmano et al., Reference Gusmano, Rodwin and Weisz2006). ACSC hospitalizations are also considered an indicator of the quality of primary care (Shah et al., Reference Shah, Gunraj and Hux2003).
Data sources
For Montreal, hospital admissions data for the period (FY 2007/08–2009/10) are from the RAMQ, the agency responsible for the administration of public health insurance coverage and paying physicians for the services they provide. Household income data at the neighbourhood and city levels are from Statistics Canada’s National Household Survey (Statistics Canada, 2011). Population data (2009) for Montreal are from the Institut de la statistique du Québec, Direction des statistiques sociodémographiques. For New York, hospital discharge data for the period 2011–2013 are from the Statewide Planning and Research Cooperative System, (SPARCS), which includes information for all residents of New York discharged from all non-Federal hospitals in New York State, excluding the population cared for in Veterans Administration hospitals. Household income and population data for New York are from the American Community Survey, 2011–2013.
Hospitalizations for ACSC and age adjustment
We classified individual hospitalizations using the definition of ACSC developed by Joel Weissman et al., which has been validated by previous studies (Weissman et al., Reference Weissman, Gatsonis and Epstein1992; Casanova and Starfield, Reference Casanova and Starfield1995; Billings et al., Reference Billings, Anderson and Newman1996; Pappas et al., Reference Pappas, Hadden, Kozak and Fisher1997; Backus et al., Reference Backus, Moron, Baccheti, Baker and Bindman2002; Sanchez et al., Reference Sanchez, Vellanky, Herring, Liang and Jia2008). The Weissman definition includes pneumonia, congestive heart failure, asthma, cellulitis, perforated or bleeding ulcer, pyelonephritis, diabetes with ketoacidosis or coma, ruptured appendix, malignant hypertension, hypokalemia, five immunizable conditions and gangrene (Weissman et al., Reference Weissman, Gatsonis and Epstein1992).
We calculated three-year average ACSC rates at the city and ‘neighbourhood’ levels. For Montreal, neighbourhoods are considered as the 12 Health and Social Services Centres on the island during the study period (now aggregated into CISSS/CIUSSS); for New York, we used the United Hospital Fund’s 10 neighbourhoods in Manhattan. In calculating age-adjusted cohorts, we employed the direct standardization method using the 2009 Montreal population to calculate adjustment weights (Klein and Schoenborn, Reference Klein and Schoenborn2001).
Regression models
To identify the factors that are associated with differences across and within Montreal and New York, we rely on multiple logistic regression models to estimate the correlation between selected variables and the odds of hospitalization for ACSC. The first regression relies on a simple model that includes independent variables measured in comparable ways in both cities. These include individual-level variables: age, gender, number of diagnoses on the record (at hospital admission or discharge); and the neighbourhood-level share of households below half of the gross median household income, by quartiles, which allows us to measure neighbourhood poverty levels in a comparable way across cities. In Montreal this is the per cent of households with gross income below $20,000 (Canadian) and in New York it is the per cent below US $32,500.
In addition to this simple model, we also estimate separate models for each city, which add differentially available independent variables that may influence ACSC rates. In New York, we add insurance status (Medicare, Medicaid or uninsured), race/ethnicity, an indicator for more than 25% of neighbourhood residents having a high-school diploma, and an indicator for more than 15% of the population five years and over who do not speak English well. In Montreal, we add indicators for certain diagnosed chronic conditions (diabetes, hypertension, heart failure and chronic obstructive pulmonary disease), as well as quintiles of the material deprivation index, an area-level measure of socioeconomic status based on postal code of residence. We also add the resource utilization band (RUB), a six-level categorical variable that captures expected quantity and intensity of health care services utilization. The RUB is based on diagnostic codes and Adjusted Clinical Groups (ACGs) for each patient in the previous 12 months (The Johns Hopkins ACG System, 2011). Patients in the same RUB category do not necessarily have clinically related diagnoses, but rather their expected relative resource use is similar. RUB category 0 indicates that the patient is not expected to use health care services based on current diagnoses, and higher values indicate greater expected quantity and intensity of service use.
Stakeholder meeting
To supplement our analysis of hospital data from Montreal and Manhattan we held a one-day meeting on 11 March 2016, sponsored by the Québec Delegation General to New York, at which we discussed our findings with a group of experts from the two cities (https://wagner.nyu.edu/files/events/Montreal.NewYork.Program.03.08.pdf). The interpretation of our results presented in this paper draws on our conversations with this expert group. The workshop involved 19 participants. These included the authors, representatives from the government of Québec, several administrators and physicians from Integrated Health and Social Services Centres in Montreal, representatives from the New York City Mayor’s office, the New York City Department of Health and Mental Hygiene, Columbia University Medical Center, Mt. Sinai Hospital, and the New York City Health & Hospitals. In addition to learning about recent efforts expanding access to ambulatory care and integrating hospital-based and outpatient care, we presented our preliminary findings and engaged the participants in a discussion about interpreting them.
Findings
Variation of ACSC rates across neighbourhoods
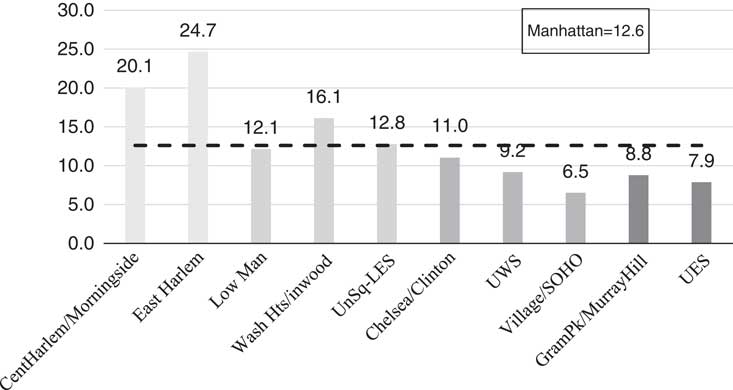
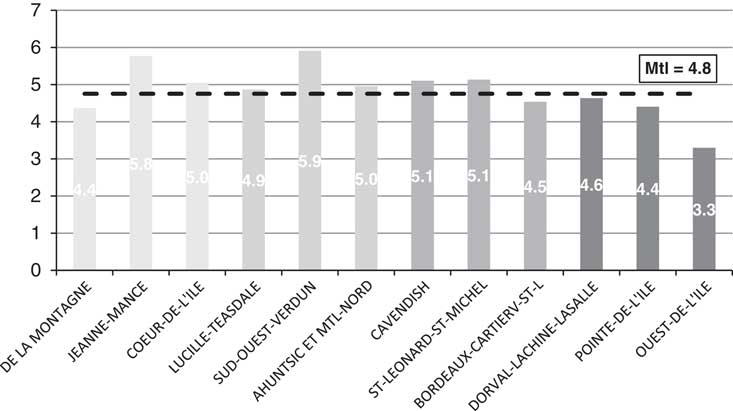
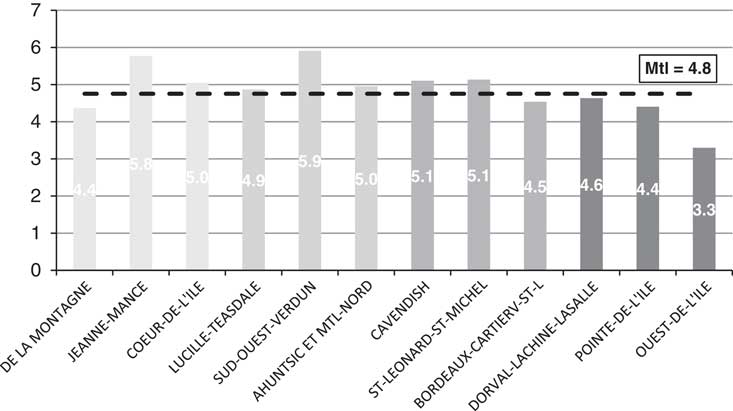
Differences in ACSC rates across neighbourhoods in New York and Montreal are presented in Figures 1 and 2. In New York, residents of the two neighbourhoods of the borough with the highest share of poor households (Central and East Harlem) had average ACSC rates over twice that of residents in the two neighbourhoods with the lowest share of poor households (20 and 25 vs 9 and 8 per 1000 during the 2011–2013 period; Figure 1). The most striking contrast, however, is the low level of variation across neighbourhoods in Montreal, compared to the large differences in New York. ACSC rates were 4.4 and 5.8 per 1000 in the poorest Montreal neighbourhoods (de la Montagne and Jeanne-Mance) and 4.4 and 3.3 per 1000 in the richest neighbourhoods (Pointe-de-l’Ile and Ouest-de-l’Ile). The highest rate (5.9) is in Sud-Ouest-Verdun, squarely in the middle of the distribution of neighbourhood poverty quartiles. In contrast to New York, there appears to be no correlation between neighbourhood-level poverty and ACSC rates in Montreal.
Age-adjusted annual ambulatory care sensitive conditions rates: Manhattan per 1000 inhabitants (2011–2013). Sources: Hospital discharge data for the period 2011–2013 are from the Statewide Planning and Research Cooperative System, which includes information for all residents of New York discharged from all non-Federal hospitals in New York State, excluding the population cared for in Veterans Administration hospitals. Household income and population data for New York are from the American Community Survey, 2011–2013. Note: Neighbourhoods are ordered from the highest to lowest poverty rates, that is, percentage of population below half median household income. LES=lower east side; UWS=upper west side; SOHO=south of Houston; UES=upper east side.

Age-adjusted annual average ambulatory care sensitive conditions rates: Montreal per 1000 inhabitants (2007/08–2009/10). Sources: Hospital data for the period (FY 2007/08–2009/10) are from the Régie de l’Assurance Maladie du Québec, the agency responsible for the administration of public health insurance coverage and paying physicians for the services they provide. Household income data at the neighbourhood and city levels are from Statistics Canada’s 2010 National Household Survey (Statistics Canada, 2011). Note: Neighbourhoods are ordered from the highest to lowest poverty rates, that is, percentage of population below half median household income.
Comparison of average ACSC rates
In New York, the average age-adjusted ACSC rate declined, between 1999–2001 and 2011–2013, from 20.0 per 1000 population to 10.8. Likewise, the ACSC rate declined in Montreal, from 6.7 per 1000 population in 2000/01–2002/03 to 4.8 in 2007/08–2009/10. The average age-adjusted ACSC rate in New York (12.6 per 1000 population) shown in Figure 1 is over 2.6 times as high as in Montreal (4.8) (Figure 2). When we compare the 65+ population, New York still has an age-adjusted ACSC rate (35.7 per 1000 population) that is nearly twice that of Montreal (19.5). Since most of New York’s population 65+ is insured under Medicare, this suggests that the differences in hospital discharges for ACSC cannot be explained only by insurance coverage.
Results of logistic regression analyses
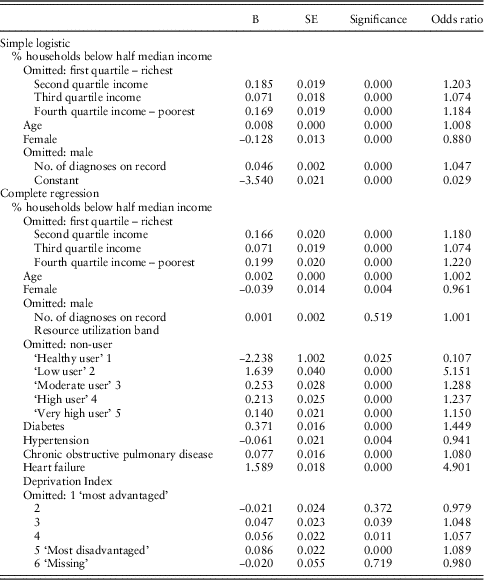
In the simple models with identical variables, controlling for age, gender and number of diagnoses on the record, we find, in both cities, a correlation between ACSC rates and the share of poor households in the neighbourhood. As suggested by the descriptive statistics, in New York, the odds of residents from the poorer neighbourhoods being hospitalized for an ACSC are much higher (7, 33 and 76%) than the odds for residents in the richest quartile, even after controlling for these factors (Table 1). In Montreal, controlling for age, sex and number of diagnoses, the odds of being hospitalized for an ACSC are 20, 7 and 18% higher among residents from the three poorer quartile neighbourhoods compared with the richest quartile (Table 2). In contrast to the unadjusted data in Figure 2, controlling for these variables yields important and statistically significant differences across neighbourhood poverty quartiles. Thus, it is clear that differences in ACSC rates across neighbourhood poverty quartiles exist in both cities, though they are much more pronounced in New York than in Montreal.
Regression results for characteristics associated with ACSC hospitalizations in Montreal, total population, 2007/08–2009/10

Sources: Hospital data for the period (FY 2007/08–2009/10) are from the Régie de l’Assurance Maladie du Québec, the agency responsible for the administration of public health insurance coverage and paying physicians for the services they provide. Household income data at the neighbourhood and city levels are from Statistics Canada’s 2010 National Household Survey (Statistics Canada, 2011).
The model for New York that includes a richer set of covariates indicates that other characteristics are important confounders of the gradient in ACSC rates across neighbourhoods. Residents of New York who are uninsured or on public insurance (Medicare or Medicaid) have higher odds of hospitalization with ACSC than those with private health insurance. The uninsured have 77% higher odds of hospitalization with ACSC, and those with Medicaid (25%) or Medicare (19%) higher odds than individuals with private insurance. Race/ethnicity is also an important confounder: Blacks and Hispanics have, respectively, 29 and 19% higher odds than Whites. In New York, insurance status is clearly correlated with both neighbourhood poverty quartiles and ACSC rates. After controlling for these additional factors, the magnitude of the neighbourhood poverty gradient is quite reduced compared with our simple model (Table 1). Residents of New York’s poorest quartile of neighbourhoods are 33% more likely to be hospitalized with an ACSC than those living in the richest quartile of neighbourhoods, down from 77% higher odds without controlling race, insurance coverage, education and language.
In Montreal, the model with the richer set of covariates yields similar results to the simple model (Table 2). Patients with higher predicted health care use [higher resource utilization band (RUB) categories due to more severe/complex diagnoses and higher use of health care services in the past] have higher odds of hospitalization with ACSC. This is particularly so for the ‘low user’ category of patients who are likely to have weaker ties to primary and other sources of outpatient care than their even sicker counterparts. Patients with diagnosed chronic conditions, particularly heart failure, are more likely to be hospitalized with an ACSC. The Deprivation Index which measures economic conditions at the sub-neighbourhood-level predicts ACSC rates, and the differences across neighbourhood quartiles remain similar to the simple model: the odds of being hospitalized for an ACSC are 7–22% higher among residents from the poorer neighbourhood quartiles of Montreal compared with the richest quartile.
In both New York and Montreal, men have higher odds of ACSC hospitalizations, consistent with empirical evidence that women tend to use more ambulatory services. Likewise, older adults, and those with more diagnosed conditions, also have higher odds of ACSC hospitalizations, perhaps reflecting the link between poor access, quality and continuity of care. Controlling for additional factors reduces the differences in ACSC rates across neighbourhoods in New York, but has less of an effect on these gaps in Montreal. In Montreal, those with diagnosed chronic conditions and with higher predicted health care use (higher RUB) have higher odds of ACSC hospitalization, although these factors do not appear to be correlated with neighbourhood poverty quartiles.
Discussion
New York’s gradient in ACSC rates across neighbourhoods, by neighbourhood poverty quartile, comes as no surprise given the obstacles posed by financial barriers in the United States compared to Canada, noted at the outset of this paper. Race and ethnicity continue to be important factors explaining differences in ACSC in New York (Gusmano et al., Reference Gusmano, Rodwin and Weisz2010), but it is important to acknowledge the limitations of simple US Census categories of race and ethnicity used in our analysis (David and Collins, Reference David and Collins1997). It is likely that these categories mask important differences within groups. Why are racial and ethnic minorities more likely to be hospitalized for ACSC even after controlling for insurance status, income of neighbourhood and the other factors for which we control? We cannot explore this directly with our data, but there is a large body of literature on institutionalized racism in the United States that provides evidence that members of racial and ethnic minority groups in the United States are more likely to experience poor health status and more likely to experience discrimination in health care settings (Krieger, Reference Krieger1990; Paradies, Reference Paradies2006; Bailey et al., Reference Bailey, Arieger, Agénor, Graves, Linos and Bassett2017).
More surprising, perhaps, at least to proponents of NHI, is our finding that the odds of being hospitalized for an ACSC are 7–22% higher among residents from the poorer neighbourhood quartiles of Montreal compared with those from lowest neighbourhood poverty quartile. Notably, individuals with heart failure and those in the lower predicted health care use category (lower RUB) each have odds of ACSC hospitalization five times as high as their healthier counterparts. This result for ‘low users’ may reflect unmet needs among relatively healthy adults who are less likely to have a family physician than sicker patients. Indeed, while insurance coverage is universal in Canada, 37% of Montrealers report not having a family physician, and 20% report unmet health needs related to this situation (Dubé-Linteau et al., Reference Dubé-Linteau, Pineault, Levesque, Lecours and Tremblay2013).
In contrast to Montreal, as of 2014 only 16% of New Yorkers reported not having one person, or more than one person, that they consider their personal physician or primary care provider (NYC Community Health Survey, 2014). Since 2002, primary care reforms in Québec prioritized access and care coordination for elderly and chronically ill patients. As a result, in the context of a GP shortage, particularly in Montreal, healthier patients are less likely to have a regular source of primary care relative to sicker and older patients. Since the RUB reflects patient morbidity, healthier patients with low to moderate morbidity are classified in the ‘non-user’, ‘healthy user’ and ‘low user’ categories. However, patients in the ‘low user’ category may have some health problems (e.g. controlled diabetes or hypertension). Primary care access and quality may be important for this subset of patients, but since they were not given a high priority in recent reforms, the high odds of ACSC hospitalization for these patients may reflect poor care coordination and access.
In a previous comparison of ACSC rates among Canadian and US cities, Billings et al. found comparable rates among Ontario cities (Toronto, Ottawa and Hamilton) and their urban counterparts across the US border (Seattle, Portland, Rochester), but New York City had much higher rates. Our calculation that the average age-adjusted ACSC rate in New York (12.6 per 1000 population) is over 2.6 times as high as in Montreal (4.8) is consistent with this latter finding. What calls for further research is an explanation for Montreal’s surprisingly low ACSC rate. It is significantly lower than those documented in other world cities (Gusmano et al., Reference Gusmano, Rodwin and Weisz2009) and surprising in light of survey findings (among the general population, older adults, as well as the chronically ill) that Québec lags behind the rest of Canada with respect to patients having a medical home. Not only does Québec lag behind the rest of Canada along this indicator, but also with respect to their population’s ability to obtain an appointment with a primary care provider.
Hypotheses for further research
Our findings on average age-adjusted ACSC hospitalizations in New York and Montreal are consistent with the hypothesis that universal, first-dollar health insurance coverage has contributed to lower ACSC rates in Montreal than in New York. However, the fact that ACSC rates remain about twice as high in New York, compared to Montreal, for the population 65+, suggests that these differences cannot be explained by insurance alone. While Québec’s health insurance coverage is more generous with respect to primary care because it does not impose the deductibles and co-insurance under Medicare, it appears that more extensive health insurance coverage in Montreal cannot fully explain the gap in hospitalization rates for ACSC. We therefore turn to other hypotheses about factors that may explain this puzzle.
First, higher rates of ACSC hospitalizations among New York’s Medicare population could reflect the cumulative disadvantage of living one’s first 65 years without the level of first-dollar health insurance coverage offered in Montreal. This hypothesis is consistent with evidence indicating that Québec’s population is, on average, healthier than their counterparts in New York, but we do not have comprehensive health profiles that allow for comparison of population health in New York and Montreal. Additional corroborating evidence supporting the hypothesis that Canadian population health indicators exceed those of the United States might point to the impacts of Canada’s redistributive tax policies (Brandolini and Smeeding, Reference Brandolini and Smeeding2007) as important determinants of health status. Although the difference between Canada and the United States has narrowed in recent years, economic inequality is significantly greater in the United States (Wolff et al., Reference Wolff, Zacharias, Masterson, Eren, Sharpe and Hazell2012). Among New York neighbourhoods, median household income varies 10-fold; in Montreal, only six-fold. Moreover, to compensate for income inequalities, another factor that should not be overlooked is the relative spending on social services and income maintenance programmes.
Although we have no data at the city level, Bradley et al. have demonstrated that Canada spends a higher proportion of total health and social services expenditures on social services (56%) compared with the United States (45%) (Bradley et al., Reference Bradley, Elkins, Herrin and Elbel2011). In their study of mortality rates among Canada and the United States, Kunitz and Pesis‐Katz (Reference Kunitz and Pesis‐Katz2005) note the difficulty of disentangling the effects of income inequality and access to health services. We would add that lower levels of expenditure on social services, as a per cent of GDP, along with less income redistribution in the United States, all reinforced by a history of residential racial segregation in New York, probably exacerbate differences in access to health care, contributing to New York’s higher ACSC rates.
The problem with the hypothesis of better population health in Canada, Québec and Montreal, in comparison to the United States and New York, is that Canada is not alone in this respect. Most wealthier nations belonging to the Organization for Economic Cooperation and Development (OECD) surpass the United States with respect to measures of population health status. Moreover, studies of ACSC hospitalizations in Paris (Gusmano et al., Reference Gusmano, Rodwin and Weisz2006) and Hong Kong where population health exceeds that of Montreal, have far higher ACSC rates than Montreal, although still lower than New York. For this reason, like the insurance coverage hypothesis, the better population health hypothesis appears inadequate to explain the two-fold difference in average age-adjusted ACSC rates between New York and Montreal. Whatever the relative strengths of each hypothesis, our findings point to the importance of social and institutional context in interpreting the performance of health systems across nations and cities.
Social and institutional context
A striking and often unrecognized characteristic of the Canadian health care system, clearly apparent in Montreal, is that there are far fewer acute hospital beds per capita – twice as many in New York as in Montreal. In addition, there is a lower density of physicians, in Montreal, compared to New York (Table 1). Many studies have noted the long waits for elective hospital services in Québec, as well as in Montreal (Barua and Ren, Reference Barua and Ren2016; Canadian Institute for Health Information, 2017; Hajizadeh, Reference Hajizadeh2017; Hwang et al., Reference Hwang, Guilcher, McIsaac, Matheson, Glazier and O’Campo2017; Sheehan et al., Reference Sheehan, Filliter, Sobolev, Levy, Guy, Kuramoto, Kim, Dunbar, Morin, Sutherland, Jaglal, Harvey, Beaupre and Chudyk2017). Although Québec has a higher density of GPs than the rest of Canada, one response to the problem of waiting times for hospital-based services has been to introduce a system – Activités Médicales Particuliers – that requires physicians to allocate a portion of their time to hospital activities. In this context, it seems understandable that many patients complain of difficulties in registering for primary care services. Also, it seems possible that some patients admitted for an inpatient stay in New York, would be treated, of necessity, on an outpatient basis in Montreal. Alternatively, many more patients in Montreal may be treated by emergency departments without being admitted for inpatient stays, even for ACSCs requiring acute interventions. The administrative data we have analyzed do not enable us to shed light on these hypotheses. To investigate them further would require clinical data. However, differences in hospital bed capacity cannot explain why there are greater geographic disparities in ACSC rates in New York than in Montreal.
Yet another hypothesis is that reductions in the ACSC rate depend not only on extending insurance but on addressing underlying social factors that lead to poor health, poor health behaviours and different health-seeking behaviours. Although we found that the ACSC rate in New York fell by about half, between 2000 and 2013, the differences by insurance status, race, ethnicity and neighbourhood have not changed over this period (Gusmano et al., Reference Gusmano, Rodwin and Weisz2017). As Bradley et al. (Reference Bradley, Elkins, Herrin and Elbel2011) argue, the United States has not invested sufficiently in social programmes that address the broader social and economic determinants of health.
For Montreal, New York offers a cautionary tale about the problems that could result from policies that lead to social and economic inequalities or undermine the protection offered by Québec’s health insurance system. For New York, on the other hand, Montreal offers an equally cautionary tale about the problems that could result from policies that lead to reductions in hospital bed capacity and primary care availability. More importantly, our findings highlight the importance of social and institutional context for interpreting indicators that may be valid within specific nations but prove highly inadequate for purposes of comparative analysis of health systems.
Acknowledgements
The authors thank Annie Le and her colleagues at the Québec Government Office in New York for assistance in funding the meeting from which this paper was born. The authors also thank Roman Zamishka for his research assistance and all of the invited officials and/or experts from Québec and New York: Frederic Abergel, Sonia Angell, Nancy Berlinger, Lawrence Brown, Pierre Gerlier Forest, Antoine Groulx, Jill Huck, Ronda Kotelchuk, Steven Newmark, Raynalt Pineault, Denis Roy, Sam Solomon, Rishi Hood.