I. INTRODUCTION
Dental casting gold alloys for crown, bridge and removable partial denture, require high physical and mechanical properties to withstand the considerable occlusive forces. Such properties can be obtained by proper heat treatment accompanied by a phase transformation.Reference Labarge, Tréheux and Guiraldeng1, Reference Wataha and Messer2 The product phases formed by a phase transformation through heat treatment have different lattice parameters. The gap in the lattice parameter determines whether the interphase interfaces will be coherent, semicoherent or incoherent. Incoherency strain, which forms in an incoherent interface between the matrix and the precipitates, has a strong hardening effect, but also increases brittleness, lowering ductility.Reference Lu, Lu and Suresh3 Recent studies have shown that the introduction of coherent phase boundaries has a substantial strengthening effect while maintaining acceptable levels of ductility.Reference Lu, Shen, Chen, Qian and Lu4 The formation of coherent or semicoherent interfaces becomes possible in dental casting gold alloys by forming metastable phases with a minor gap in the lattice parameter.Reference Lee, Yi, Seol, Kwon, Lee and Kim5
Dental casting gold alloys contain various elements to achieve the required mechanical properties. Therefore, the alloy composition can become different from equiatomic gold (Au)-(copper) Cu, which can form the AuCu I ordered phase, the traditional age-hardening mechanism. Consequently, the age-hardening mechanism of dental casting gold alloys manifests in several forms such as ordering,Reference Hamasaki, Hisatsune, Udoh, Tanaka, Iijima, Takagi and Naruse6–Reference Tanaka, Udoh, Hisatsune and Yasuda9 precipitation,Reference Yasuda and Ohta10, Reference Prasad, Eng and Mukherjee11 spinodal decompositionReference Hamasaki, Hisatsune, Udoh, Tanaka, Iijima, Takagi and Naruse6, Reference Nakagawa and Yasuda8, Reference Hero, Jorgensen and Sorbroden12 and a combination of spinodal decomposition and ordering.Reference Nakagawa and Yasuda8 Therefore, in dental casting gold alloys with a complex composition, it is difficult to predict the process of phase transformation and whether a metastable phase forms during the process, and the relation of a metastable phase with a strengthening effect has not yet been clarified. In the present study, hardness changes by formation of the metastable and stable phases were examined and correlated with microstructural changes in grain interior and grain boundary during aging process to clarify the age-hardening and softening mechanism of a dental low-gold Au-Cu-Ag-Pd alloy.
II. EXPERIMENTAL
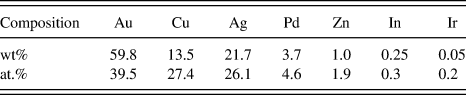
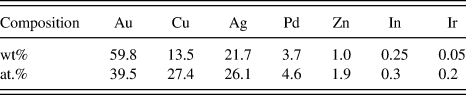
The alloy used in the present study was for a single unit to short- and long-span dental bridges including cast partials and implant overstructure (Aurium D16, Aurium Research Corp., San Diego, CA), and belongs to type III and IV according to the ISO classification [ISO 22674:2006(E)]. The alloy has a melting range of 870–925 °C and a density of 14.0 g/cm3. Table I lists the chemical composition of the specimen. The initial shape of the specimen was plate-like with dimensions of 8 × 9 × 1 mm, and was procured in a rolled and annealed state.
Chemical composition of the specimen alloy.
The plate-like specimens were solution-treated at 650 °C for 15 min under an argon atmosphere, and then quenched rapidly into ice brine to prevent the formation of an equilibrium structure. Subsequently, the specimens were aged isochronally at temperatures ranging from 200 to 500 °C. The specimens were then aged isothermally at 350 °C for various periods in a molten salt bath [25% potassium nitrate (KNO3) + 30% potassium nitrite (KNO2) + 25% sodium nitrate (NaNO3) + 20% sodium nitrite (NaNO2)], which was used for temperature ranges from 150 to 550 °C, and then quenched into ice brine for the hardness test. Hardness measurements were made using a Vickers micro-hardness tester (MVK-H1, Akashi Co., Osaka, Japan) with a load of 300 gf and a dwell time of 10 s. Vickers hardness results were obtained as an average of five measurements.
For the x-ray diffraction (XRD) study, the powder specimens were obtained by filing the plate-like specimens with a diamond disc. They were then passed through a 300-mesh screen to obtain powder specimens with a size smaller than 45 µm. After being vacuum-sealed in a silica tube and solution-treated at 650 °C for 15 min, they were aged isothermally at 350 °C for various times in a molten salt bath, and then quenched into ice brine. The XRD profiles were recorded by an x-ray diffractometer (XRD; X’Pert-MPD, PANalytical, Almelo, The Netherlands). The x-ray diffractometer was operated at 30 kV and 40 mA using Ni-filtered Cu Kα radiation as the incident beam.
For the field-emission scanning electron microscopic (FESEM) observations, the plate-like specimens were subjected to the required heat treatment, and prepared using a standard metallographic technique. A freshly prepared aqueous solution of 10% potassium cyanide (KCN) and 10% ammonium persulfate [(NH4)2S2O8] was used for final etching of the specimens. The specimens were examined at 15 kV using field-emission scanning electron microscopy (FESEM; model No. JSM-6700F, JEOL, Tokyo, Japan).
For energy-dispersive spectrometry (EDS) analysis attached to field-emission transmission electron microscopy (FETEM), the sheet specimens, 0.1 mm in thickness, were prepared by cold rolling plate-like specimens followed by punching to earn discs, 3 mm in diameter. After sealing in an evacuated silica capsule, they were solution-treated at 650 °C for 15 min and aged at 350 °C for the appropriate periods. The samples were thinned electrolytically using a double jet technique in a solution of 125 mL phosphoric acid (H3PO4), 12 mL ethyl alcohol (C2H5OH), 25 mL propyl alcohol (CH3CH2CH2OH), 2.5 g urea [CO(NH2)2] and 250 mL distilled water to obtain thin foil specimens. A field-emission transmission electron microscope (FETEM; model No. JEM-2100Fe, JEOL, Tokyo, Japan) installed at Pukyoung National University was operated at an accelerating voltage of 200 kV and energy-dispersive spectroscope (EDS; INCA x-sight, Oxford Instruments Ltd., Abingdon, UK) attached to FE-TEM (JEM-2100Fe) was used at 15 kV to examine the plate-like specimens.
III. RESULTS AND DISCUSSION
A. Age-hardening behavior
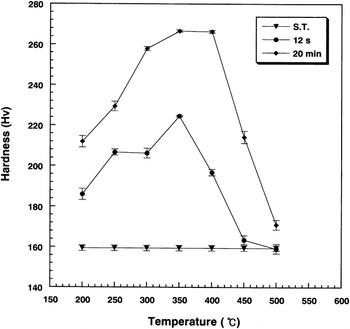
Figure 1 shows the isochronal age-hardening curves of the specimens solution-treated at 650 °C for 15 min and then aged at temperatures ranging from 200 to 500 °C for 12 s and 20 min. The specimen exhibited an age-hardenability at all temperatures tested. The maximum age-hardenability was achieved at 350 °C. Therefore, subsequent age-hardening experiments were performed at 350 °C.
Isochronal age-hardening curves of the specimen aged in temperature range of 200–500 °C for 12 s and 20 min.

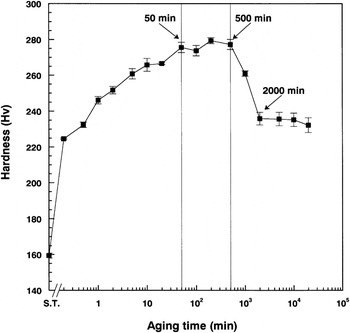
Figure 2 shows an isothermal age-hardening curve of the specimen aged isothermally at 350 °C. The hardness increased rapidly within 12 s, and then continued to rise gradually to the maximum value until 50 min. Subsequently, the hardness remained relatively constant until 500 min. The average hardness value from 50 to 500 min was 276 (Hv). After that, an apparent decrease in hardness was observed until 2000 min, followed by constant hardness, 235 (Hv).
Isothermal age-hardening curve of the specimen aged at 350 °C.

B. Phase transformation
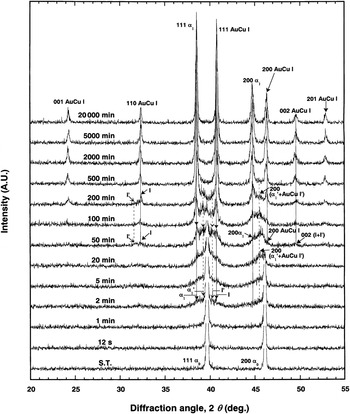
A phase transformation during the aging process was the causal factor behind the hardness changes as shown by XRD. Figure 3 shows changes in the XRD patterns during isothermal aging at 350 °C at different aging time points. Here, prime (′) refers to a metastable state, and the notations (I) and (I′) indicate stable AuCu I and metastable AuCu I′ phases, respectively. In the solution-treated (ST) specimen, a single α0 phase was observed, which was a face-centered cubic (fcc) structure with a lattice parameter of a 111 = 3.934 Å. By aging the ST specimen at 350 °C for 20,000 min, the α0 phase separated into two phases, the fcc phase with a lattice parameter of a 200 = 4.051 Å and the face-centered tetragonal (fct) phase with a lattice parameter of a 200 = 3.921 Å, with an axial ratio, (c/a) of 0.94. The product fcc and the fct phases were assumed to be the Ag-rich α1 and the AuCu I phases, respectively, from the alloy composition and the lattice parameter. The lattice parameters of the AuCu I phase detected in the present study were slightly different from the reported value (a = 3.966 Å, c/a = 0.926),Reference Villars and Calvert13 due to the presence of other elements in small quantities, as will be described in the element distribution part.
Variations of the XRD patterns as a function of isothermal aging time at 350 °C.

For understanding the relationship between age-hardening behavior and phase transformation, the changes in the XRD pattern (Fig. 3) were compared with the isothermal age-hardening curve at 350 °C (Fig. 2). The hardness increased drastically in the initial stage of the aging process in Fig. 2. The XRD pattern of the specimens aged for 12 s and 1 min was similar to that of the ST specimen. Krawitz and SinclairReference Krawitz and Sinclair14 reported that during preprecipitation, the solute atoms still diffracted with solvent atoms, and thus the fundamental XRD peaks were identical to those of the supersaturated solid solution. Accordingly, the present results suggest that preprecipitation or zone formation is responsible for the rapid hardening at the initial stage of the aging process, actively assisted by the quenched-in excess vacancies.Reference Han and Lee15
After aging for 2 min, the intensity of the (111) diffraction peak of the parent α0 phase decreased with the concomitant appearance of the (111) peaks of the metastable α1′ and stable α1 phases at lower diffraction angles; (2θ = 39.2°) and (2θ = 38.5°) respectively, as marked by the arrows. In addition, the (111) peaks of the metastable AuCu I′ and stable AuCu I phases were observed at higher diffraction angles; (2θ = 40.2°) and (2θ = 40.8°), respectively. At the aging time of 20 min, the (111) peak of the metastable (α1′, AuCu I′) and stable (α1, AuCu I) phases were clear without any change in the peak position. The (200) peak of the metastable AuCu I′ phase was not observed, which means an overlapping of the (200) AuCu I′ peak with the (200) α1′ peak, as marked by the arrow. Therefore, it was thought that the metastable phases of α1′ and AuCu I′ are coherent with each other at the (200) plane.Reference Lee, Yi, Seol, Kwon, Lee and Kim5
At the aging time of 50 min when the maximum hardness value was obtained, the (111) α0 peak still had the strongest intensity, and the (111) peak intensity of the stable α1 and AuCu I phases became similar to that of the metastable α1′ and AuCu I′ phases. The (110) peak of the metastable and stable AuCu I phase appeared, as marked by the arrow. The (110) peak position suggested that the (a) value of the metastable AuCu I′ phase was larger than that of the stable AuCu I phase. The (200) peak of the stable α1 and AuCu I phases became clear at both sides of the overlapped (200) (α1′ + AuCu I′) peak, as marked by the arrows. In addition, the (002) peak of the stable AuCu I phase began to be observable at the higher diffraction angle than the (200) peak. The (c) values of the metastable AuCu I′ and stable AuCu I phases, which were calculated from the (110) and (111) peaks, were almost equal. Hence, the (002) peak of the stable AuCu I phase is believed to overlap that of the metastable AuCu I′ phase, as marked by (002) (I + I′) at 50 min. Therefore, the transformation of the metastable AuCu I′ phase to the stable AuCu I phase produced a difference in the (a) value, unlike the (c) value. In addition, the α0 and AuCu I phases are believed to be coherent or semicoherent at the (200) plane because the (200) peak positions of the α0 and AuCu I phases were very close. From the above, a constant increase in hardness after preprecipitation or zone formation was related to the formation of metastable and then stable phases of fcc and fct structure in the fcc α0 matrix.At the aging time of 100 min, when the maximum hardness was maintained, the (111) peak intensity of the stable α1 and AuCu I phases became stronger than that of the parent α0 and metastable α1′ and AuCu I′ phases. At the aging time of 200 min, the common (200) (α1′ + AuCu I′) peak still remained, as marked by the arrow, which indicates that coherent or semicoherent strain still exists in the (200) plane of the α1′ and AuCu I′ phases. At an aging time of 500 min, when the maximum hardness was still maintained, the phase transformation was almost completed. Thereafter, until the aging time of 2000 min when the hardness decreased apparently, the diffraction peak became sharp and symmetrical without changes in the peak position, and then until 20,000 min, no further changes in the XRD pattern were observed. The sharpening of the diffraction peaks after the phase transformation indicates the release of lattice strain in the specimen, as indicated from the decrease in hardness in the later stage of the aging process.Reference Tanaka, Udoh, Hisatsune and Yasuda9, Reference Suryanarayana and Norton16, Reference Kawashima, Ohno and Sarkar17 Therefore, it was thought that the apparent decrease in hardness resulted from microstructural changes related to the release of lattice strain not accompanied by a phase transformation.
C. Changes in the lattice parameters
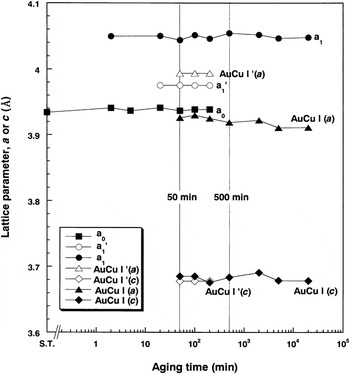
Figure 4 shows the changes of the lattice parameter with aging time. The lattice parameters (a) and (c) were measured from the diffraction peaks of α0 [(a) from (111)], α1 [(a) from (111)], α1′ [(a) from (111)], AuCu I [(a) from (110), (c) from (002)] and AuCu I′ [(a) from (110), (c) from (110 + 111)]. The (a) value of the final product AuCu I phase had little difference with that of the parent α0 phase. The (a) values of the α1′ and AuCu I′ phases, which have been observed since the initial aging stage, were very similar at a medium value between that of the final α1 and (AuCu I, parent α0) phases. For the (c) value of the AuCu I phase, the stable and metastable phases had an almost equal value, which was much smaller than the (a) value. At the aging time of 50 min, when the maximum hardness was obtained, the gap in the (a) value (0.118 Å) between the stable phases of α1 and AuCu I was three times higher than the gap (0.046 Å) between the metastable phases of α1′ and AuCu I′. This gap was increased to 0.137 Å by further aging to 500 min. Considering the lattice parameter of each phase, the formation of the metastable phases minimized the lattice distortion along the a-axis in the matrix, producing coherency or semicoherency strain. From the above, the constant increase in hardness was attributed primarily to the lattice strain caused by the tetragonality of the AuCu I′ and AuCu I phases along the c-axis, secondarily to the coherency or semicoherency strain between the metastable α1′ and AuCu I′ phases and between the α0 and AuCu I phases along the a-axis.
Variations of the lattice parameter of each phase with aging time in the specimen aged at 350 °C.

D. Microstructural changes
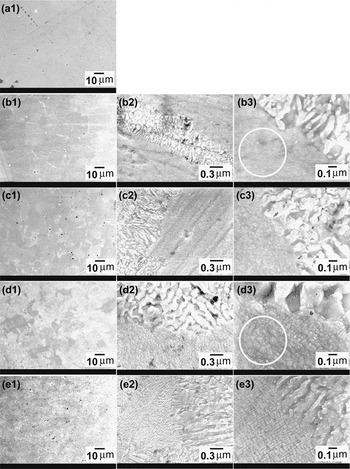
FESEM observations were performed to examine the microstructural changes occurring during the changes in hardness. Figure 5 shows FESEM micrographs at magnifications of 1000x (1), 30,000x (2) and 80,000x (3) of the specimens solution-treated at 650 °C for 15 min (a) and aged at 350 °C for 20 min (b), 200 min (c), 2000 min (d) and 20,000 min (e). In the ST specimen (a), the matrix composed of a single α0 phase was observed. By aging the specimen at 350 °C for 20 min (b), a lamellar structure was partly observed at the grain boundaries. The microstructural changes in the grain interior were unclear in the FESEM image. Considering that the stable phases of α1 and AuCu I were already observed at 2 min together with the metastable phases of α1′ and AuCu I′ in the XRD pattern, the phase decomposition is believed to have occurred through a metastable state in the grain interior, whereas the phase decomposition occurred without a metastable state, forming lamellar structure composed of stable phases in the grain boundaries, where atomic diffusion is relatively easy.Reference Jena and Chaturvedi18
FESEM micrographs of magnifications of 1000x (1), 30,000x (2) and 80,000x (3) for the specimens solution-treated at 650 °C for 15 min (a) And aged at 350 °C for 20 min (b), 200 min (c), 2000 min (d) and 20,000 min (e).

In the specimen aged for 200 min (c), when the maximum hardness value was maintained, the lamellar structure grew further toward the grain interior (c-1), and the precipitates in the grain interior were faintly observed (c-3). By further aging for 2000 min (d) when the hardness decreased apparently, the lamellar structure covered more than two thirds of the matrix (d-1), and the interlamellar space became wider (d-3). In the residual grain interior, a fine block-like structure surrounded by solute-depleted matrix was observed (d-3). In the corresponding XRD pattern, the parent α0 and metastable phases of α1′ and AuCu I′ almost disappeared. Therefore, it can be thought that not only the grain boundary lamellar structure, but also the block-like structure and surrounding matrix were composed of the stable phases of AuCu I and α1. By further aging for 20,000 min (e), when the hardness no longer decreased, the block-like structure in the grain interior became more distinct, and there was no further coarsening or growth of the lamellar structure. Therefore, it is clear that the growth of the lamellar structure from the grain boundary was related to the softening mechanism.Reference Cho, Kim, Kwon, Kim and Seol19 Considering that the lamellar structure composed of the stable α1 and AuCu I phases grew at the expense of the much finer grain interior structure composed of various phases, growth of the lamellar structure reduced apparently the interphase boundaries containing large amounts of lattice strains, resulting in softening.
E. Element distribution
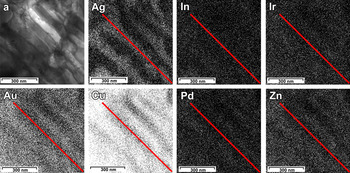
EDS analysis was performed to determine the element distribution in the lamellar structure. Figure 6 shows the coarse lamellar structure in the specimen aged at 350 °C for 2000 min (a) and the distribution of each component. The elements were divided into the two regions, Ag-rich and the Au-Cu-rich layers. The palladium (Pd) and zinc (Zn) were founded at higher levels in the Au-Cu-rich regions. The distribution of minor ingredients, iridium (Ir) and indium (In), were undetectable by EDS analysis. These results corresponded to the XRD result, which revealed the Ag-rich α1 and AuCu I phases in the specimen aged at 350 °C for 2000 min, and were related to the fact that Ag and Cu have solubility limit for each other.Reference Massalski20 The difference in the lattice parameters with the reported AuCu I phase was attributed to the Pd and Zn contents in the AuCu I phase of the present study.Reference Villars and Calvert13
FE-TEM micrograph for the lamellar structure of specimen aged at 350 °C for 2000 min (a) and the distribution of each component.

IV. CONCLUSIONS
The hardness changes by formation of the metastable and stable phases were examined and correlated with the microstructural changes in grain interior and grain boundary during aging at 350 °C to clarify the age-hardening and softening mechanism of a low-gold Au-Cu-Ag-Pd alloy. The main results were as follows.
(1) The matrix of the α0 single phase was separated into the Ag-rich α1 and AuCu I phases through the metastable α1′ and AuCu I′ phases in the grain interior, forming a fine block-like structure surrounded by solute-depleted matrix.
(2) In the grain boundary, the lamellar structure composed of the α1 and AuCu I phases grew, consuming the fine grain interior structure and became coarse without covering the entire matrix.
(3) The preprecipitation or zone formation is believed to be responsible for the rapid hardening at the initial stage of the aging process. Then, the constant increase in hardness was attributed primarily to the lattice strain caused by the tetragonality of the AuCu I′ and AuCu I phases along the c-axis, secondarily to the coherency or semicoherency strain between the metastable α1′ and AuCu I′ phases and between the α0 and AuCu I phases along the a-axis.
(4) The apparent decrease in hardness by overaging was caused primarily by the growth and coarsening of a lamellar structure in the grain boundaries, secondarily by the coarsening of the block-like structure and surrounding matrix in the grain interior.
ACKNOWLEDGMENT
This research was supported by Basic Science Research Program through the National Research Foundation of Korea (NRF) funded by the Ministry of Education, Science and Technology (Grant No. 2011–0010995).