




No CrossRef data available.
Article contents
Evidence for the hypothesis of strain formation in Pomphorhynchus laevis (Acanthocephala): an investigation using mitochondrial DNA sequences
Published online by Cambridge University Press: 23 August 2004
Abstract
A hypothesis has been erected stating that in the British Isles the acanthocephalan, Pomphorhynchus laevis can be separated into 3 strains, an English, Irish and marine strain. Ecological and morphological evidence exists in support of this hypothesis. An investigation at the molecular level was conducted in order to test the validity of the existing evidence. A mitochondrial gene, subunit I of cytochrome c oxidase was partially sequenced from 3 Irish populations of P. laevis, 1 Scottish population and 3 English populations. P. laevis sequences from brown trout from Ireland, England and Scotland were very similar, showing a mean sequence divergence of 0·7%. Sequences from two populations of P. laevis from English chub and bullhead were also similar to each other (0·35% divergence). These two groups of sequences, the brown trout group and the chub/bullhead group were 2·2% different. These data confirm the existence of at least 2 strains in Ireland and Britain, although there is evidence to suggest that these strains are defined by their host species rather than by their geographical distributions.
Information
- Type
- Research Article
- Information
- Copyright
- © 2004 Cambridge University Press
INTRODUCTION
Pomphorhynchus laevis is an intestinal acanthocephalan parasite of palaearctic freshwater fish. Kennedy, Bates & Brown (1989) suggested that in the British Isles 3 strains of P. laevis could be recognized, 2 freshwater and 1 marine. The three strains use different definitive and intermediate hosts, have different site preferences within fish and exhibit clear and almost exclusive geographical distributions. The cyprinids Barbus barbus (barbel) and Leuciscus cephalus (chub) are the preferred definitive hosts of the English strain, whereas the Irish strain is found mostly in salmonids, especially Salmo trutta (brown trout). The marine strain is found in the flatfish Platichthys flesus (flounder) (Kennedy, 1984). Each strain uses the locally abundant species of Gammarus as its intermediate host. The three strains locate in different areas of the gut. The English strain is located anteriorly (Kennedy, Broughton & Hine, 1976); the Irish strain is located more posteriorly (Fitzgerald & Mulcahy, 1983; Molloy, Holland & O'Regan, 1995), while the marine strain is restricted to the rectum (Kennedy, 1984; Munro, Whitfield & Diffley, 1989). Within the broad range of P. laevis in the palaearctic, the three strains have relatively narrow and exclusive distributions. The marine strain is located in the Baltic Sea, the English Channel, the North Sea estuaries in Eastern Scotland and the Thames (Kennedy, 1984; Munro et al. 1989). The Irish strain is found in rivers and lakes in southern Ireland and has recently been recorded in Northern Ireland (Holland & Kennedy, 1997; Evans, Matthews & McClintock, 2001). The distribution of the English strain is much more localized than that of the Irish strain and is mostly limited to rivers in the south of England (Hine & Kennedy, 1974a). Differences found in the growth and reproductive cycles of Irish P. laevis have distinguished it further from the other strains. In Ireland, P. laevis tends to grow and reproduce only in the summer months in contrast to the continuous cycles of growth and reproduction of the other strains throughout the year (Hine & Kennedy, 1974a; Brown, 1989; Molloy et al. 1995).
Despite such clear ecological differences, attempts at separating the marine and freshwater strains using morphological characters have proved unsatisfactory due to conservation of characters and a large degree of individual variability (Gibson, 1972; Brown, 1987), even though a preliminary study (C. R. Kennedy, unpublished observations) did suggest that the Irish and English strains might be distinguishable by morphological characters. This difficulty in separating the strains morphologically has led to uncertainty about their exact taxonomic status (Kennedy et al. 1989) and prompted the use of other approaches. The first attempt to distinguish strains at the molecular level was carried out by Munro, Reid & Whitfield (1990) who focussed on the English and marine strains. A large degree of homogeneity was found between the two samples when their genomes were exposed to restriction endonucleases. Subsequent hybridization of these digests, with a probe consisting of various ribosomal DNA repeat sequences from Caenorhabditis elegans, did show some differences in the pattern of hybridization between the two strains.
In light of these studies, it was decided to test the strain hypothesis by comparing the English and Irish freshwater strains of P. laevis using a holistic approach. The ecology, morphology and phylogeography of P. laevis in Ireland and England were studied simultaneously. The morphological work has revealed two characters, the position of the stoutest hook and the ratio of anterior to posterior hooks, capable of separating Irish and English freshwater populations of P. laevis (O'Mahony, Kennedy & Holland, 2004). The molecular study used direct sequencing of subunit I of cytochrome c oxidase, a mitochondrial gene, to study freshwater populations of P. laevis in Ireland and Britain. It is these results that are presented in this paper. The questions that were explicitly asked were, does this species exhibit substructure at the molecular level in accordance with that seen at the ecological level? If so, are the Irish and English strains of P. laevis different species?
MATERIALS AND METHODS
Sample collection
Seven different populations of P. laevis in Ireland and Britain were sampled. Table 1 lists the number of worms sequenced from each population, their location, the host from which they were removed and the haplotypes1
A representative sequence for each haplotype has been deposited in GenBank under the accession numbers AY390502–AY390512, AY390514.

Extraction of total genomic DNA
Total genomic DNA was extracted separately from each worm using a standard phenol/chloroform procedure, following digestion of the tissue with 250 μl of digestion buffer (0·1 M NaCl; 0·01 M Tris–HCl, pH 8·0; 0·02 M EDTA, pH 8·0; 1% SDS; 0·095 mg/ml proteinase K). The extraction involved 1 addition of 1 vol. of phenol and 2 additions of 1 vol. of phenol[ratio ]choloroform[ratio ]isoamyl alcohol (24[ratio ]24[ratio ]1). DNA was recovered by overnight precipitation in 2 vols of cold absolute alcohol and 0·3 M sodium acetate and centrifugation at 16250 g for 3 min. The pellet was then washed with 200 μl of 75% ethanol and left to dry in air for approximately 30 min. After drying, the pellet was resuspended in 100 μl of TE buffer.
Amplification of cytochrome c oxidase, subunit I
The primers used to amplify COI in P. laevis were taken from published data on the mitochondrial DNA of Fasciola hepatica (Garey & Wolstenholme, 1989). The following forward and reverse primers were used initially: COI p1 (for): TTTTTTGGGCATCCTGAGGTTTAT; COI p2 (rev): TAAAGAAAGAACATAATGAAAATG. New primers were designed, as some samples did not amplify successfully using the pair of primers above: COI p4 (for): GGGCATCCTGAGGTTTATATTCTC; COI p3 (rev): TGTCATGAAATACCGTATCCAAGC. COI sequences from Irish P. laevis from L. Feeagh and the R. Lee were amplified using the primers COI p1 and COI p2. COI sequences from the remaining samples were amplified with the same forward primer and COI p3 as the reverse primer. The 50 μl PCR reaction mixture consisted of 1× PCR buffer (10× buffer contains 200 mM Tris–HCl (pH 8·4) and 500 mM KCl); either 1·5 or 2·0 mM MgCl2; 200 μM dNTP's; 0·5 μM forward and reverse primers and 2·5 units of platinum Taq polymerase, and 12·5 μl of template DNA was added to the reaction mixture. The target sequence was amplified in a programmable thermal cycler using the following profile: an initial denaturation at 94 °C for 4 min, 30 cycles of denaturation at 94 °C for 40 sec, annealing at 50 °C for 40 sec and extension at 72 °C for 1 min. A final extension phase at 72 °C lasted for 10 min. Adjustments to this profile were made in order to increase the yield from some of the samples. The amplification products were cleaned with a Gibco BRL Concert Rapid PCR Purification System.
Direct sequencing of COI
The Liquid Cool sequencing method was used to sequence the PCR product. A vol. of 7 μl of annealing reaction mixture (2 μl of primer; 2 μl of 5× sequenase buffer; 1 μl of 50% dimethyl sulphoxide (Me2SO); 2 μl of double distilled H2O) was added to 4 μl of purified PCR product. This mixture was denatured at 93 °C for 3 min and immediately after was dropped in liquid nitrogen, where it was kept for up to 30 min. Then 5 μl of labelling reaction mixture (1·5 μl of 100 mM DTT; 0·5 μl of 50% Me2SO; 0·4 μl labelling mix; 0·5 μl of 35S-labelled dATP; 0·25 μl of T7 Sequenase enzyme; 0·2 μl of Mn buffer) was added quickly to the previous mixture and incubated at room temperature for 2 min. Finally, 3·5 μl of labelled template was added to 4 wells each containing 1 of the 4 termination mixes (ddGTP, ddATP, ddTTP or ddCTP). The sequencing reaction was stopped after 5 min by addition of 4 μl of formamide. Sequences were separated on a 6% polyacrylamide gel. Electrophoresis at 70 W for 2·25 h allowed bases near the 5′ end of the sequence to be visualized. Bases near the 3′ end required electrophoresis for 6 h. The gel was adhered to filter paper and dried at 80 °C for 50 min. An autoradiograph was then exposed to the gel for a varying time-period, depending on the strength of the isotope.
Data analysis
Multiple alignments were carried out in ClustalX. Median networks were constructed as described by Bandelt et al. (1995). A circle, the area of which is proportional to the number of individuals sharing that haplotype, represents each haplotype. One substitution between haplotypes is designated by a single line, which is delineated by a black dot at both ends.
Analysis of Molecular Variance (AMOVA) was calculated using ARLEQUIN ver 2.000 (Schneider, Roessli & Excoffier, 2000). This programme allows one to test the existence of population substructure according to user defined hypotheses. If P is significant, then most of the variation in the sample is between groups rather within them.
RESULTS
General observations
The average GC content for this part of the gene from worms from Ireland and Britain was 43·4% (calculated from just the aligned part of the sequence). Out of 13 variable sites in total among sequences from worms from Ireland and Britain, only 2 displayed transversions, which gave a transition/ transversion ratio of 6·5[ratio ]1 (Table 2).

Of the 15 mutations recorded for sequences from Ireland and Britain, 4 were non-synonymous changes. A transition from A to G at position 43 was found in 2 worms from the River Lee, Cork. This results in an amino acid change from serine to glycine. Two non-synonymous changes occurred in sequences from chub in the River Culm. The mutation at position 268 results in an amino acid change from leucine to methionine. These amino acids belong to the same group. The mutation at position 292 also results in an amino acid change within the same group, from leucine to valine.
Median network of Irish and British sequences
Fig. 1 represents 12 haplotypes found in P. laevis from the populations sampled in Ireland and Britain. The haplotypes cluster into 2 groups, which are separated by 5 to 8 substitutions. The first group at the left of the network is composed mainly of P. laevis from brown trout. All of the populations from brown trout from Ireland, England and Scotland are represented in this group. Two non-salmonid populations are also present. These are the flounder population from the River Otter and 2 individuals from bullhead. Sequences from P. laevis from Co. Mayo display no intra-population diversity. P. laevis from brown trout from Cork are the most heterogeneous of the group, consisting of 3 haplotypes, 1 of which is also found in English brown trout. The mean percentage divergence within this group is 0·70% ±0·30 (±S.D.). Percentage divergences between all haplotypes are shown in Table 3.

Fig. 1. Network of Pomphorhynchus laevis, cytochrome c oxidase gene (subunit I) from Ireland and Britain. Partial sequences of 295 base pairs in length were aligned. Each line (delineated by black dots) represents 1 base difference between samples. Large numbers in parentheses represent sample sizes. Smaller numbers show the position of each mutation with transversions in parentheses.
Table 3. Percentage differences between haplotypes of Pomphorhynchus laevis from Ireland and Britain (Above the diagonal, substitution numbers are shown and below the diagonal, percentage differences are shown.)

The second group on the right consists of 2 populations of host, chub and bullhead. The dominant haplotype in this group is present in both populations, which are also from different river systems. P. laevis from chub from the River Culm represents the most diverse population as 4 haplotypes were revealed. Three haplotypes differ from the main one by just 1 unique mutation. The mean percentage divergence within this group is 0·35% ±0·00 (±S.D.).
The most frequent haplotype in the mainly salmonid group differs from that in the cyprinid group by 6 base changes. Overall the mean percentage divergence between these two groups is 2·20% ±0·27 (±S.D.).
AMOVA analysis
The hypothesis of strain formation in P. laevis states that P. laevis in freshwater exists as 2 distinct strains in Ireland and England (Kennedy et al. 1989). By adhering to this hypothesis, it follows then that genetic variation among all of the haplotypes should be greatest between countries. Three hypotheses were tested. A population genetic structure was imposed on the data using country of origin, host species and host tolerance to saline (e.g. euryhaline versus stenohaline) to partition the populations into particular groups.
Only 26·09% of the variation was found between groups, when populations were grouped by country (Table 4). Neither this statistic nor the fixation index, FCT were significant. A greater amount of variation, 39·88%, was found between groups, when populations were grouped by host species, though this was also not significant (Table 4). It is more likely that P. laevis from flounder are not separate from those occurring in brown trout in the River Otter. For this reason another test of groups differentiated by host species was conducted, this time omitting the flounder group. A slightly greater proportion of the genetic variation was assigned to this group (Table 4). Finally the populations were grouped according to the salt tolerance of the host. Brown trout and flounder are euryhaline fish and are able to tolerate both fresh and sea water and ranges in between, while chub and bullhead are strictly stenohaline and do not tolerate saline conditions. This showed that 61·2% of the genetic variation was explained by this genetic structure and this was found to be statistically significant, P=0·041 (Table 4).

DISCUSSION
Irish and British sequences
A clear separation of 2·2% has been found between 2 clusters of 12 P. laevis haplotypes based on partial COI sequences. The existence of 2 freshwater strains of P. laevis in the UK and Ireland has previously been proposed (Kennedy et al. 1989) and the results concur with this hypothesis. The term ‘strain’ should imply a partitioning of genetic variation between populations from different hosts or areas rather than within populations (Thompson & Lymbery, 1990). Low intra-strain variability was also found which enhances the significance of the percentage divergence. However, the composition of the 2 groups in the median network for P. laevis was unexpected. Based on the strain hypothesis it was anticipated that if differences were found, they would be between material from Ireland and from Britain (Kennedy et al. 1989). In 1 of the groups, sequences from Ireland, western Scotland and from a single locality in southwest England cluster together while the other major group is formed by sequences of English origin only. Therefore a clear geographical split was not found. Instead, it was the definitive host that seemed to account for the 2·2% divergence between groups. That the host (salmonid versus cyprinid) rather than geographical location accounted for the sequence divergence was corroborated by the AMOVA analysis. Very little correlation between genetic variation and geography was found. Both host species and the host's tolerance to salinity explained a much larger percentage of the variation. Although host salinity tolerance explained 61·2% of the variation, which was greater than that explained by host species, 45·57%, a possible separation of the strains by host species should not be dismissed.
The sequences from worms found in English chub and bullhead grouped together. This supports the hypothesis that the salinity tolerance of the host (host physiology) rather than the host species might be responsible for strain differentiation in P. laevis. Bullhead are not definitive hosts of P. laevis as the parasite rarely matures in this fish (Hine & Kennedy, 1974a). The bullhead came from the River Avon and it is well documented that chub and barbel are the definitive hosts of P. laevis in this river (Hine & Kennedy, 1974a,b). If the sequences from bullhead actually represent a population from chub/barbel, then the divergence between the strains may represent a coarse fish/ brown trout split, rather than a stenohaline/euryhaline split.
The presence of the ‘brown trout’ strain in flounder in the River Otter is explicable as probably being due to P. laevis from brown trout cycling through flounder. In freshwater, P. laevis does not mature in flounder, although it can survive in this host (Kennedy, 1984). A similar explanation can also be put forward for the presence of the ‘brown trout’ strain in a single bullhead. Brown trout are also found in the River Avon and are responsible for the maintenance of P. laevis in the upper reaches, though at much lower levels (Hine & Kennedy, 1974a; Kennedy, Broughton & Hine, 1978). It is therefore possible that bullhead are host to the ‘brown trout’ strain due to its natural presence in G. pulex or due to stocking of fish infected with this strain and subsequent transmission to bullhead.
In comparable work, an extensive study of variation in the COI gene of isolates of Echinococcus granulosus from a range of hosts and geographical locations identified 9 distinct genotypes (Bowles, Blair & McManus, 1992; Zhang et al. 1998). Though the level of difference between some of the genotypes was almost equal to that between known subspecies of E. granulosus, only small differences of 1 to 3 bases were found between others. Those strains that differed from the reference sequence by only 1 to 3 bases maintained their status due to concomitant important epidemiological differences. Other studies e.g. on Schistosoma japonicum and Fasciola sp. in Asia have revealed very little genetic differentiation between proposed strains despite epidemiological and morphological differences (Bowles et al. 1993; Itagaki et al. 1998).
One of the assumptions of the strain hypothesis is that the Irish strain is the most recently evolved (Kennedy et al. 1989). This is based on the fact that neither of the cyprinid hosts of P. laevis, chub and barbel, occur in Ireland. Therefore it was assumed that P. laevis could only have colonized Ireland due to the stocking of Irish rivers with infected cyprinids. Because of the depauperate nature of Ireland's ichthyofauna, it became popular to stock rivers with non-native species for recreational purposes. The stocking of infected cyprinids is thought to have occurred within the last 500 years, approximately. A record for the introduction of carp and tench goes back to 1634 (Went, 1950).
Based on work carried out on the mitochondrial DNA of higher animals, it is thought that a sequence divergence of 2% represents a divergence date of 1 million years ago (Hewitt, 1996). Similar estimates of between 1·7 and 2·3% exist for arthropods (Hewitt, 1996). The rate of evolution of acanthocephalan mitochondrial DNA is unknown but using these estimates as a rough guideline it is feasible to state that it seems unlikely that a mean divergence of 2·2% arose in P. laevis over the last 500 years. Britain and Ireland were re-colonized after the last ice age, more than 7500 years ago (Wheeler, 1977) and it is likely that the level of divergence predates even this. It is more plausible that the divergence occurred during the last ice age, due to the division of populations into separate refugia. Alternatively, because substitution rates in the Acanthocephala are unknown, mutations may accumulate very quickly in mitochondrial DNA. Therefore the possibility of an introduction of P. laevis into Ireland within the last 500 years and its subsequent evolution into the Irish brown trout strain cannot be dismissed (Kennedy et al. 1989). It is not possible to ascertain from these present data if P. laevis is native to Ireland and colonized with the salmonids or if it was introduced via human intervention.
In conclusion 2 major British Isles P. laevis strains are distinguished by a 2·2% difference in subunit I of the mitochondrial COI gene. These strains most closely resemble the Irish and English strains described by Kennedy et al. (1989). The strains revealed by this study do not seem to be separated by geography and there is evidence to suggest that each strain is restricted to a particular type of host. Due to the fact that P. laevis from English brown trout and Scottish sea trout are only represented by one sample, a geographical split of P. laevis populations cannot be ruled out at this stage. When compared with other studies (e.g. cestodes) the strain status of English and Irish P. laevis is warranted. Currently very little research has been carried out on molecular differences between acanthocephalan species. Therefore it is difficult to say whether the differences found here constitute species differences. However, one study has found at least a 50% difference between P. laevis and P. lucyi at the ITS1 and ITS2 regions (Král'ová-Hromadová et al. 2003), which is substantially greater than the between strain differences found in this study.
These results suggest the following potential future research. Due to the limited number of samples from the UK in particular it would be worthwhile to collect more samples from both cyprinid and salmonid hosts, to elucidate the influences of geography and host on the genome of P. laevis. It is essential to include more molecular markers e.g. ITS1 and ITS2 as suggested by Perrot-Minnot (2004) in order to test the validity of the COI results. Appropriate samples could be collected from Europe e.g. the rivers Rhine and Danube of both P. laevis and disputed Pomphorhynchus species. Firstly these samples would allow a direct comparison with British and Irish samples, which might provide insight on the most recent common ancestor of the two strains. The inclusion of more samples would also allow the construction of a gene tree which would highlight phylogenetic relationships. Secondly a comparison between various Pomphorhynchus species at the molecular level would enable the systematic revision of this group, which has been long sought after (Brown, 1987).
This research was funded by an Enterprise Ireland Basic Research Grant no. SC/998/119/. We are deeply grateful to the following people for providing samples; Dr Russell Poole, Marine Institute Salmon Management Services; Dr Ken MacKensie, University of Aberdeen; Dr Bahram Dezfuli, University of Ferrara; Michelle Steinhauer, University of Nebraska; Nicholas Tattersal, University College Cork and Desmond MacDonald. We are very thankful for the expert technical assistance of Dr Ceiridwen Edwards and Dr David Magee, Bovine Genetics Laboratory, TCD.
References
REFERENCES
BANDELT, H. J.,
FORSTER, P.,
SYKES, B. C. &
RICHARDS, M. B. (
1995).
Mitochondrial portraits of human populations using median networks.
Genetics
141,
743–753.Google Scholar
BOWLES, J.,
BLAIR, D. &
McMANUS, D. P. (
1992).
Genetic variants within the genus Echinococcus identified by mitochondrial DNA sequencing.
Molecular and Biochemical Parasitology
54,
165–174.CrossRefGoogle Scholar
BOWLES, J.,
HOPE, M.,
TIU, W. U.,
LIU, X. &
McMANUS, D. P. (
1993).
Nuclear and mitochondrial genetic markers highly conserved between Chinese and Philippine Schistosoma japonicum.
Acta Tropica
55,
217–229.CrossRefGoogle Scholar
BROWN, A. F. (
1987).
Anatomical variability and secondary sexual characteristics in Pomphorhynchus laevis (Muller, 1776) (Acanthocephala).
Systematic Parasitology
9,
213–219.CrossRefGoogle Scholar
BROWN, A. F. (
1989).
Seasonal dynamics of the acanthocephalan Pomphorhynchus laevis (Muller, 1776) in its intermediate and preferred definitive hosts.
Journal of Fish Biology
34,
183–194.CrossRefGoogle Scholar
EVANS, D. W.,
MATTHEWS, M. A. &
McCLINTOCK, C. A. (
2001).
First record of Pomphorhynchus laevis (Acanthocephala) in fishes from Northern Ireland.
Journal of Fish Biology
59,
166–168.CrossRefGoogle Scholar
FITZGERALD, R. D. &
MULCAHY, M. F. (
1983).
Parasites of salmon Salmo salar L. and trout Salmo trutta L. in the River Shournagh.
Irish Fisheries Investigations Series A
23,
24–31.Google Scholar
GAREY, J. R. &
WOLSTENHOLME, D. R. (
1989).
Platyhelminth mitochondrial DNA: evidence for early evolutionary origin of a tRNAserAGN that contains a dihydrouridine arm replacement loop, and of serine-specifying AGA and AGG codons.
Journal of Molecular Evolution
28,
374–387.CrossRefGoogle Scholar
GIBSON, D. I. (
1972).
Flounder parasites as biological tags.
Journal of Fish Biology
4,
1–9.CrossRefGoogle Scholar
HEWITT, G. M. (
1996).
Some genetic consequences of ice ages, and their role in divergence and speciation.
Biological Journal of the Linnean Society
58,
247–276.CrossRefGoogle Scholar
HINE, P. M. &
KENNEDY, C. R. (
1974 a).
Observations on the distribution, specificity and pathogenicity of the acanthocephalan Pomphorhynchus laevis (Muller).
Journal of Fish Biology
6,
521–535.Google Scholar
HINE, P. M. &
KENNEDY, C. R. (
1974 b).
The population biology of the acanthocephalan Pomphorhynchus laevis (Muller) in the River Avon.
Journal of Fish Biology
6,
665–679.Google Scholar
HOLLAND, C. V. &
KENNEDY, C. R. (
1997).
A checklist of parasitic helminth and crustacean species recorded in freshwater fish from Ireland.
Biology and Environment
97B,
225–243.Google Scholar
ITAGAKI, T.,
HONNAMI, M.,
ITO, D.,
ITO, K.,
TSUTSUMI, K.,
TERASAKI, K.,
SHIBAHARA, T. &
NODA, Y. (
2001).
Mitochondrial DNA polymorphism of a triploid form of Fasciola in Japan.
Journal of Helminthology
75,
193–196.Google Scholar
KENNEDY, C. R. (
1984).
The status of flounders, Platichthys flesus L., as hosts of the acanthocephalan Pomphorhynchus laevis (Muller) and its survival in marine conditions.
Journal of Fish Biology
24,
135–149.Google Scholar
KENNEDY, C. R.,
BATES, R. M. &
BROWN, A. F. (
1989).
Discontinuous distributions of the fish acanthocephalans Pomphorhynchus laevis and Acanthocephalus anguillae in Britain and Ireland: an hypothesis.
Journal of Fish Biology
34,
607–619.CrossRefGoogle Scholar
KENNEDY, C. R.,
BROUGHTON, P. F. &
HINE, P. M. (
1976).
The sites occupied by the acanthocephalan Pomphorhynchus laevis in the alimentary canal of fish.
Parasitology
72,
195–206.CrossRefGoogle Scholar
KENNEDY, C. R.,
BROUGHTON, P. F. &
HINE, P. M. (
1978).
The status of brown and rainbow trout, Salmo trutta and Salmo gairdneri as hosts of the acanthocephalan Pomphorhynchus laevis.
Journal of Fish Biology
13,
265–275.CrossRefGoogle Scholar
KRÁL'OVÁ-HROMADOVÁ, I.,
TIETZ, D. F.,
SHINN, A. P. &
šPAKULOVÁ, M. (
2003).
ITS rDNA sequences of Pomphorhynchus laevis (Zoega in Müller, 1776) and P. lucyi Williams & Rogers, 1984 (Acanthocephala: Palaeacanthocephala).
Systematic Parasitology
56,
141–145.Google Scholar
MOLLOY, S.,
HOLLAND, C. &
O'REGAN, M. (
1995).
Population biology of Pomphorhynchus laevis in brown trout from two lakes in the west of Ireland.
Journal of Helminthology
69,
229–235.CrossRefGoogle Scholar
MUNRO, M. A.,
REID, A. &
WHITFIELD, P. J. (
1990).
Genomic divergence in the ecologically differentiated English freshwater and marine strains of Pomphorhynchus laevis (Acanthocephala: Palaeacanthocephala): a preliminary investigation.
Parasitology
101,
451–454.CrossRefGoogle Scholar
MUNRO, M. A.,
WHITFIELD, P. J. &
DIFFLEY, R. (
1989).
Pomphorhynchus laevis (Muller) in the flounder, Platichthys flesus L., in the tidal River Thames: population structure, microhabitat utilization and reproductive status in the field and under conditions of controlled salinity.
Journal of Fish Biology
35,
719–735.Google Scholar
O'MAHONY, E. M.,
KENNEDY, C. R. &
HOLLAND, C. V. (
2004).
Comparison of morphological characters in Irish and English populations of the acanthocephalan Pomphorhynchus laevis (Muller, 1776).
Systematic Parasitology (in the Press).CrossRefGoogle Scholar
PERROT-MINNOT, M. J. (
2004).
Larval morphology, genetic divergence, and contrasting levels of host manipulation between forms of Pomphorhynchus laevis (Acanthocephala).
International Journal for Parasitology
34,
45–54.CrossRefGoogle Scholar
SCHNEIDER, S.,
ROESSLI, D. &
EXCOFFIER, L. (
2000).
Arlequin ver.2.000: a software for population genetics data analysis.
Genetics and Biometry Laboratory, University of Geneva,
Switzerland.
THOMPSON, R. C. A &
LYMBERY, A. J. (
1990).
Intraspecific variation in parasites – what is a strain?
Parasitology Today
6,
345–347.Google Scholar
WENT, A. E. J. (
1950).
Notes on the introduction of some freshwater fish into Ireland.
Journal of the Department of Agriculture, Dublin
47,
119–124.Google Scholar
WHEELER, A. (
1977).
The origin and distribution of the freshwater fishes of the British Isles.
Journal of Biogeography
4,
1–24.CrossRefGoogle Scholar
ZHANG, L.,
ESLAMI, A.,
HOSSEINI, S. H. &
McMANUS, D. P. (
1998).
Indication of the presence of two distinct strains of Echinococcus granulosus in Iran by mitochondrial DNA markers.
American Journal of Tropical Medicine and Hygiene
59,
171–174.CrossRefGoogle Scholar
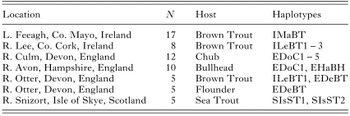
Table 1. The location, number and host of Pomphorhynchus laevis samples collected for sequencing as well as the haplotypes found at each location
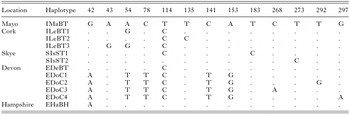
Table 2. The polymorphic sites found in partial sequences of the COI gene of Pomphorhynchus laevis from Ireland and Britain
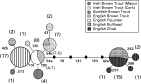
Fig. 1. Network of Pomphorhynchus laevis, cytochrome c oxidase gene (subunit I) from Ireland and Britain. Partial sequences of 295 base pairs in length were aligned. Each line (delineated by black dots) represents 1 base difference between samples. Large numbers in parentheses represent sample sizes. Smaller numbers show the position of each mutation with transversions in parentheses.
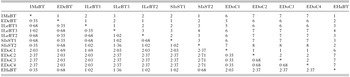
Table 3. Percentage differences between haplotypes of Pomphorhynchus laevis from Ireland and Britain
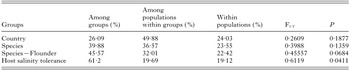
Table 4. Results of AMOVA analyses where populations have been grouped by country, species, species minus flounder and host salinity tolerance
 You have
Access
- 27
- Cited by