INTRODUCTION
Organic wastes such as compost (CO), biogas residues (BR) and sewage sludge (SS) are valuable and important sources of plant nutrients and soil conditioners (Tennakoon & Hemapala Bandara Reference Tennakoon and Hemapala Bandara2003). Farmers and gardeners have long recognized the importance of replacing nutrients and organic matter that may be depleted during continuous cropping. There is currently a renewed interest in ‘nutrient recycling’, due to the high cost of mineral fertilizers and the growing need for suitable disposal methods for the increasing amounts of organic waste.
Compost from source-separated household waste contains relatively high levels of plant-available phosphorus (P-AL) compared to mineral nitrogen (N) (Svensson et al. Reference Svensson, Odlare and Pell2004). However, CO can be a valuable soil conditioner as it provides the soil with organic carbon (C), which enhances soil structure (Jakobsen Reference Jakobsen1995) and has a beneficial effect on soil microbiology (Odlare et al. Reference Odlare, Pell and Svensson2008). Biogas residue is generated by degradation of different organic materials during biogas production and is rich in plant nutrients (Arthurson Reference Arthurson2009). The question of whether or not agricultural soils should be amended with SS has been debated for decades. Alarming reports of high concentrations of heavy metals and organic pollutants have raised concern regarding the use of SS in food cropping systems among both farmers and consumers (Aparicio et al. Reference Aparicio, Santos and Alonso2009). However, SS contains a significant amount of P as a result of the chemical precipitation of P in the waste treatment process, and several studies have shown that the amount of available P in soil increases following sludge application (Debosz et al. Reference Debosz, Petersen, Kure and Ambus2002; Odlare et al. Reference Odlare, Pell and Svensson2008).
The production of organic wastes of various origins continues to grow, and the problem of dealing with these waste products needs to be solved urgently. There is therefore a need for long-term field experiments where long-term environmental effects can be properly monitored. Soil microbes are sensitive to changes in the soil environment and may respond more quickly to the effects of organic wastes than chemical parameters (Dick Reference Dick1992; Kowalchuk & Stephen Reference Kowalchuk and Stephen2001). In particular, measurements of the status and activity of specific microbial communities that contribute to soil processes have the potential to provide rapid and sensitive means of characterizing changes in soil quality. Microbial activity reflects living cells, nutrient cycling (Masto et al. Reference Masto, Chhonkar, Singh and Patra2006) and enzyme activity in the soil environment and can therefore serve as an indicator of soil quality (Roldán et al. Reference Roldán, Salinas-García, Alguacil, Díaz and Caravaca2005).
Most farmers using extensive agriculture would probably not rely solely on organic wastes as fertilizer, since a significant proportion of the nutrients may be bound to the organic material and hence not immediately available to plants. A more realistic approach would be to mix organic wastes with mineral N fertilizer. Mineral nutrients would then be available for the plants immediately, while the organically bound nutrients would be released slowly, benefitting the crop on a more long-term basis.
The aim of the present study was to evaluate the long-term effects of combining organic waste and mineral N fertilizer application to an agricultural soil with a crop rotation of barley and oats. An 8-year field trial was established where soil was amended annually with CO, BR and SS. The application rate was based on N, where the soil received a total of 100 kg N/ha/year. Half of the N was applied as organic waste and the other half as mineral N fertilizer. The effects of these products on soil microbial activity, microbial community structure, soil chemistry variables and crop yield were evaluated.
MATERIALS AND METHODS
Site characteristics and experimental design
The site chosen for the experiment (Brunnby Farm, 59°37′N, 16°33′E, 15 m a.s.l.) was a poorly structured clay soil classified as a Eutric Cambisol (FAO 1998). This soil type is common in east-central Sweden and is usually low in organic matter. Hence, such soil would probably benefit from amendment with organic waste. The experiment used a simple crop rotation with spring barley and spring oats grown in alternate years; the crop residue was removed as straw. The experimental set-up was a randomized block design with four replicates and a plot size of 6 × 15 m.
Treatments
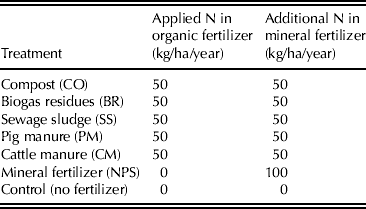
Biogas residue was collected from biogas plants in Stockholm and Västerås in central Sweden where source-separated organic waste is co-digested with restaurant waste and grass. The CO was produced at a municipal composting plant in Västerås and consisted of 0·70 source-separated organic waste and 0·30 chopped park and garden litter. Sewage sludge was collected from a municipal wastewater treatment plant in Västerås and the pig and cattle manures (CM) were collected from local farmers. The mineral fertilizer (nitrogen, phosphorus and sulphur (NPS)) was composed of 0·50 NH4-N and 0·50 NO3-N and was applied as inorganic granulated solids. Unfertilized plots were used as controls. All fertilizers were applied at a rate corresponding to 100 kg total N/ha/year. The strategy in the experiment was to apply relatively small amounts of the organic waste, so that the N supply should not exceed a plant requirement of c. 100 kg/ha/year. One advantage of this strategy is that it should be possible to see to what extent organically bound N is mineralized and made available to the plant.
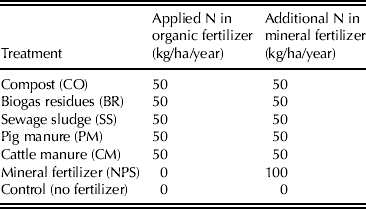
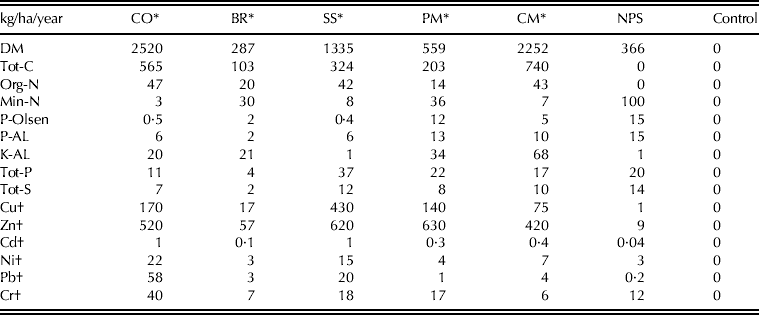
The organic amendments were applied in combination with mineral fertilizers, so that half of the added N originated from the organic amendment and the other half came from the mineral fertilizer (Table 1). The actual amounts of dry matter and various plant nutrients applied annually are shown in Table 2. Biogas residue and pig manure (PM) were liquid and hence spread immediately before stem elongation (determined through visual inspection) in the middle of June, whereas CO, SS and CM were solid and spread a few days before ploughing in late autumn. Mineral fertilizers were applied in the spring at sowing.
Treatments in the long-term field experiment cropped with barley and oats. All treatments correspond to 100 kg N/ha/year
Mean annual application rates (n = 8) of dry matter, total carbon, plant nutrients and heavy metals in the field experiment

CO, compost; BR, biogas residue; SS, sewage sludge; PM, pig manure; CM, cattle manure; NPS, mineral fertilizer; DM, dry matter.
* These organic amendments were applied together with mineral N corresponding to 50 kg/ha/year.
† Expressed as g/ha/year.
Soil and crop sampling
Soil samples were collected from each plot in the autumn, 4 weeks after harvest, from 1999 to 2002, and also in 2004 and 2006. Each experimental plot was sampled c. 25 times from the topsoil at a depth of 0–200 mm with soil corers of 22–25 mm internal diameter to obtain 4 kg of moist soil per plot. The soil samples were placed in polythene bags and transported to the laboratory where they were separated into three subsamples. For DNA extraction, the samples were frozen immediately at –20 °C. For microbial activity measurements, the samples were dried at 2 °C to a dry matter content of 0·83, sieved (5 mm) and then frozen (–20 °C) prior to analysis. For chemical analyses the soil was dried at 35 °C until it was completely dry and easy to grind before storage at room temperature. Samples of organic wastes, CM and PM were frozen at –20 °C degree prior to analysis.
Crop yield was determined from 36 m2 sub-plots (6 × 6 m). From each plot, 1000 g subsamples of grain were collected for further analysis. Crop sampling was performed every year from 1999 to 2002, and in 2004 and 2006. Barley was therefore sampled four times and oats were sampled twice. The current paper presents the results for barley.
Chemical analyses
Total soil carbon (Tot-C) and nitrogen (Tot-N) were analysed with a C, N and S analyser (CNS-2000, LECO Equipment Corp., St Joseph, MI, USA). Total soil C was corrected for carbonate to determine organic C (Org-C). Mineral N (NH4-N and NO3-N) was analysed by dialysis with an AutoAnalyser TRAACS 800 (Application method no. ST9002-NH4D and ST9002-NO3D; Kontram, Stockholm, Sweden). Organic N was measured by the Kjeldahl method (Bremner & Mulvaney Reference Bremner, Mulvaney, Page, Miller and Keeney1982). Available P (P-AL) and K (K-AL) were analysed by the ammonium lactate method (AL) (Egnér et al. Reference Egnér, Riehm and Domingo1960). Soil pH was determined in 0·01 M CaCl2 at a 1:2 vol/vol ratio (pHCaCl). Total S (Tot-S), total P (Tot-P), copper (Cu), zinc (Zn), cadmium (Cd), nickel (Ni), lead (Pb) and chromium (Cr) were analysed by ICP-AES (Perkin Elmer ICP Optima 3000, Perkin Elmer Inc., Waltham, MA, USA) according to SS 02 83 11 (SIS 1997).
Microbiological biomass and activity analyses
All microbial assays are presented as mean results of assays run in triplicate. Basal respiration (B-resp) and microbial biomass – measured as substrate-induced respiration (SIR) and specific growth rate (μSIR) – were determined in 25 g soil adjusted to 0·60 of the water holding capacity and incubated at 20 °C. Evolution of carbon dioxide (CO2) was determined hourly with a respirometer (Respicond III, Nordgren Innovations AB, Umeå, Sweden). Carbon dioxide was quantified from changes in conductivity during accumulation in 0·25 mol/dm3 potassium hydroxide (KOH) solution (Nordgren Reference Nordgren1992). B-resp was calculated as the average respiration rate measured for incubation times between 200 and 240 h. The SIR measurement was then initiated by mixing a substrate consisting of 75 mg glucose, 2·5 mg (NH4)2SO4-N, 0·5 mg KH2PO4-P and 1000 mg of powdered talcum into each soil sample. Empty vessels were used as controls. The respiration data were fitted to an exponential growth equation (Eqn (1)) by nonlinear regression (Stenström et al. Reference Stenström, Svensson and Johansson2001):
 $$\displaystyle{{{\rm d}p} \over {{\rm d}t}} = r\,{\rm e}^{{\mu} t} + K$$
where dp/dt is the rate of CO2 formation, r is the initial respiration rate of growing micro-organisms, μ is the specific growth rate and t is the time elapsed after addition of the substrate. Thus reμt is the CO2 production rate of exponentially growing micro-organisms and K is the CO2 production rate of non-growing micro-organisms. The SIR rate is defined as the sum of r and K, i.e. the total respiration rate obtained instantaneously on addition of substrate. Using this equation, the SIR response after addition of glucose can be divided into the initial respiration rate of growing (active) and non-growing (dormant) micro-organisms. Altogether, this method provides a quantitative estimate of the active and dormant micro-organisms as well as the parameters SIR and μSIR. The metabolic quotient, qCO2, was defined as the ratio of B-resp to SIR.
The potential ammonia oxidation rate (PAO) in 25 g of soil was assayed as accumulated nitrite (NO2−-N) according to the short-incubation chlorate-inhibition technique (Belser & Mays Reference Belser and Mays1980; Torstensson Reference Torstensson1993; ISO 15685 2012). In the assay, samples of slurry were collected after 2 h and then at four 1 h intervals and analysed for NO2− by Flow Injection Analysis (FIAstar 5000 Analyser, Foss-Techator AB, Höganäs, Sweden). The rate of NO2−-N formation was determined by linear regression.
The potential denitrification activity (PDA) was assayed in 25 g of soil according to the modified short incubation C2H2-inhibition method (Pell et al. Reference Pell, Stenberg, Stenström and Torstensson1996). The assay substrate contained 0·002 mol/dm3 glucose and 2 mol/dm3 KNO3. During the assay, seven gas samples were withdrawn from the headspace, at 15 min and then at 30 min intervals, and analysed for nitrous oxide (N2O) on a gas chromatograph with a back flush system to eliminate water vapour, and an electron capture detector (ECD) for determination of N2O (Chrompack CP9001, Varian-Chrompack Int. B.V., Middelburg, The Netherlands). The rate of N2O-N formation increased with time and these data were fitted to a product formation equation that takes exponential growth into consideration (Stenström et al. Reference Stenström, Hansen and Svensson1991). Two parameters, the initial product formation rate (i.e. the PDA) and the specific growth rate (μPDA) were derived by nonlinear regression (Eqn 2).
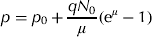 $$p = p_0 + \displaystyle{{qN_0} \over {\mu}} ({\rm e}^{\mu} - 1)$$
where p is the amount of product at time t, p 0 is the amount of product at the start, q is the specific enzyme activity, N 0 is the number of bacteria at the start and μ is the specific growth rate constant. In applying the equation to the PDA assay, qN 0 represents the PDA and μ represents the μPDA.
Nitrogen mineralization capacity (N-min) was measured by anaerobic incubation (Waring & Bremner Reference Waring and Bremner1964). Slurry containing 10 g of soil and 50 ml water was incubated anaerobically for 10 days at 37 °C before extraction and analysis of ammonium (NH4+). The extractions were centrifuged for 3 min at 4500 rpm, filtered through filter paper (Munktell, size 00A) and analysed by Flow Injection Analysis . The rate of NH4+-N formation was determined from the difference between NH4+ content measured at the start and end of the 10-day incubation period.
Bacterial community structure analysis
The bacterial community structure in the treatments was compared and evaluated by means of a fingerprinting approach, which used the polymerase chain reaction (PCR) followed by terminal restriction fragment length polymorphism (T-RFLP) analysis. Genomic DNA was extracted from 500 mg of each of the 16 soil samples using a FastDNA kit (Bio 101, Carlsbad, CA, USA) according to the manufacturer's instructions. Extraction was performed in duplicate and the isolated DNA was stored immediately at –20 °C until use.
For T-RFLP analysis of 16S rRNA gene fragments, bacterial primers 926r (5′-CCGTCAATTCCTTTRAGTTT-3′) and fD1-FAM (5′-AGAGTTTGATCCTGGCTCAG-3′), 5′-end-labelled with phosphoramidite fluorochrome 5-carboxy-fluorescein (5′6FAM), were used. Primers were synthesized by Invitrogen (Carlsbad, CA, USA). PCR amplification was performed in 50 μl reaction mixtures containing 35 × 10−12 moles of each primer, 2·5 unit Taq DNA polymerase (Amersham Bioscience, NJ, USA), 1× PCR buffer, 10 × 10−9 moles of dNTPs, c. 30 ng of template DNA and sterile distilled water. Thermal cycling was performed using a Gene Amp PCR 9700 system (Applied Biosystems, Fremont, CA, USA), with an initial denaturation step of 95 °C for 3 min, followed by 35 cycles of 40 s at 94 °C, 40 s at 55 °C and 1 min at 72 °C, and a final primer extension step at 72 °C for 7 min. The DNA amplification was confirmed by electrophoresis of 10 μl aliquots of the PCR mixtures on 0·01 agarose gels containing 0·0002 ethidium bromide EtBr) in 1 × TAE buffer (0·04 m Tris-acetate, 1 mm ethylenediaminetetraacetic acid (EDTA)). For each sample, duplicate fluorescently labelled PCR products were mixed and incubated for 2 h at 37 °C in three parallel restriction digestions with HaeIII, HhaI and MspI, respectively (Amersham Biosciences, NJ, USA). Each digest contained 12 μl of PCR product (c. 20 ng DNA), 5 U of restriction enzyme, 5 μl of the appropriate restriction buffer, 5 μl of 0·001 bovine serum albumin (BSA) for MspI and sterile water to a final volume of 50 μl. Digested DNA (5 μl) was analysed by electrophoresis on 0·01 agarose gel containing 0·0002 EtBr in 1× TAE buffer. Fluorescently labelled DNA fragments were separated and detected using an ABI3700 capillary sequencer (Applied Biosystems, Fremont, CA, USA). Before injection, 1·4 μl of the DNA sample was denatured in the presence of 10 μl Hi-Di™ formamide and 0·04 μl GS ROX-500 size standard (Applied Biosystems, Fremont, CA, USA) at 95 °C for 5 min. Injection was performed electrokinetically at 10 kV for 50 s, followed by electrophoresis at 7·5 kV for 80 min.
The lengths and peak areas of terminal restriction fragments (TRFs) were determined using Peak Scanner software (Applied Biosystems, Fremont, CA, USA). The relative peak area of each TRF was determined by dividing the area of the peak of interest by the total area of peaks between the lower and upper threshold values of 60 and 500 bp. A threshold for relative abundance was applied at 0·002 and the relative abundance of the remaining peaks was recalculated and included in the analyses.
Data treatment
Significant differences between the different treatments were evaluated by one-way analysis of variance (ANOVA) followed by Tukey's HSD multiple comparison test (P < 0·05). Statistical interactions between treatment and year were evaluated using a general linear model. All statistical tests were performed in the computer software package SPSS v. 19.0 (SPSS Inc., Chicago, IL, USA). All reported effects are statistically different at P < 0·05 unless stated otherwise. Principal component analysis (PCA) was performed using Unscrambler v. 10.01 (Camo Software AS, Oslo, Norway).
The T-RFLP data were evaluated using non-metric multidimensional scaling (NMS; PC-ORD v. 5.10, MjM Software, OR, USA). Distance matrices obtained using the Bray–Curtis distance measure were based on the relative abundance data of TRFs obtained after cleavage with the HaeIII restriction enzyme. Dimensionality was assayed by exploring changes in stress according to dimensional variations, and the best alternative for each dimension selected as the real run presenting the lowest final stress value. Monte Carlo tests of randomized and real data were performed to assess axis significance.
RESULTS
Amendment characteristics
Among the organic residue treatments, CM and CO received the highest annual mean amounts of C (740 and 565 kg/ha/year) and organic N (43 and 47 kg/ha/year), respectively, while PM and BR received the highest amounts of mineral N from the organic residue (36 and 30 kg/ha/year, respectively) (Table 2). In addition, all treatments except the control received 50 kg N/ha/year from the complementary fertilization with NPS. Treatments BR and SS received the lowest and highest mean amounts of Tot-P (4 and 37 kg/ha/year) and Tot-S (2 and 12 kg/ha/year), respectively, while PM had received the highest plant available P (12 and 13 kg/ha/year of P-Olsen and P-AL, respectively). Considering all the treatments, NPS received the highest annual mean amounts of Min-N, plant available P and Tot-S.
In general, treatments CO and SS received the highest mean amounts of metals, with SS receiving higher rates of Cu and Zn, and treatment CO higher rates of Ni, Pb and Cr (Table 2). In addition, all treatments but the control received 6 g Cr/ha/year as a result of the supplementary mineral N fertilization (Table 2).
Yield
Analysis with ANOVA showed no interactions between treatments and years and no significant differences between the years. The accumulated effects of the different treatments were therefore calculated as mean values of all 8 years of the field experiment (n = 32). This avoids the effects of extreme values due to conditions such as drought, heavy rainfall, or unusually hot or cold seasons. Using mean values of all years makes detection of trends in the dataset more reliable.
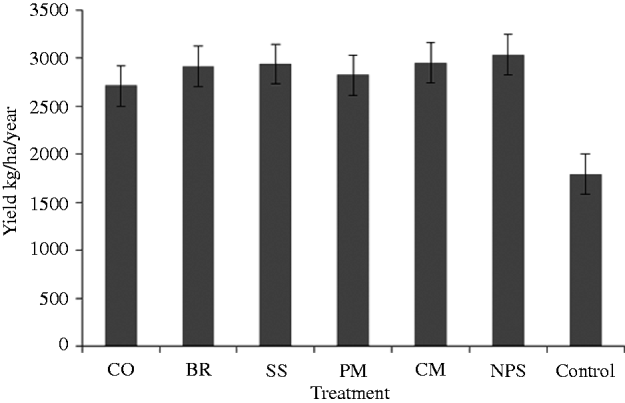
Mean barley yields over the 8-year period varied in all treatments from 2537 to 2908 kg/ha/year, except for the control where the mean yield for the 8 years was 1675 kg/ha/year (Table 3 and Fig. 1). Although tendencies of higher yields were seen with NPS application, and lower yields with CO, no statistically significant differences in crop yields between plots treated with any of the fertilizers was observed.
Mean grain yield of barley for the years 1999–2006 (n = 16). Error bars represent s.e.d. at d.f. = 8, P < 0·05.
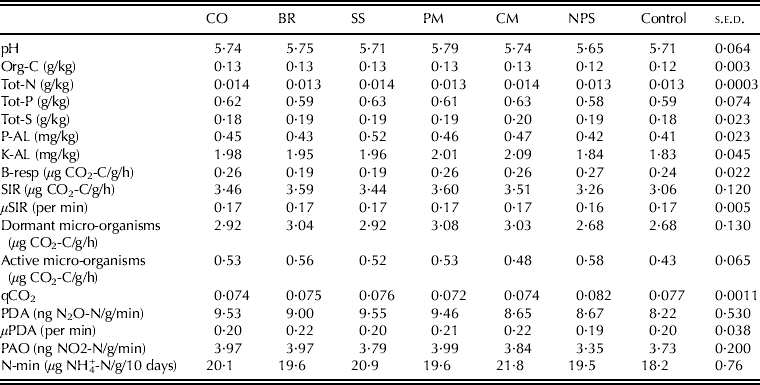
Soil chemical and microbiological characteristics after fertilizer amendment. Means calculated as mean values over the years 1999–2006 (n = 24, d.f. = 8, P < 0·05); s.e.d., standard error of difference
CO, compost; BR, biogas residue; SS, sewage sludge; PM, pig manure; CM, cattle manure; NPS, mineral fertilizer.
Soil chemical effects
Only small differences in content of Org-C and Tot-N in the soil were observed between the various treatments (Table 3). The organic residues resulted in a C content of c. 0·13 g/kg in all treatments, which was significantly higher than the NPS treatment and the control. The total N in all treated soils was 0·013–0·014 g/kg, with treatments CO, CM and SS being in the higher region of this interval (Table 3). Amendment with SS resulted in the highest soil content of P-AL (0·52 mg/kg); which was significantly higher than the all other treatments. All organic treatments resulted in higher K-AL compared with NPS and control with CM displaying the highest value.
Soil microbial effects
All organic treatments generated higher SIR than the control (Table 3). In addition, amendment with BR and PM resulted in significantly higher SIR of the soil compared to CO and SS. The B-resp, however, was significantly lower in the BR and SS treatments compared with the other treatments.
The specific growth rate of micro-organisms (μSIR) was similar in all treatments, except for NPS where it was slightly but significantly lower (Table 3). The proportion of active micro-organisms was significantly lower in the CM treatment and in the control while the proportion of dormant micro-organisms was significantly higher in PM compared with CO and SS, and all organic amendments were significantly higher compared with NPS and the control.
Amendment with CO and SS, but also PM, resulted in significantly higher PDA compared with the NPS treatment and control, whereas the enzymes reflecting growth of denitrifiers (μPDA) showed no significant differences (Table 3). All organic amendments except for SS significantly increased the PAO, whereas NPS significantly decreased it relative to the control. The N-min capacity was significantly increased by all amendments compared with the control with treatments SS and CM being significantly higher than the other organic treatments.
The T-RFLP community profiles generated by restriction digestion with HaeIII produced more distinguishable TRFs compared to profiles produced with the other enzymes (i.e. HhaI and MspI), suggesting that HaeIII yields the highest resolution in the present survey. The HaeIII generated profiles were therefore used to characterize microbial populations and to link sequences to corresponding TRFs. Although a few distinct peaks could be identified for PM and CM, the T-RFLP profiles of 16S rRNA genes from soil bacterial communities showed only small variations between the different treatments.
DISCUSSION
The soil was analysed for chemical, physical and microbiological properties before the start of the experiment (Odlare et al. Reference Odlare, Svensson and Pell2005, Reference Odlare, Pell and Svensson2008). The results generally had small coefficients of variance, indicating a low spatial variation at the experimental site. Therefore, it was unlikely that intrinsic variation would obscure any effects of the treatments. The mean clay content of the experimental field was 0·42 of the total. Prior to the start of the experiment the mean values of B-resp and SIR in all plots were 0·9 and 13·4 μg CO2-C/g dw/h, respectively, and PDA was 9·1 ng N2O-N/g dw/min (Odlare et al. Reference Odlare, Pell and Svensson2008). These activities are medium to high in comparison to a published survey of 52 Swedish arable soils of wide origin (Stenberg et al. Reference Stenberg, Johansson, Pell, Sjödahl-Svensson, Stenström and Torstensson1998). In contrast, the rates of PAO, 2·9 ng NO2−-N/g dw/min, and N-min, 24·4 μg NH4+-N/g dw/10 d were lower than the mean values of the 52 Swedish soils. Stenberg et al. (Reference Stenberg, Johansson, Pell, Sjödahl-Svensson, Stenström and Torstensson1998), in a spatial survey of chemical and microbiological properties of a single arable field with clay soil, concluded that the variation in the small scale may be as large as that of the larger scale of 52 soils scattered over a wide part of Sweden. From the above it can be concluded that the results from the present study should be applicable to a large proportion of Swedish soils.
The crop
The present data refer to the barley crop yield. Oat yields on the same plots up to 2002 are presented in Svensson et al. (Reference Svensson, Odlare and Pell2004). After 8 years of treatments, there were only small differences in crop yield between plots treated with any of the fertilizers (Fig. 1). These results indicate that BR, SS and CM, used in combination with mineral N, performed equally well as sole NPS. On a long-term basis, the organic fertilizers may be even more beneficial to the crop as nutrients bound to organic material are released slowly; however, resulting differences in crop yield may be difficult to detect. This agrees with previous results such as those of Miller & Miller (Reference Miller, Miller and Sumner2000), who highlighted that application of organic material to agriculture may affect soil properties, but those effects generally may not appear within the short-term. Nevertheless, over 8 years the organic wastes performed as well as NPS, but the full potential agronomic value may not be revealed for another few years. Biogas residue contains relatively large amounts of mineral N (particularly ammonium), which is likely to have a positive effect on yield. Biogas residue has previously been reported to be beneficial for plant yield (Montemurro et al. Reference Montemurro, Canali, Convertini, Ferri, Tittarelli and Vitti2008; Odlare et al. Reference Odlare, Pell and Svensson2008) due to the relatively high content of mineral N and easily degradable carbon. However, SS, which contained smaller amounts of mineral N, generated equally high yield. SS has previously been shown to increase crop yield (Sing & Agrawal Reference Singh and Agrawal2010), but it has also been argued that the low concentrations of potassium in SS may not meet plant requirements (Warman & Termeer Reference Warman and Termeer2005).
Soil chemical properties
The results after 8 years showed a small but statistically significant increase in organic carbon as a result of organic amendments. The total N had also increased by the addition of CO, CM and SS. The treatment effects between the organic residues and NPS was small despite the fact that the total dry weight of applied organic C and the proportion of organic N to mineral N differed substantially. Several studies have reported an increased C pool due to application of organic wastes (Habteselassie et al. Reference Habteselassie, Miller, Thacker, Stark and Norton2006; Montemurro et al. Reference Montemurro, Maiorana, Convertini and Ferri2006; Cherif et al. Reference Cherif, Ayari, Ouzari, Marzorati, Brusetti, Jedidi, Hassen and Daffonchio2009), whereas others argue that several years of application are not enough to restore the C depleted by continual cultivation (Saviozzi et al. Reference Saviozzi, Biasci, Riffaldi and Levi-Minzi1999). Most micro-organisms convert organic N into inorganic forms by mineralization. A C:N ratio <30 in organic fertilizer is usually taken to indicate a net mineralization of N in the soil (Kaye & Hart Reference Kaye and Hart1997). The C:N ratios were 4·06–14·8 in all the organic amendments used in the present field experiment, which suggested that the organic N would be partially mineralized to ammonium. During decomposition of C-rich material the C:N ratio will decrease until it has the same value as that of the microbes, which can be assumed to be 4–12 (Janssen Reference Janssen1996; Kaye & Hart Reference Kaye and Hart1997). However, N-min is also dependent on the ease and speed with which the substrate is decomposed. The lack of prominent differences in Tot-N in the soil between the different treatments may be explained by the fact that mineralized ammonium has several possible fates in soil. It may be taken up by plants, be subject to nitrification, be subject to leaching or become fixed in the lattice of clay minerals.
Despite a relatively low P-AL content in the applied SS it generated a significantly higher P-AL content in the soil compared with the other treatments. This was expected, as most SS contains relatively large amounts of P due to chemical precipitation of this element as part of the sewage treatment process. Several other studies have reported increases in soil P after application of SS (Siddique & Robinson Reference Siddique and Robinson2003; Bañuelos et al. Reference Bañuelos, Sharmasarkar and Pasakdee2004; Mantovi et al. Reference Mantovi, Baldoni and Toderi2005). Unlike organic carbon, which can be respired as CO2, macronutrients such as P that are present in organic chemicals may be converted into inorganic forms and assimilated into the microbial biomass. The C:P ratio of an added material determines the extent to which inorganic P is either mineralized or immobilized. The C:P ratio of SS was 8:8, lower than the ratios for all the other organic fertilizers, meaning that SS provides an excess of P to micro-organisms. This explains why P-AL is highest in the SS treatment.
The results of the present study indicate that 8 years is still too short a time for a significant build-up of most chemical compounds in the soil.
Soil microbiological properties
The higher SIR in the soil was as a result of the organic amendments, especially BR and PM, compared with NPS fertilization and the control, reflecting the C content in the organic fertilizers. The majority of the microbial populations in the soil are heterotrophs or organotrophs and are therefore dependent on the availability of organic C. This means that fertilizers containing large amounts of organic C should support a larger biomass and therefore affect respiration parameters. The present results are in agreement with other studies such as Nyberg et al. (Reference Nyberg, Sundh, Johansson and Schnürer2004), who found that BR increased SIR. The low B-resp rate in the SS treatment may be due to the relatively high concentrations of heavy metals in the sludge, especially Cu. Negative effects of heavy metal content in sludge have been reported previously (Khan & Scullion Reference Khan and Scullion1999; Moreno et al. Reference Moreno, Hernández, Perez and Garcia2002). The low B-resp in the BR treatment was probably due to the low content of organic C in this residue. Measurements of enzyme activity reflecting growing micro-organisms (μSIR) were equally high for all treatments except NPS, probably because no organic material is added in the NPS treatment.
In the present study, the metabolic quotient (qCO2) was evaluated together with the proportion of active micro-organisms, a parameter that describes similar microbial characteristics. The qCO2 was low in all treatments (7·2–8·2%) and the proportion of active micro-organisms in the soil was generally low, in particular for the CM treatment. One probable explanation for these low values is that soil samples were taken c. 4 weeks after harvest, when most active micro-organisms may have transitioned back to a dormant state. By this stage the most easily available C remaining after harvest had been consumed. Biogas residue and NPS increased the proportion of active micro-organism compared to the other fertilizers. This is likely to be an effect of increased crop biomass production. Although not statistically significant, the crop yield was slightly higher for NPS than the other fertilizers. A larger crop would generate a larger root system, which in turn supplies the soil microbes with root exudates such as sugars and amino acids, and cellulosic material from sloughed off cells and dead roots (Valé et al. Reference Valé, Nguyen, Dambrine and Dupouey2005). Easily available C has previously been shown to increase the proportion of active micro-organisms (Stenström et al. Reference Stenström, Svensson and Johansson2001). The present results suggest that it may be difficult to distinguish between direct and indirect effects of different amendments, since increased microbial activity may depend on the fertilizer itself or on increased plant growth. Nevertheless, several authors have shown that direct microbiological effects of the organic waste can be detected (Ros et al. Reference Ros, Klammer, Knapp, Aichberger and Insam2006; Kaur et al. Reference Kaur, Brar and Dhillon2008). The proportion of dormant micro-organisms in the soil was similar for all organic fertilizers. This group of micro-organisms is characterized by a slower metabolism, able to obtain energy from more stable organic matter. Therefore, they do not respond to the different C availability in the different treatments as directly as the active micro-organisms.
The PDA was higher in the CO, SS, PM and BR treatments than in the control. Most denitrifiers are organotrophs and bacteria involved in denitrification, which usually respond quickly to the presence of easily degradable C (de Cantanzaro & Beauchamp Reference De Cantanzaro and Beauchamp1985). However, as they are facultative anaerobes, low oxygen (O2) levels stimulate bacterial production and activation of denitrifying enzymes. Intense aerobic respiration therefore successively lowers the partial pressure of oxygen, thus stimulating anaerobic denitrification activity.
The organic amendments increased the PAO rate, whereas NPS decreased it relative to the control. In contrast to the organic C-dependent respiration and denitrification, autotrophic nitrifiers are fully dependent on available NH3 and pH. The NPS contained smaller amounts of NH4+ which probably led to a lower biomass of the ammonium oxidizing bacteria. Compost also generated a high PAO, despite its low NH4+ content. One explanation for this could be that organically bound N in the CO was mineralized, so that NH3, the actual substrate, became available to the nitrifiers. In addition, increased pH usually stimulates nitrification. Although the pH was not statistically higher in the CO treatment compared to the other organic treatments, the increase in PAO may still be related to pH. Compost is known to increase pH in the soil, and despite the fact that the C treatment did not cause an overall pH increase in the soil, micro-sites containing CO particles may form ‘hot-spots’ of higher pH. Populations of nitrifying bacteria at these sites may respond to elevated pH by enzyme production and growth (Tyson et al. Reference Tyson, Simonne, Davis, Lamb, White and Treadwell2007).
The significantly higher N-min capacity caused by the amendments with SS and CM treatments was probably a result of the relatively larger amounts of organic N in these residues. In addition, the C:N-ratio was lowest in the BR, followed by PM and SS. If the fertilizer contains a lower proportion of N than is required by the micro-organism, net mineralization and N release occurs. The rates of N-min did not fully correspond to the C:N-ratios of the amendment. However, all amendments had relatively small C:N-ratios. Together with soil respiration, potentially mineralizable N is the most commonly suggested biological soil indicator for assessing soil quality (Wienhold et al. Reference Wienhold, Andrews and Karlen2004). The reason for its usefulness is two-fold: (1) it may serve as a general indicator of the soil ecosystem status, since most micro-organisms have at least some capacity to mineralize N, and (2) it gives an estimate of the N availability to the plants. The present results showed that, compared to the control, all the organic wastes increased N-min and should therefore be beneficial to microbial activity in the soil.
The structure of the soil bacterial community appears to be fairly resistant to changes caused by addition of organic fertilizers. However, one should keep in mind that only the most dominant bacterial populations within each treatment were analysed, and thus the analyses in the present paper do not give a representative picture of the entire soil bacterial communities (Liu et al. Reference Liu, Marsh, Cheng and Forney1997). The dominant members of a microbial community do not necessarily represent the members that are metabolically active or the most functionally important within that specific habitat. Consequently, it would be interesting to target populations based on additional physiological properties. The fact that the bacterial populations seem to be quite stable in soil, irrespective of the type of amendment added, could be an advantage considering the involvement of the bacteria in larger ecosystem function.
A multivariate approach
In the evaluation of a field experiment there are numerous factors that may interfere with the results to varying degrees. Uncontrollable factors such as precipitation and temperature fluctuations, and cropping measures and sampling procedures may mask the effects of different treatments. A PCA can provide information about relationships between the variables and can therefore be used to interpret groups of objects with similar characteristics and may therefore reveal underlying structures in the data that may not be shown by descriptive statistics or one-way ANOVA.
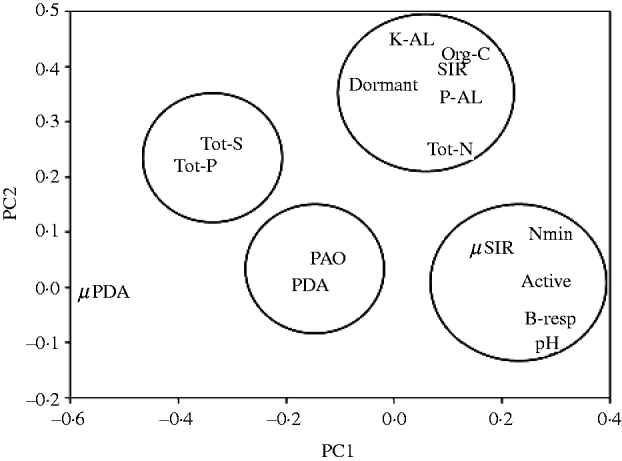
Variables located close to each other in the PCA are likely to be correlated to each other and can be expected to respond similarly to the treatments. In the present study four distinct groups can be identified in the PCA plot, although they are not easily explained (Fig. 2). In the first group, Tot-S and Tot-P are close to each other, which were expected as they did not appear to respond to any of the treatments. The PAO and PDA made up a group on their own. These two bacterial groups, which have divergent responses to O2 and organic material, are connected in that the product of nitrification, NO3−, is the terminal electron acceptor in denitrification. The third group, located at the top right part of the plot, describes a close relation between soil chemical nutrients (Org-C, Tot-N, P-AL and K-AL) and SIR, which can be considered a biomass index since the results of SIR can be converted into soil microbial biomass. In the bottom right corner there is a fourth group comprising μSIR, N-min, B-resp, pH and active micro-organisms. Of these, μSIR and active micro-organisms represent a part of the soil microbial biomass responding quickly to addition of easily available C by growing. In addition, the two latter groups have components of more basic microbial functions (dormant micro-organisms and B-resp, respectively. This pattern is interesting as it illustrates the combined effect of all treatments on all variables.
Component 1 (PC1) v. component 2 (PC2) in a PCA of all chemical and microbiological soil variables. Explanation levels for PC1 and PC2 were 27 and 21%, respectively.
The main conclusions of the present work are that treatments with organic residues combined with mineral fertilizer resulted in equally high yields as treatments with conventional fertilizers. Residues from biological treatment of organic wastes should therefore be able to replace a part of the conventional fertilizer in an agricultural system. Except for a slight decrease in B-resp induced by SS and BR, the organic residues had no negative effects on the variables analysed. Organic residues from biological treatment of household waste, and probably also from municipal wastewater treatment, should be considered as effective soil improvers and fertilizers. The microbiological activity of the soil responded more rapidly than the bacterial community structure and the chemical properties to changes in the soil environment and, may therefore be useful indicators to evaluate the effects of organic wastes as fertilizers.
The work was funded by The Knowledge Foundation (KK-stiftelsen) in Sweden and the Solid-Waste Company of Västmanland (VAFAB).