

Introduction
Rate of organic matter exported from surface waters in the Southern Ocean removes CO2 from the atmosphere, thereby influencing the atmospheric CO2 concentrations. Over the seasonal scale, carbon export can be approximated by net community production (NCP) (rate of organic carbon production in excess of respiration). In the Southern Ocean, the distribution of NCP is characterized by large spatial variability (Karl et al. Reference Karl, Tilbrook and Tien1991, Bates et al. Reference Bates, Hansell, Carlson and Gordo1998, Rubin et al. Reference Rubin, Takahashi, Chipman and Goddard1998, Ishii et al. Reference Ishii, Inoue, Matsueda and Tanoue1998, Reference Ishii, Inoue and Matsueda2002, Cassar et al. Reference Cassar, Bender, Barnett, Fan, Moxim, Levy II and Tilbrook2007, Hoppema et al. Reference Hoppema, Middag, De Baar, Fahrbach, van Weerlee and Thomas2007). While the Southern Ocean is the largest high nutrient, low chlorophyll (HNLC) region in the global ocean, high marine productivity does occur during the summer near frontal systems, downstream of islands and over shallow topography in the Antarctic Circumpolar Current (Sullivan et al. Reference Sullivan, Arrigo, McClain, Comiso and Firestone1993, Moore & Abbott Reference Moore and Abbott2002, Tyrrell et al. Reference Tyrrell, Merico, Waniek, Wong, Metzl and Whitney2005).
The Kerguelen Ocean and Plateau compared Study (KEOPS, January–February 2005) aimed to compare the high productive area localized over the Kerguelen plateau with the surrounding HNLC waters (Fig. 1). The bloom over the Kerguelen plateau was sustained by an increased supply of iron and major nutrients (Blain et al. Reference Blain, Quéguiner, Armand, Belviso, Bombled, Bopp, Bowie, Brunet, Brusaard, Carlotti, Christaki, Corbière, Durand, Ebersbach, Fuda, Garcia, Gerringa, Griffiths, Guigue, Guillerm, Jacquet, Jeandel, Laan, Lefèvre, Monaco, Malits, Mosseri, Obernosterer, Park, Picheral, Pondaven, Remenyi, Sandroni, Thuiller, Timmermans, Trull, Uitz, van Beek, Veldhuis, Vincent, Viollier, Vong and Wagener2007). The core of the bloom was characterized by low sea surface CO2 fugacity in seawater (fCO2 < 320 μatm), representing a large CO2 sink for the atmosphere (ΔfCO2 = -50 μatm) and is in contrast with the near equilibrium conditions observed outside the bloom. The NCP, derived from a seasonal budget of dissolved inorganic carbon (DIC) (Jouandet et al. Reference Jouandet, Blain, Metzl, Trull and Obernosterer2008) was roughly three times higher in the core of the bloom (6.6 ± 2.2 mol m-2) than outside (1.9 ± 0.4 mol m-2) and similar to the NCP in other productive areas of the Southern Ocean (Karl et al. Reference Karl, Tilbrook and Tien1991, Ishii et al. Reference Ishii, Inoue, Matsueda and Tanoue1998, Sweeney et al. Reference Sweeney, Smith, Hales, Bidigare, Carlson, Codispoti, Gordon, Hansell, Millero, Park and Takashi2000).
Distribution of chl a over the Kerguelen plateau during the KEOPS cruise, as estimated by satellite remote sensing. A black square delimits the core of the bloom. A white line represents the KEOPS cruise track (January–February 2005).

In this study we combined new field observations collected during three successive summers (2005–07) that include remote sensed chlorophyll, temperature and wind (1997–2007) data and a two-box biogeochemical model to explore the impact of the interannual variability of the bloom, specifically its duration and timing, on the magnitude of the NCP. We also investigated the effect of biology and temperature interannual variability on the CO2 sink (ΔFatm) over the 1997–2007 period.
Materials and methods
Computational method to simulate NCP and fCO2
For the bloom duration defined as the period with chlorophyll a (chl a) > 0.3 mg m-3 (Table I), the seasonal NCP and integrated air-sea CO2 flux (ΔFatm) were computed, as follow:


where (δDIC/δt)bio is the daily variation of DIC due to the biological activity in the mixed layer (ML), k0 is the solubility (Weiss Reference Weiss1974) and k the gas exchange coefficient. The air-sea gas exchange process sensitivity to k was tested using different parameterizations (Wanninkhof et al. Reference Wanninkhof1992, Nightingale et al. Reference Nightingale, Malin, Law, Watson, Liss, Liddicoat, Boutin and Upstill-Goddad2000, Ho et al. Reference Ho, Law, Smith, Schlosser, Harvey and Hill2006). The interannual variability of ΔFatm did not change according to the k parameterization. We present here results using the Ho et al. (Reference Ho, Law, Smith, Schlosser, Harvey and Hill2006) parameterization, determined for the Southern Ocean. Atmospheric fCO2 (fCO2air) was estimated using the atmospheric CO2 concentrations from the OISO (Ocean Indian Service Observation) records compiled in the south Indian Ocean region since 1998 (Metzl Reference Metzl2009). (δDIC/δt)bio and fCO2sea seasonal cycles were simulated using a new version of the 1D biogeochemical model previously described in details in Louanchi et al. (Reference Louanchi, Metzl and Poisson1996) and Jabaud-Jan et al. (Reference Jabaud-Jan, Metzl, Brunet, Poisson and Schauer2004). The initial model independently took into account four processes that control the seasonal variations of fCO2 in the surface waters: the air-sea CO2 exchange, the thermodynamics (solubility), the biological activity and vertical mixing (entrainment) between surface and subsurface waters.
Comparison of the bloom characteristics (duration, starting date, magnitude). The bloom duration is defined as the period when the chl a concentrations were above 0.3 mg m-3. The beginning of the cycle is on 1 October for all years.

This model was applied and adapted to the Kerguelen bloom by adding turbulent vertical mixing processes, and changing the biogeochemical module. The silicic acid limitation pointed out by Mosseri et al. (Reference Mosseri, Queguiner, Armand and Cornet-Barthau2008) in the studied region was taken into account. (δDIC/δt)bio was then derived from the Si(OH)4 variation due to the biological activity (δSi/δt)bio, using the ratio of biogenic silica (BSi) vs particulate organic carbon (POC) in the organic matter (RρPOC/ρBSi) and a respiration coefficient (Rresp):

(δSi/δt)bio was computed from chl a changes (δchl a) using the silicon uptake kinetic parameters (KSi(OH)4, μmax) and the ratio BSi/chl a (RBSi/chla):

All parameters (Rresp, RρPOC/ρBSi, KSi(OH)4, μmax, RBSi/chla) were constant through the seasons (Table II). This assumption is discussed later. The first step of the model implementation was to constrain KSi(OH)4, μmax, RBSi/chla to reproduce the low Si(OH)4 concentration measured in January 2005, during KEOPS. RBSi/chla and KSi(OH)4 were fixed to the extreme values (Table II) measured for the largest size fraction, which dominated the composition of the phytoplankton bloom (Mosseri et al. Reference Mosseri, Queguiner, Armand and Cornet-Barthau2008). The maximum growth rate, which was the most sensitive parameter of the model, was μmax = 0.45 d-1, and was higher than the measured values (Mosseri et al. Reference Mosseri, Queguiner, Armand and Cornet-Barthau2008) but still lower than values used in previous models for the Southern Ocean (Pondaven et al. Reference Pondaven, Ruiz-Pino, Fravalo, Treguer and Jeandel2000, Fasham et al. Reference Fasham, Flynn, Pondaven, Anderson and Boyd2006). RρPOC/ρBSi was fixed using a Rresp = 0.45 (Obernosterer et al. Reference Obernosterer, Christaki, Lefevre, Catala, van Wambeke and Lebaron2008). RρPOC/ρBSi was then fixed to 5.2, which is in the range of experimental values (Mosseri et al. Reference Mosseri, Queguiner, Armand and Cornet-Barthau2008) and lower than the usual ratio BSi/C of Brzezinski (Reference Brzezinski1985).
Parameters used to constrain the model for all the simulations.
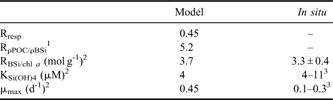
1Obernosterer et al. 2008
2Mosseri et al. 2008
3kinetic parameters of the largest size fraction (> 10 μm) which dominated the phytoplankton composition of the bloom
This set of parameters was then able to simulate NCP derived from the DIC seasonal budget for the 2004–05 bloom (NCPcal = 6.6 ± 2.2 mol m-2; Jouandet et al. Reference Jouandet, Blain, Metzl, Trull and Obernosterer2008).
At each time increment (one day) the model also evaluates total alkalinity (TA), and sea surface fCO2 is computed from DIC and TA. As interannual variability of both sea surface salinity (SSS) and TA is low in this region, we used the same SSS and TA/SSS relations as in previous studies (Jabaud-Jan et al. Reference Jabaud-Jan, Metzl, Brunet, Poisson and Schauer2004, Metzl et al. Reference Metzl, Brunet, Jabaud-Jan, Poisson and Schauer2006).
The model was constrained with weekly (rather than monthly as in the original version) sea surface temperature (SST), chl a and sea surface wind speed (SSW) to take into account episodic peaks of productivity as seen in the SeaWIFS chl a cycles (Fig. 2a) as well as large SST anomalies (Fig. 2b). Chlorophyll a and SST were averaged over eight days periods, in a 51 ± 1°S by 72.6 ± 1.0°E area, which represented the core of the bloom south-east of the Iles Kerguelen (Fig. 1). Chlorophyll a constrains were provided by the SeaWiFS Project, NASA/Goddard Space Flight Center and GeoEye (http://oceancolor.gsfc.nasa.gov/cgi/l3, accessed October 2007) and AVHRR SST data (ftp://podaac.jpl.nasa.gov/pub/sea_surface_temperature/avhrr/pathfinder/data_v5/8day, accessed October 2007) both with a 9 km resolution. Sea surface wind speed was derived from the CERSAT products (ftp://ftp.ifremer.fr/ifremer/cersat/products/gridded/mwf-quikscat/data/weekly/, accessed October 2007). The seasonal variation of the mixed layer depth (MLD) follows Metzl et al. (Reference Metzl, Brunet, Jabaud-Jan, Poisson and Schauer2006). The MLD cycle (Fig. 3) is in agreement with the MLD of 70 ± 20 m based on density criteria (mean value of the 40 conductivity, temperature, depth profiles; Jouandet et al. Reference Jouandet, Blain, Metzl, Trull and Obernosterer2008) and a residual winter layer of 210 m (depth of the minimum temperature) measured during KEOPS in January 2005.
Temporal variations of a. chl a, and b. sea surface temperature (SST) from the 1 October 1997 until the 1 October 2007, in the core of the bloom over the Kerguelen plateau. Chlorophyll a and SST were averaged for periods of eight days, in the area of 51 ± 1°S by 72.6 ± 1.0°E (this is representative of the core of the bloom south-east of the Iles Kerguelen). Red lines denote the seasonal climatology.

Initial conditions were the concentrations measured at the depth of minimum temperature of the reference station (50°38′S, 72°05′E) located in the core of the bloom (DICwinter = 2170 μmol kg-1 and Si(OH)4winter = 27 μmol kg-1; Jouandet et al. Reference Jouandet, Blain, Metzl, Trull and Obernosterer2008). The simulation started on 1 October and ran for one year, thus, hereafter a year is from 1 October of the year n until 1 October of the year n + 1.
Interannual variability of chl a concentrations and SST during 1997–2007
Results show strong interannual variability in both the dynamic (duration and timing) and the magnitude (intensity of the peaks) of the bloom (Table I, Fig. 2a). The longest blooms were observed during the 1998–99, 1999–2000 and 2002–03 years with an average duration of 165 ± 2 days. The shortest blooms were in 2003–04 and 2006–07 (duration of 120 days). In 1999–2000 and 2002–03, the spring bloom started 3–4 weeks earlier (last week of October) than other years. All blooms were characterized by two peaks in chl a. The first peak occurred in the second half of November (17 November–2 December) in the years 1997–98, 1999–2000, 2002–03 and 2004–05, and one month later (19–31 December) in 2000–01, 2001–02 and 2003–04. In 1998–99 the first peak occurred in early January. The timing of the second peak likewise displayed also large variability occurring from mid-December in 1999–2000 to mid-February in 1998–99. The most intense bloom was recorded in 2005–06 when chl a reached 4 and 2.35 mg m-3, successively. This is more than 1.5 fold higher than in 1997–98, 1999–2000, 2003–04 and 2004–05.
The SST (1997–2007) variations are shown in Fig. 2b. Sea surface temperatures ranged from 1.4 ± 0.4°C in early October to 3.8 ± 0.4°C at the end of March. The coolest summer occurred in 1998–2000, and the warmest in 2001–04. While is it clear that chl a and SST displayed significant interanual variability, no clear decadal trends appeared (Fig. 2) as discussed for the Indian sector of the Southern Ocean by Metzl et al. (Reference Metzl, Brunet, Jabaud-Jan, Poisson and Schauer2006).
Results and discussion
Comparison of the Si(OH) 4 and DIC as well as fCO2 simulations with field data over the 2005–08 period
The model was run using the chl a, SST (Fig. 2) and SSW over the 2005–08 period. Results were compared with the Si(OH)4, DIC, fCO2 measurements made in January 2006 and 2007 during the OISO cruises. Simulations on the date of the measurements and for the whole corresponding month (e.g. January) are shown in Table III.
Comparison between seasonal observed and simulated biogeochemical properties in surface waters. Numbers in italic indicate simulated values obtained using the 1D biogeochemical model at the date of measurements. The range of each simulated parameter for January is given in brackets.

The range of DIC and fCO2 simulated in January 2007 agree well with the observations, while those simulated in January 2006 slightly (-5%) underestimate field data from January 2006. Most of the differences between the simulated and experimental concentrations were related with Si(OH)4 concentrations. Si(OH)4 concentrations in January 2006 were reproduced by the model while experimental Si(OH)4 concentration was twofold higher in January 2007. Keeping in mind that the bloom was dominated by diatoms, this high Si(OH)4 concentration was unexpected and could not be reproduced by the model.
In the carbonate system, the low interannual variability (relative standard deviation (rsd)) of the observed DIC (rsd = ± 0.3%) and fCO2 (rsd = ± 1%) was reproduced by the model (rsd = ± 0.3%, rsd = ± 1%).
The simulated seasonal NCP was 8.4 mol m-2 for the seasons 2005–06 and 2006–07. The seasonal NCP were also calculated from a carbon budget (NCPcal) according to the method described in Jouandet et al. (Reference Jouandet, Blain, Metzl, Trull and Obernosterer2008), using a MLD of 70 ± 20 m and Kz = 3.10-4 m2 s-1 and DIC, Si(OH)4 profiles taken during OISO cruises. NCPcal were 6.3 ± 2.5 mol m-2 and 6.4 ± 2.6 mol m-2 for the 2005–06 and 2006–07 blooms, respectively. Simulated NCP were within the range of calculated NCP and were characterized by the same interannual variability. The model could then be used to investigate the interannual variability of NCP and ΔFatm over longer periods.
Interannual variability of NCP and ΔFatm during 1997–2007
The model was applied to explore the interannual variability of NCP and ΔFatm, during the 1997–2007 period, using chl a, SST (Fig. 2) and SSW. The seasonal variation of the MLD from Metzl et al. (Reference Metzl, Brunet, Jabaud-Jan, Poisson and Schauer2006) was applied each year. This assumption is discussed later.
During the 1997–2007 period, the seasonal NCP varied between 7.3 mol m-2 (2003–04) and 10.8 mol m-2 (2002–03) with a mean value of 8.5 ± 1.2 mol m-2 (Fig. 4). The interannual variability of the NCP was low (rsd = ± 14%) compared with the interannual variability of the bloom magnitude (rsd = ± 88%). Moreover NCP maxima were not associated with bloom intensity maxima. For example, the NCP was lower in 2005–06 than in 1999–2000, while chl a peaks were twofold higher in 2005–06 than in 1999–2000 (Fig. 4, Table III). This comparison highlights the importance of the duration rather than the magnitude of the bloom. This may partly explain the high NCP in 1999–2000 and the low interannual variability of the NCP over the 1997–2007 decade. The highest NCP simulated in 1999–2000 may also result from the effect of the MLD on the calculation. The first chl a peak (leading to high (δDIC/δt)bio) for the 1999–2000 bloom occurred in November when the mixed layer was deep, while the first chl a peak for the 2005–06 bloom (leading to high (δDIC/δt)bio) occurred in January when the mixed layer was shallow (Table I, Fig. 3). Net community production was maximal for the earliest bloom because high (δDIC/δt)bio were associated with deep mixed layers. Nevertheless this hypothesis should be viewed with caution because the start of the bloom is expected to be dependant on the depth of the mixed layer.
Seasonal evolution of the mixed layer depth (MLD) (from Metzl et al. Reference Metzl, Brunet, Jabaud-Jan, Poisson and Schauer2006) and the simulated (δDIC)bio for the 1999–2000 and 2005–06 blooms.

Interannual variability of seasonal net community production (NCP) and ΔFatm during the period 1997–2007. ΔFatm was also calculated with fixed atmospheric fCO2 concentration (363.2 ppm in 1998) and is called ΔFatm*.

The interplay between the start of the bloom and the MLD as well as the sensitivity of the model to the MLD were investigated using MLD simulated by the Regional Ocean Model system (ROMS) for the 2000–05 period (Fig. 5). The simulated MLD was deeper (+40 m) than the MLD from Metzl et al. (Reference Metzl, Brunet, Jabaud-Jan, Poisson and Schauer2006) and the MLD estimated during KEOPS. This difference was mainly due to the boundary conditions in the model derived from the coarse resolution Global Ocean Circulation Model OGCMs (Carton et al. Reference Carton, Giese and Grodsky2005) which does not well represent the temperature minimum characteristic of waters south of the Polar Front accurately. The simulated MLD could only be used to investigate qualitatively the interannual variability of the NCP. The timing of the stratification of the ML in 2000–01, 2001–02 and 2004–05, was similar to that of the reference MLD cycle (MLD from Metzl et al. (Reference Metzl, Brunet, Jabaud-Jan, Poisson and Schauer2006)). But in 2002–03 an early bloom was observed and the stratification started earlier also. This observation argues against our proposed explanation that early blooms provide a large contribution to seasonal NCP due to a deep MLD. However, in 2003–04 earlier stratification did not correspond to an early bloom and no general trend could be drawn. The interannual variability of the solar radiation flux (http://www.esrl.noaa.gov/psd/cgi-bin/db_search/DBSearch.pl?Variable=Downward+Solar+Radiation+Flux&group=0&submit=Search, accessed October 2007) was investigated as an alternative explanation and is shown in Fig. 6. The low interannual variability of the flux did not explain the interannual variability of the start of the bloom either.
a.–e. Evolution of the reference mixed layer depth (MLD) simulated using ROMS (grey line) for 2000–05. The reference MLD (from Metzl et al. (Reference Metzl, Brunet, Jabaud-Jan, Poisson and Schauer2006)) is shown (black line) for all seasons. f. The net community production (NCP) was computed using these ML and a new parametrization (μmax = 1 d-1).

Seasonal evolution of the solar flux for the 2001–05 period.

Therefore new field studies or improved modelling of the variability of the MLD above the Kerguelen plateau are needed to further address our hypothesis. Interestingly our conclusion that the interannual variability of seasonal NCP is low compared to the high interanual variability of the chl a remains valid when varying MLD annual cycles were used in the model (Fig. 5f).
The low interannual variability of simulated NCP could also result from parameterization of the model which does not take into account changes of the kinetics parameters due to shifts in structure of the phytoplankton community. A lack of data on the interannual variability of the phytoplankton community however does not allow us to overcome this limit.
During the 1997–2007 summers, this region acted as a net sink for atmospheric CO2 with seasonal ΔFatm values between -2.7 and -1.7 mol m-2 (Fig. 3). A large CO2 uptake was observed for the highest NCP (i.e. 1999–2000 and 2002–03 blooms). At the seasonal scale ΔFatm was better correlated with the biological effect rather than thermodynamic effect (Fig. 7b). By contrast, over an interannual timescale most of the ΔFatm variability results from the interannual variability of Δ(δfCO2) due to temperature changes (Δ(δfCO2)therm) (Fig. 7a). The comparison between the blooms of 1999–2000 and 2002–03 illustrate this pattern.
a. Evolution of processes responsible for CO2 fugacity (fCO2) changes from the bloom season 1998–99 to 2006–07. b. ΔFatm as a function of integrated fCO2 changes due to the biological activity (Δ(fCO2)bio) and temperature effect (Δ(δfCO2)therm).

The effect of air-sea CO2 solubility on ΔFatm is demonstrated when comparing Fatm simulated in 1999–2000 with Fatm simulated in 2002–03 while keeping the atmospheric CO2 at a constant xCO2 of 363.2 ppm in 1998 (Fig. 8). Bloom characteristics (i.e. duration, timing and magnitude) were similar for both seasons allowing the separation of the SST effect from the biological effect on the ΔFatm flux. ΔFatm and (δDIC)bio integrated from the start of the bloom to the end of January were similar for both years (1.5 mol m-2 and 78 mmol m-3 respectively) while SST was higher in 2002–03 (Fig. 8). This comparison highlights the control of Fatm by the biological activity during this period. By contrast, large difference of Fatm was simulated during the decline of the bloom (from February–April), due to the effect of solubility. Sea surface temperatures were higher (up to 1.7°C) in 2002–03 than in 1999–2000, leading to a higher fCO2 in the mixed layer and a Fatm 16% lower in 2002–03. This scenario emphasizes the role of temperature as the fundamental factor controlling the air-sea CO2 exchanges at the seasonal scale, in this productive area.
Daily evolution of a. Fatm, b. sea surface temperature (SST), and c. biological consumption of dissolved inorganic carbon (DIC) for 1999–2000 and 2002–03. The climatology was computed as an average of all seasons.

Conclusion
Our analysis of the interannual variability of the Kerguelen plateau bloom emphasizes the possible importance of the duration and the early start of the bloom in controlling the magnitude of the seasonal NCP. This is a key result as sea surface warming, stratification and duration of the blooms are expected to change in the future as a consequence of climate change (Bopp et al. Reference Bopp, Monfray, Aumont, Dufresne, Le Treut, Madec, Terray and Orr2001). Previous studies in typical HNLC waters of the Permanent Open Ocean Zone have shown that when the ocean is warmer, biological activity dominates the thermodynamic effect leading to a stronger summer ocean CO2 sink (Jabaud-Jan et al. Reference Jabaud-Jan, Metzl, Brunet, Poisson and Schauer2004, Brévière et al. Reference Brévière, Metzl, Poisson and Tilbrook2006). By contrast, our analysis conducted in the highly productive region of the Kerguelen plateau, shows that the CO2 sink is governed by a complex interplay of thermodynamics and biological activity and presents relatively low variability over ten years. Given the high variability of the chl a maximum in the Kerguelen plateau region the small changes in NCP and air-sea CO2 fluxes were not expected. These results highlight the importance of investigating in more detail the coupling between warming/cooling and biological activity in order to better evaluate the impact of climate change on the Southern Ocean CO2 sink.
Acknowledgements
Thanks to the Kerguelen Ocean and Plateau Compared Study (KEOPS) and the Ocean Indian Service Observation (OISO) shipboard science team and the officers and crew of RV Marion Dufresne for their efforts. The OISO program is supported by INSU, IPEV and Institut Pierre Simon Laplace (IPSL). We also thank two anonymous referees for their valuable comments.



