Introduction
While the majority of mammalian genes are expressed from both parental genomes, a set of genes (about 100 have been identified in mammals), are transcribed exclusively either from the maternal or the paternal allele (Reik & Walter, Reference Reik and Walter2001). These imprinted genes are regulated through DNA sequences known as imprinting control regions (ICRs). These regions are methylated differentially according to their parental origin. Imprints are erased in primordial germ cells, early in fetal life and reset in a sex-specific manner during gametogenesis (Reik & Walter, Reference Reik and Walter2001). Following fertilization, a second important wave of epigenetic remodelling arises: the paternal genome is actively and globally demethylated within a few hours (Mayer et al., Reference Mayer, Niveleau and Walter2000) while the maternal genome is demethylated over a few cell cycles. Imprinted genes escape this demethylating process and maintain their sex-specific pattern of DNA methylation, in order to be expressed properly later in development (Delaval & Feil, Reference Delaval and Feil2004). The maintenance of the DNA methylation imprint during preimplantation development has been assigned to DNA methyl transferase 1 (DNMT1) (Hirasawa et al., Reference Hirasawa, Chiba and Kaneda2008). Imprinted genes are critically involved in the regulation of fetal growth, development and placental functions (Ono et al., Reference Ono, Nakamura and Inoue2006) and normal development involves the expression of imprinted genes. Previous studies have established a link between aberrant methylation imprinting and developmental failure (Young et al., Reference Young, Fernandes and McEvoy2001; Mann et al., Reference Mann, Chung and Nolen2003; Liu et al., Reference Liu, Yin and Xiong2008), particularly during late development. In assisted reproductive technology (ART) centres, some embryos are not transferred because they show abnormal developmental timing or abnormal morphology beyond the blastocyst stage. The causes of this developmental failure are largely unknown, and the quality of the imprints in these failing embryos has not yet been investigated in humans. In the present study, we have examined the methylation profile of both a maternally and a paternally imprinted control region, KvDMR1 and H19DMR respectively, that each lie on the human chromosome 11p15.5. H19DMR is methylated on the paternal allele and regulates the expression of H19 and IGF2. IGF2 plays a key role in regulating fetal growth and shows monoallelic expression from the 8-cell stage onwards (Lighten et al., Reference Lighten, Hardy and Winston1997). KvDMR1 is located in the promoter of the non-coding KCNQ1OT1 gene and is maternally methylated. KCNQ1OT1 is paternally expressed and is thought to negatively regulate the expression of several maternally expressed genes, including p57kip2, a cell cycle regulator.
Materials and methods
Source of human embryos
A total of 50 embryos derived from fertilized ICSI oocytes were donated for research by patients of Laboratoire de Biologie de la Reproduction at Hôpital Femme Mère Enfant (Bron, France), after they have given their informed consent. Protocols were approved by Agence de la Biomédecine, the French legal institution for research on human embryos. Embryos were divided into four groups according to the grading system described by Gardner et al. (Reference Gardner, Lane and Stevens2000). The embryos included 14 high-grade ICSI embryos, 17 delayed embryos (compacted morula), 11 abnormal BC blastocysts and eight abnormal CC blastocysts. ICSI indications were heterogeneous, but all embryos originated from superovulated oocytes. Zona pellucida and attached cumulus cells were removed by digestion with proteinase K (9 units/ml). Denuded embryos were carefully examined under an inverted microscope with Hoffman Modulation Contrast optics (Leica DM IRB) and only cumulus cell-free embryos were selected for analysis and individually stored at –80°C.
DNA methylation analysis
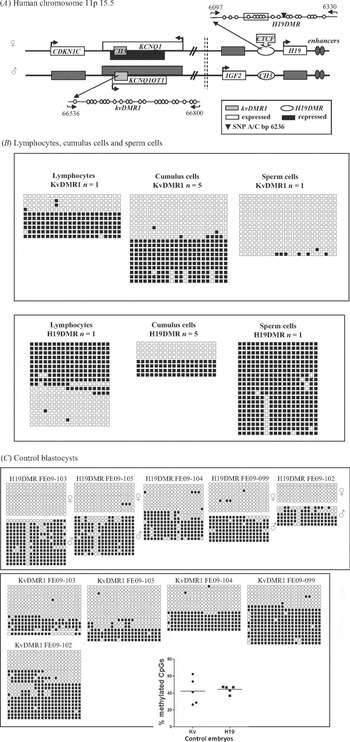
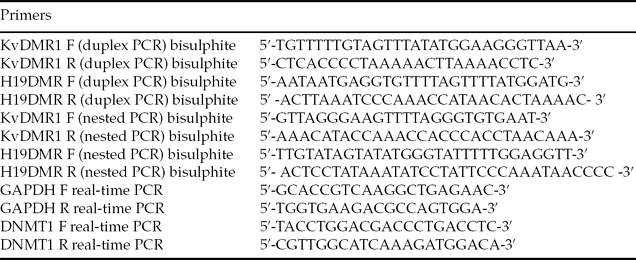
The methylation profiles of KvDMR1 and H19DMR were determined by bisulphite mutagenesis and sequencing as previously described (Borghol et al., Reference Borghol, Lornage and Blachere2006), in five control blastocysts, eight delayed embryos, five BC blastocysts, five CC blastocysts, 2 × 10⁶ sperm cells, 1 × 10⁶ lymphocytes and in five pools of 10 to 20 cumulus cells. After treatment with bisulphite and purification, the DNA was immediately used for duplex polymerase chain reaction (PCR). Five independent duplex PCRs followed by gene-specific nested PCRs were performed per embryo. We analysed 22 CpG sites in a 265-bp fragment of KvDMR1 (66,536–66,800 bp, GenBank U90095) and 18 CpG sites in a 234-bp fragment of H19DMR (6097–6330 bp, GenBank AF087017) that harboured a single nucleotide polymorphism (SNP) A/C (A/T following bisulphite treatment) at nucleotide 6236, as shown in Fig. 1A. The 234 bp H19DMR fragment contains the sixth CCCTC-binding factor (CTCF) site. The primers specific to bisulfite-converted DNA are listed in Table 1.
(A) Schematic representation of human chromosome 11p 15.5. (B) Bisulphite sequencing analysis of KvDMR1 and H19DMR in lymphocytes, cumulus cells and sperm cells. Each line represents a single allele. A black square indicates a methylated CpG and an open square denotes an unmethylated CpG. (C ) Bisulphite sequencing analysis of KvDMR1 and H19DMR in control blastocysts. Each line represents a single allele. A black square indicates a methylated CpG and an open square denotes an unmethylated CpG. The percentages of methylated CpG for all embryos are summarized in the graph below the figure. H19 DMR: Genbank AF087017; Kv DMR1: Genbank U90095.

Primers for amplification of bisulphitetreated DNA and real-time PCR
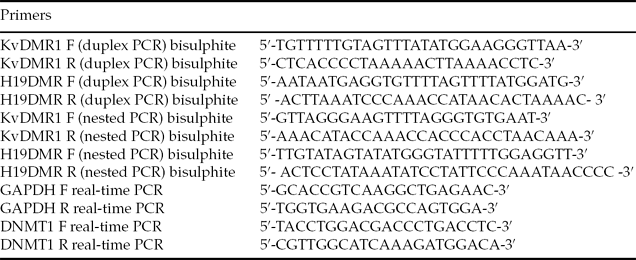
F: forward primer; R: reverse primer
KvDMR1: Genbank U90095, 66536–66800 bp; H19 Genbank: AF087017, 6097–6330 bp; GAPDH Genbank: NM_03, 276–412 bp; DNMT1: Genbank FLJ6293, 1303–1406 bp.
The duplex PCR was less efficient in amplifying H19DMR than in amplifying KvDMR1 and we obtained a signal for both regions in only 13 out of 23 analysed embryos. The PCR products were subcloned into the pGEM-T plasmid (Promega). Five clones were sequenced for each PCR product (Biofidal, Lyon, France). Because of the limiting starting material and because bisulphite treatment is deleterious to DNA, identical sequences from separated PCRs definitely represent distinct chromosomes; identical sequences obtained from the same PCR product were counted only once, as previously discussed (Borghol et al., Reference Borghol, Lornage and Blachere2006).
Real-time quantitative PCR:
The relative mRNA level of DNMT1 was assessed by real-time quantitative PCR, using the mRNA level of glyceraldehyde 3-phosphate dehydrogenase (GAPDH) as an internal control. Twenty-seven embryos (nine normal ICSI embryos, nine delayed embryos, six BC abnormal embryos and three CC abnormal embryos) were subjected individually to a one-tube RT-PCR protocol as described previously (Ziyyat & Lefevre, Reference Ziyyat and Lefevre2001).
In total, 2.5 μl of RT product was utilized for real-time PCR to study the expression of DNMT1 and GAPDH (reference gene) genes in a single embryo. This procedure was carried out using Light Cycler Fast start DNA master SYBR green I (Roche Diagnostics) and the Light Cycler real-time PCR system (Roche Diagnostics), according to the manufacturers’ protocols. The primers used are listed in Table 1; primers were chosen to encompass one intron to avoid amplification of genomic DNA (Girault et al., Reference Girault, Tozlu and Lidereau2003) and to amplify both the somatic and the oocyte variant of DNMT1 (Hayward et al., Reference Hayward, De Vos and Judson2003).
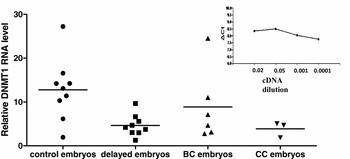
Standardization was carried out with serial dilutions of RT products of both genes that corresponded to different concentrations of total RNA from fibroblast reference cells. We verified that the amplification efficiencies of DNMT1 and GAPDH were approximately equal. The average Ct (Ct DNMT1 – Ct GAPDH) was determined. The linear regression analysis of the data is shown in Fig. 2. The deviation from zero of the slope of the line was not significant. Therefore the expression of DNMT1 was calculated using the 2−ΔΔCt method where ΔΔCt = (Ct DNMT1 – Ct GAPDH)sample – (Ct DNMT1 – Ct GAPDH)standard (Livak & Schmittgen, Reference Livak and Schmittgen2001).
DNA methyl transferase 1 (DNMT1) gene expression patterns in individual blastocysts from control, delayed or atypical groups. DNMT1 expression was determined by real-time quantitative RT-PCR and results were normalised with expression of a housekeeping gene, glyceraldehyde 3-phosphate (GAPDH) and an internal standard sample. The relative DNMT1 RNA level was calculated using the 2−ΔΔCt method, where ΔΔCt = (Ct DNMT1 – Ct GAPDH) sample – (Ct DNMT1 – Ct GAPDH) standard. The bars indicate the median expression value. The linear regression analysis of the standardization test is shown inside the frame.

Statistics
Statistical analysis was performed using non-parametric t-test or analysis of variance (ANOVA) and a difference was considered significant when the P-value was ≤ 0.05.
Results
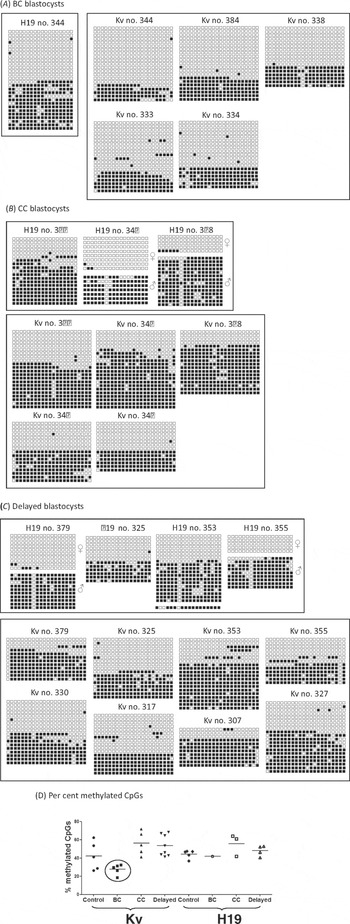
The 50 human embryos studied derived from fertilized ICSI oocytes; they were divided into four groups according to the Gardner et al. (Reference Gardner, Lane and Stevens2000) grading system. Group1: 14 high-grade ICSI blastocysts suitable for transfer constituted the control group. Thirty-six embryos not suitable for transfer were excluded from the ICSI procedure and distributed in groups 2, 3 and 4. Group 2: 11 blastocysts graded BC (the inner cell mass contained several cells, loosely grouped; the trophectoderm contained very few large cells forming a loose epithelium). Group 3: eight blastocysts graded CC (the cavity was larger than the embryo; the inner cell mass and the trophectoderm were formed of very few cells). Group 4 corresponded to 17 embryos that did not reach the blastocyst stage after 6 days in culture (delayed). The study was performed on individual embryos to take into account the variability between embryos. We first verified that sperm was hypermethylated at H19DMR and hypomethylated at KvDMR1 and that the protocol used amplified methylated and hypomethylated strands in DNA equally from lymphocytes and cumulus cells, despite the relatively limiting starting material (Fig. 1B). Therefore, even though we could not distinguish the paternal from the maternal allele for KvDMR1, because we did not find any polymorphism in the region analysed, we propose that the significant differences observed with the statistical analysis of the results do not reflect an artefact either during PCR or the cloning processes, but do reflect real hypo- or hypermethylation of KvDMR1 in the embryos. This hypothesis has been verified for H19DMR, as the amplified region carries a single nucleotide A/C polymorphism (base 6236) that allows parental alleles discrimination in some embryos. In these embryos, approximately half of the total sequences were hypomethylated and likely to be of maternal origin, while the other half were hypermethylated and likely to be of paternal origin.
H19DMR methylation
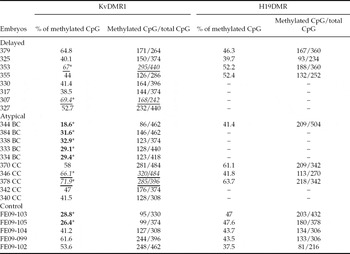
The amplified differentially methylated region contained 18 CpGs over 234 bp and comprised the sixth CTCF (the insulator protein CCCTC-binding factor) binding site (Bell & Felsenfeld, Reference Bell and Felsenfeld2000; Hark et al., Reference Hark, Schoenherr and Katz2000). The five blastocysts from the control group exhibited relatively homogeneous methylation profiles at H19DMR with 46 methylated alleles and 45 hypomethylated alleles on 91 alleles analysed (Fig. 1C and Table 2). Only one BC embryo (no. 344) from group 2 could be analysed and exhibited the expected balance between methylated and unmethylated strands (Fig. 3A). The three CC blastocysts in group 3 (no. 370–346-378) exhibited an average of 55.5 ± 11.9% methylated CpGs, 32 alleles were methylated out of 53 (Fig. 3B). In the two embryos where parental alleles could be distinguished (no. 346–378), sequences carrying the same polymorphism at base 6236 (A or C) showed similar methylation profiles, either hypomethylated and likely to be of maternal origin, or hypermethylated and likely to be of paternal origin. Another SNP C/T has been observed bp 6194; it cannot be utilized to identify parental alleles as it was located within the seventh CpG. Embryos that showed developmental delay (Fig. 3C, D and Table 2) also exhibited balanced patterns between methylated and unmethylated strands, with an average of 47.6 ± 6% methylated CpGs. Again, in two embryos in which parental alleles could be distinguished (no. 379–355), sequences that carried the same polymorphism at base 6236 showed similar methylation profiles, which demonstrated that there was neither methylation acquisition by the maternal allele, nor methylation lost by the paternal allele, as expected for H19DMR in preimplantation embryos. None of the examined embryos, in any group, exhibited significative hypermethylation.
Summarized results of methylation analyses for H19DMR and KvDMR1

Percentage of methylated CpG at KvDMR1 and H19DMR per embryo and number of methylated CpGs/total CpGs analysed per embryo.
Bold text indicates hypomethylated embryos. Italic underlined text indicates hypermethylated embryos.
*p ≤ 0.05.
Bisulphite sequencing analysis of KvDMR1 and H19DMR in atypical BC (A), atypical CC (B) and delayed blastocysts (C). Each line represents a single allele. A black square indicates a methylated CpG and an open square denotes an unmethylated CpG. The percentages of methylated CpG for all embryos are summarized in the graph (D).

KvDMR1 methylation
The amplified KvDMR1 region contained 22 CpGs over 265 bp, and strands that lacked 11 or more methylated CpGs were considered to be hypomethylated. Within the control group (Fig. 1C; Table 2), two blastocysts (no. FE-09–103/105) were significantly hypomethylated (10 and 13 hypomethylated strands out of 15 and 17 respectively, corresponding to an average of 27.6 ± 1.7% methylated CpGs, i.e. 194 methylated CpG sites/704 analysed CpGs, P ≤ 0.001). The other three (no. FE-09–099/102/104) showed an equilibrated distribution between methylated and unmethylated strands that corresponded to an average of 52.1 ± 10.2% methylated CpGs (619 methylated CpG sites/1166 analysed CpGs). All BC embryos from group 2 (Fig. 3A; Table 2) exhibited significant deficient methylation with an average of 28.3 ± 5.6% methylated CpGs (which corresponded to 606 methylated CpG sites/2156 analysed CpGs compared with 813 methylated CpG sites/1870 analysed CpGs for control embryos, P ≤ 0.001). CC embryos in group 3 (Fig. 3B and Table 2) exhibited relatively equilibrated distribution of the strands between methylated and unmethylated for three of these (no. 370–342-340) (average of 48.8 ± 8.4% of methylated CpGs), while two embryos (no. 346–378) were hypermethylated significantly (14 and 16 methylated strands out of 18 and 22 analysed strands, P ≤ 0.001). Embryos that showed developmental delay in group 4 (Fig. 3C, D and Table 2) exhibited an average methylation of the CpGs of 52.2 ± 13% (which corresponded to 1450 methylated CpG sites/2816 analysed CpGs), with relatively homogeneous profiles for six embryos, while two embryos (no. 353–307) showed some hypermethylation (P ≤ 0.001).
DNMT1 expression
As DNMT1 has been shown to be responsible of the maintenance of the imprint during early development, a decrease of DNMT1 expression could account for the hypomethylation of imprinted domains. We analysed the expression of DNMT1 in nine cryopreserved control embryos, in nine embryos with developmental delay and in nine embryos with poor quality morphology (six were graded BC and three were graded CC) by real-time-PCR, using primers that amplified both DNMT1s and DNMT1o. Normal blastocysts were formed from approximatively 100 cells, while embryos with poor morphology or with developmental delay exhibited a low and variable number of cells. As explained in the Materials and methods section, reverse transcription was done directly on the embryo without extraction and quantification of total RNA contents. Both DNMT1 and GAPDH were amplified from the same cDNA product for each embryo. The relative levels of DNMT1 RNA were unexpectedly variable within the control embryos (Fig. 2). We did not observe a significant decrease in DNMT1 expression in atypical BC or CC embryos compared with the control group (P = 0.165 and P = 0.06 respectively), contrary to our findings for delayed embryos (P = 0.047).
Discussion
Following the extensive epigenetic remodelling that takes place during gametogenesis, fertilization induces another series of epigenetic modifications. The male pronucleus is actively demethylated before the first replication round (Mayer et al., Reference Mayer, Niveleau and Walter2000) while the maternal genome is demethylated over a few cell cycles, most of the genome being demethylated by the morula stage (Santos et al., Reference Santos, Hendrich and Reik2002). Imprinted genes must escape these global changes and maintain the pattern of methylation established in the gametes, in order to be expressed properly later. Very little information is known concerning the maintenance of the imprint in human preimplantation embryos. Geuns et al. (Reference Geuns, De Rycke and Van Steirteghem2003) found heterogeneous methylation profiles (varying from 0 to 100%) for SNRPN in arrested early embryos that were not suitable for transfer. The same group showed that ICSI embryos with normal morphology and normal developmental timing exhibited some relaxation of the imprint at DLK1-GTL2 by the morula stage (Geuns et al., Reference Geuns, De Temmerman and Hilven2007).
In the present study, we observed that, as it has been described in the mouse, H19DMR and KvDMR1 are both differentially methylated in preimplantation human embryos generated via ART. However, we observed partial relaxation of the maternal KvDMR1 imprint in some embryos, while the paternal imprint at H19DMR appeared stably expressed. All BC embryos showed KvDMR1 hypomethylation, with an average of 27.8 ± 5.6% methylated CpGs. Surprisingly, CC embryos which exhibited highly degraded morphology, with a reduced number of cells at both the inner cell mass (ICM) and the trophectoderm, showed almost normal methylation at KvDMR1. The main difference between BC and CC embryos lies on the number of cells of the ICM that are very few in CC embryos. Thus KvDMR1 hypomethylation is likely to affect specifically the cells from the ICM and to represent a loss of protection of the imprint arising specifically in these cells. Therefore, the significant decrease of methylation at KvDMR1 in BC embryos cannot be inherited from the gametes. Hypomethylation of KvDMR1 in BC embryos was not linked to any known infertility factor of the parents.
Unexpectedly, we observed significant hypomethylation of KvDMR1 in two embryos suitable for transfer, in the control group. However, all embryos utilized in this study, control group included, were issued from ICSI of superovulated oocytes and we previously established that hormonal induction of ovulation led to the release of metaphase (M)II oocytes carrying incomplete imprint at KvDMR1 (Khoueiry et al., Reference Khoueiry, Ibala-Rhomdane and Mery2008). Therefore, the two embryos that exhibited loss of methylation at KvDMR1 may originate from oocytes that had not acquired a fully and stably established imprint by the MII stage. Hypomethylation at KvDMR1 has been associated with Beckwith-Wiedemann syndrome (BWS), and a loss of methylation on the maternal allele has been observed in more than 90% of BWS children conceived through ART (DeBaun et al., Reference DeBaun, Niemitz and Feinberg2003; Gicquel et al., Reference Gicquel, Gaston and Mandelbaum2003), However, the increased prevalence of BWS in children conceived via ART documented in several reports is controversial (Manipalviratn et al., Reference Manipalviratn, DeCherney and Segars2009) and hypomethylation at KvDMR1 has been observed in clinically normal children conceived via ART (Gomes et al., Reference Gomes, Huber and Ferriani2009). A gain of methylation was also observed for KvDMR1 in two delayed embryos and in two atypical CC embryos. Hypermethylation of KvDMR1 has been recently depicted in one ICSI child born small for gestational age, and the authors attributed this epimutation to an imprint erasure defect in the paternal germ line (Kanber et al., Reference Kanber, Buiting and Zeschnigk2009).
To what extent the imprinting errors observed in some embryos could be attributed to superovulation induced perturbation cannot be evaluate in humans for evident ethical reasons, as control embryos with no hormonal stimulations are not available. Results in the mouse are controversial as one study attributed to superovulation the loss of paternal H19 and maternal KCNQ1OT1 methylation observed in blastocysts (Market-Velker et al., Reference Market-Velker, Zhang and Magri2009), while another study imputed alteration of H19 methylation to the in vitro fertilization process itself and correlated methylation defects with abnormal or failing developmental process (Fauque et al., Reference Fauque, Jouannet and Lesaffre2007). These studies were performed on different strains of mice and the high variability of the data obtained highlights the difficulty in extrapolating the results on imprinting studies to other species, particularly to humans.
In the embryos in which a polymorphism allowed parental allele discrimination, we never observed a loss of H19 methylation on the presumably paternal allele or a gain of H19 methylation on the presumably maternal allele, in any blastocyst group. We previously observed a maternal gain of methylation at H19DMR in MII oocytes from stimulated ICSI cycles matured in vitro, but essentially associated to oocytes arrested at MI stage following in vitro culture (Borghol et al., Reference Borghol, Lornage and Blachere2006). The oocytes used to generate the embryos analysed in the present study were matured in vivo following hormonal stimulation and retrieved at the MII stage prior to ICSI. Even though they are both located on the human chromosome 11p15.5, H19DMR and KvDMR1 appear independently regulated, KvDMR1 methylation being altered while H19DMR remains differentially methylated.
The maintenance of DNA methylation at imprinted DMRs in preimplantation embryos has been assigned to the somatic and oocyte forms of DNMT1. Maternal deletion of both isoforms, DNMT1s and DNMT1o, caused a loss of methylation at multiple imprinted loci in mouse blastocysts (Hirasawa et al., Reference Hirasawa, Chiba and Kaneda2008) and hypomethylation of satellite I sequences in somatic nuclear transfer bovine blastocysts was associated with lowered Dnmt1 expression (Sawai et al., Reference Sawai, Takahashi and Moriyasu2010). In the present study, we did not observe significant up- or down-regulation of DNMT1 expression in any of the blastocysts tested that could explain the loss or the gain of methylation at KvDMR1. Even though DNMT1 appears to be expressed normally in most embryos with developmental failure, this situation does not imply that the protein is present normally in the nucleus of these embryos and this aspect should be further explored. In addition, there are also other trans-acting factors critical for the maintenance of methylation at imprinted genes such as ZFP57, which encodes a zinc-finger transcription factor expressed in early development. The loss of both the maternal and the zygotic Zfp57 in the mouse results in complete loss of differential DNA methylation at several imprinted domains and in lethality around mid-gestation (Li et al., Reference Li, Ito and Zhou2008). Furthermore, clinical investigations on patients with transient neonatal diabetes have associated hypomethylation at five imprinted domains, including KvDMR1, with mutations in ZFP57, a finding that suggests a role for this factor in the maintenance of DNA imprints during early development (Mackay et al., Reference Mackay, Callaway and Marks2008). The partial loss of methylation of KvDMR1 in BC atypical embryos could be the result of a deficiency in ZFP57, and further investigations on the level of ZFP57 in BC embryos are necessary. The fact that hypomethylation of KvDMR1 happened independently of H19DMR in the embryos is in agreement with the role of different trans-acting factors acting to maintain the methylation at different imprinted domain.
Further experiments that focus on the methylation of KvDMR1 in the gametes of the couples are needed to elucidate the origin of the alteration observed in certain arrested embryos and to evaluate the part of inherited epigenetic mutations in embryonic developmental failure. The variability of the results from animal studies highlights the need for studies on humans to evaluate the impact of ART on imprinting, even though they could often be frustrating because of lack of appropriate controls for ethical imperatives.
Acknowledgements
We are very grateful to all the couples that donated embryos for research and to the staff of ‘Laboratoire de Biologie de la Reproduction’ at FME Hospital, Bron, particularly to S. Giscard d'Estaing and Astrid Perret. We also want to thanks P.Y. Bourillot and Virginie Dolmazon for valuable advice to perform real-time quantitative PCR.
Rita Khoueiry was a recipient of Organon and Fondation pour la Recherche Médicale fellowship. This work was supported by Université Claude Bernard Lyon I.