


1. Introduction
It is reported that seasonal snow-cover area in the Northern Hemisphere has decreased and that the length of the snow-cover season has also decreased when compared with that in the 1970s (e.g. Reference Rikiishi, Hashiya and ImaiRikiishi and others, 2004). These trends are considered to result from the recent global warming and are clearer in the middle latitudes. Japan is located on the east side of the Eurasian continent and mainly consists of two large islands, Honshu and Hokkaido. In winter, strong northwesterly monsoons blow from Siberia to the islands of Japan, and the monsoons, collecting large amounts of vapor while passing over the warm Sea of Japan, hit the backbone mountains of Japan and bring heavy snowfall to the northwestern part of the mountains. Therefore, the areas facing the Sea of Japan have some of the world’s deepest seasonal snowpacks.
Japan’s mountainous areas are located at relatively low latitudes (35–45˚ N) in a warm temperate zone, so even slight climate changes are likely to affect snow conditions. In fact, the simulation results based on predicted data using the coupled ocean–atmosphere global climate model indicate that snow depth in the Honshu region will decrease considerably by 2090 (Reference Inoue and YokohamaInoue and Yokohama, 2003). On the other hand, a recent study implied the possibility that the decrease in Arctic sea-ice cover could cause colder winters in the Eurasian continent (Reference Honda, Inoue and YamaneHonda and others, 2009). Indeed, during the winter of 2006 (the winter season of 2005/06 is designated as 2006; hereafter, the same rule is applied when allocating year to the winter seasons), Japan experienced anomalously low temperature and heavy snowfall (e.g. Reference Takano, Tachibana and IwamotoTakano and others, 2008). Therefore, the reaction of snow cover in Japan to global warming is complicated and remains a matter warranting further investigation.
With respect to water resources, it is important to understand the fluctuations of mountain snow conditions because snow meltwater provides a valuable water resource. Until recently, however, few continuously operating meteorological sites have existed in the Japanese mountains due to severe weather conditions. Reference Matsuura, Matsuyama, Asano, Okamoto and TakeuchiMatsuura and others (2005) analyzed 11 years’ worth of data collected from 1989 to 1999 at Busuno (567ma.s.l.) in the middle of Honshu, facing the Sea of Japan. They found no notable rise in mean wintertime air temperature and no obvious trend in changes in precipitation in that mountainous area. Their study is very useful for providing a preliminary understanding of fluctuation in a snowy environment at relatively high altitude. However, their data were obtained in only one region at an elevation that may be slightly too low to regard the station as a mountain observation site. Therefore, it is still useful to examine recent fluctuations in snowy environments throughout Japanese mountainous areas as a whole.
About 20 years ago, the National Research Institute for Earth Science and Disaster Prevention (NIED) constructed a Snow and Weather observation Network (SW-Net) in mountainous areas of Japan to measure meteorological and snow conditions (Reference Nakamura, Shimizu, Abe, Kimura, Nakawo, Nakamura, Izumi, Nakamura and SackNakamura and others, 1997; Reference Shimizu and AbeShimizu and Abe, 2001). The primary aim of SW-Net is to obtain basic meteorological information for use in preventing snow disasters in mountain areas. However, the long-term data record is also useful for investigating the sensitivity of snowpack properties to climate change, particularly to global warming.
Using SW-Net data up to winter 2005, Reference Yamaguchi, Abe, Nakai and SatoYamaguchi and others (2007) showed the features of snowy environments in Japanese mountainous regions. In this paper, we present the newest data, including those for heavy-snowfall winters (2005, 2006) and anomalously warm winters (2007, 2009), and discuss the fluctuations in snowy mountain environments. In this study, we define the winter season as the period 1 December–31 March.
2. Observation Sites
The observation stations established by the NIED are located on six mountains, which are considered to have the largest snowpack in each area (Fig. 1a). The SW-Net, composed of these mountain stations, covers all snowy mountainous areas of Japan from 35˚N to 43˚N at <2˚ intervals. The basic measurement elements at all sites are air temperature measured using PT-100 type thermometers, snow depth determined using ultrasonic/laser snow-depth gauges, and snow mass (snow water equivalent) measured by metal wafers consisting of a pressure-sensing plate filled with antifreeze solution (Reference KimuraKimura, 1983). A number of sites also collect precipitation data measured using a tipping-bucket rain/snow gauge, which has a heater and a windshield to better capture snow, and wind-direction and -speed data measured using an anemometer.
Locations of the observation sites: (a) SW-Net, (b) C-Net.

Each SW-Net site is paired with a nearby flatland site for comparison of both snowy environments. The flatland sites are operated by the Japan Meteorological Agency (JMA) and record air temperature, precipitation and snow depth. In addition to these meteorological elements, two NIED sites have recorded long-term and detailed data on snow conditions, including snow mass, daily snowfall and snow-cover structure (Fig. 1a).
In addition to the SW-Net, NIED established another network (C-Net) distributed throughout one of the heaviest-snowfall regions of Honshu island (Fig. 1b). The main aim of C-Net is to provide detailed information on the altitudinal distribution of snow depth to prevent snow disasters in the region; thus, only snow depth has been measured at C-Net sites since 1998. Table 1 describes the location and elevation of the sites in both networks.
Locations of the SW-Net and C-Net observation sites

3. Fluctuations of Snowy Conditions In Mountainous Areas
Figures 2 and 3 present variations in snow conditions at each SW-Net site in the northern and southern parts of the network, respectively. In addition to data from mountain sites, data from two low-altitude sites (FS2 and FS3) are also shown as representative of flatland sites in northern (FS2) and southern (FS3) areas. Compared with Figure 3, Figure 2 shows a larger number of missing data because of measurement difficulties at mountain sites, where climate conditions are more severe than in the southern part of the network.
Snowy conditions in the northern part of SW-Net. (a) Fluctuations in mean air temperature, T, over the winter season. (b) Fluctuations in maximum snow depth, SDmax, in the winter season. (c) Fluctuations in maximum water equivalent of snow, SWEmax, in the winter season.

Same as Figure 2, but for the southern part of SW-Net.

First, we discuss the fluctuations in mean air temperature, T, over the winter season in SW-Net. The large variations in interannual T fluctuation at each site shown in Figures 2a and 3a are similar to the peaks that occurred in 1995, 1998, 2004 and 2007. The same trend is seen for flatland sites (FS2 and FS3). However, detailed examination reveals somewhat different trends between Figures 2a and 3a. For example, the T values in Figure 3a show a peak in 2009 that is almost the same as the high values in 2007; however, the T values in Figure 2a do not show a remarkable peak in 2009, even though T was slightly higher in 2009 than in 2008. The average (standard deviation) values over the period 1995– 2010 are –8.0±0.6˚C at SW1, –2.0±0.9˚C at SW2-1, –3.8±0.7˚C at SW3, –3.8±0.8˚C at SW4, –0.1±0.8˚C at SW5, and –0.2±0.7˚C at SW6 for mountainous areas and +0.2±0.5˚C at FS2 and +2.7±0.7˚C at FS3 for flatland areas. Although the average temperature varied from site to site, the standard deviations of each site are of the same order, including for the flatland sites, and no notable increases in mean winter air temperature were found at any of the sites during the observation period.
†Station of the Japan Meteorological Agency.
‡SW2-2 was established in 2002.
§Between each station and FS3.
Second, we discuss the fluctuations in maximum snow depth, SDmax, in SW-Net. The maximum value of SDmax in all measurement data was 771 cm, measured at SW2-2 in 2003 (Fig. 2a). Data have been collected at SW2-2 since then, and the 2003 conditions do not seem to be very different from those in other years. In fact, SDmax at SW2-2 exceeded 700cm in three of the six winters in which measurements were taken. Therefore, in mountainous areas around SW2-2, SDmax must normally accumulate to ~700 cm. The large trends seen in interannual fluctuation in SDmax at each site are similar, in that they have two peaks: one in 1996 and the other in 2000. Additional low values are shown in 1998 and 2007. Several studies (e.g. Reference IshizakaIshizaka, 2004) have reported that SDmax in flat areas of Japan decreased dramatically at the start of the 1990s, but unfortunately our mountain-site data have been gathered only since the 1990s. Therefore, we did not mention the snowy environments in mountain areas before the 1990s, but our data show no notable reduction in SDmax over at least the past 20 years. A detailed examination of the trends of interannual fluctuation at each site revealed some differences. For example, SW4 and SW5 had conspicuous peaks in 2006, when heavy snowfall also occurred in flatland areas (e.g. Reference Iyobe, Kawashima and IzumiIyobe and others, 2007), while other sites had no such peaks. In addition, in winter 2007, which was the warmest winter in >100 years in Japan, SDmax data from most of SW-Net showed the minimum values among the measurement periods, but SDmax at SW2-1, SW2-2 and SW3 did not show minimum values, although the SDmax values became smaller than those of the previous year.
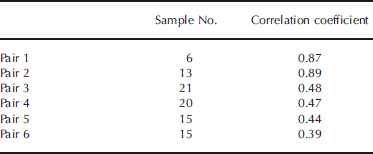
To better understand the differences between snowy environments in the mountains and in the flatland areas, we calculated the correlation coefficients between the SDmax of mountain and nearby flatland sites. The results are summarized in Table 2. Here we consider that there is a statistically significant correlation between a pair of datasets if the correlation coefficient, R, is larger than the value of R calculated from a t test with levels of significance of 5%. Pairs 1–4 showed a statistically significant score. In particular, pairs 1 and 2 in northern Honshu showed a strong correlation, i.e. The values of R at both sites are larger than the value of R calculated from a t test with levels of significance of 1%. On the other hand, a significant statistical correlation was not found for the western pairs (pairs 5 and 6), i.e. The values of R at these two sites are smaller than the value of R calculated from t tests with levels of significance of 5%. These results suggest that the fluctuations in snowy mountain environments sometimes differ from those in flat parts of the same regions, and moreover, it is difficult to estimate the correct fluctuations in snow cover in mountainous areas based on that of nearby flatland areas, especially in western parts of Honshu.
Correlations of maximum snow depth between mountain sites and adjacent flatland sites
Figures 2c and 3c show fluctuations in the maximum snow water equivalent, SWEmax, at SW-Net stations. The SWEmax fluctuations generally correspond with those of SDmax, but the days of SDmax usually do not correspond with days of SWEmax. Reference Yamaguchi and AbeYamaguchi and Abe (2007) analyzed a long period of SW-Net data and showed that the day of SDmax was ~1 month earlier than that of SWEmax in a normal year. We compared the change range of fluctuation of SDmax with that of SWEmax at five sites (SW2-2, SW3, SW4, SW5 and SW6) having >10 years of data (Table 3). Here we defined the change range (CR) as the difference ratio between the average value and maximum (minimum) value during the data collection period. At all sites the values of CR were larger for SWEmax than for SDmax, although the ratios varied from site to site. This result implies that water resources from snow, namely SWEmax, in mountainous areas may have a larger year-to-year change range than does SDmax fluctuation, even though only SDmax fluctuations are usually discussed in the context of changes in mountainous snowy conditions, because of the lack of SWEmax data.
Amplitude of SDmax and SWEmax at five sites

Figure 4 shows the relationship between SDmax and SWEmax, which appears to change with the value of SDmax. That is, the average density over all snow depths, ρ ave, which was calculated by dividing SWEmax by SDmax, increased with the increase in SDmax. The ρ ave values can be roughly classified into three groups, although ρ ave should change gradually with change of SDmax. In the first group, SDmax is <3.0m and ρ ave is ~300 kgm–3. In the second group, SDmax is 3.0–5.0m and ρ ave is ~400 kgm–3. In the third group, SDmax is >5.0m and ρ ave is ~500 kgm–3. These results
Relationship between maximum snow depth, SDmax, and maximum water equivalent of snow, SWEmax. Dashed lines indicate the density averaged over the snow depth, ρ ave, with values given under each line. Gray line indicates the regression curve calculated from Equation (1).

indicate that the ρ ave values obtained at the flatland site cannot be directly applied to estimate SWEmax in mountainous areas. To connect the relationship between SDmax and SWEmax more smoothly, we introduce the nth-power function to describe the relationship between these values, resulting in the following equation:

where R is the correlation coefficient. The equation implies the amplitude of SWEmax fluctuation is larger than that of SDmax because the value of n in Equation (1) is >1.0.
4. Altitudinal Distributions of Maximum Snow Depth In C-Net
As described above, the interannual fluctuations in SDmax sometimes differed between mountain sites and nearby flatland sites. To examine this finding in detail, we analyzed SDmax data measured at several sites (C-Net), each located at a different altitude within a small local region (Fig. 1b).
Data on snowfall amounts at each site are useful for discussing the altitudinal fluctuation in snow depth. However, snowfall data were not collected in C-Net except at FS3. The interannual fluctuation in snowfall should mainly result from two fluctuations: fluctuations in the amount of winter precipitation and fluctuations in the percentage of winter precipitation falling as snow. Hence, we adopted the following two parameters: winter precipitation, P, at FS3, which was used as a representative value for this area, and the altitude, H T1, at which the mean winter air temperature was 1˚C, which was used to estimate the snow percentage of winter precipitation; it can be assumed that snow is the dominant form of winter precipitation at altitudes higher than H T1. We calculated the lapse rate for each winter using data at FS3 and SW3, and determined H T1 based on the lapse rate for each winter. We additionally show the cumulative measured snowfall depth during the winter season, NS, at FS3 as a reference for actual snowfall.
Variations in SDmax at each site are presented in Figure 5a and b. Each interannual fluctuation in SDmax seems to be almost similar, but there are four considerable differences. First, the maximum SDmax value at SW3 appeared in 2000, but that at other sites mostly appeared in 2005, with some higher-altitude sites having a peak in 2000. Second, the minimum SDmax values of the observation period appeared in 1998 at C5 and SW3, but in 2007 at other sites, although SDmax was small at all sites in both years. Third, SDmax values in 2001 were higher than those in 2000 at C0, FS3 and C3 (the relatively lower sites), but the other sites showed an opposite trend. Fourth, SDmax values showed an increase in 2003 at C0 and FS3, whereas the opposite was found at other sites. Next, we examine these four cases in more detail.
Maximum snow depth at C-Net and meteorological factors. (a, b) Fluctuations in maximum snow depth, SDmax, at each site. (c) Fluctuations in H T1 and total winter precipitation, P, and cumulative depth of snowfall, NS, during the winter season at FS3. The dashed lines indicate the altitude of each site.

In 2000, H T1 was located near the average altitude (373ma.s.l.), and P was largest during the observation period (~1.3 times greater than the average year). Therefore, the higher-altitude sites, especially SW3, may have received huge snowfall amounts as a result of large P, resulting in the clear peak in 2000. Moreover, the difference between SDmax in 1999 and that in 2000 shows altitudinal dependence, namely, the difference increases with altitude. On the other hand, the lower sites may not have experienced such a strong effect of the P fluctuation due to the normal temperature conditions. In fact, NS was almost the same in 2000 as in 1999 even though P was larger in 2000 than in 1999.
In 1998, because H T1 was located at a higher position (486ma.s.l.), sites lower than H T1 should have had less snowfall. Indeed, NS in 1998 was small. In addition, P in 1998 was smaller than average. Thus, sites higher than H T1 also likely received smaller amounts of snowfall because of the small precipitation in that year. On the other hand, H T1 in 2007 was located at its highest position (600ma.s.l.). Therefore, most of the sites except C5 and SW3 (which were higher than H T1) may have had less snowfall than usual because of the higher temperature. In fact, NS in 2007 was the smallest during the observation period, even though P in 2007 was almost the same as the average value, suggesting that higher sites could have had normal snowfall amounts. For these reasons, the timing of minimum SDmax differed between high-altitude sites (C5 and SW3) and other sites.
In 2001, H T1 was at a lower altitude than in 2000, but P was less in 2001 than in 2000. Therefore, no large increase in SDmax occurred at higher sites. On the other hand, snow could be expected to make up a large percentage of total winter precipitation at lower sites because H T1 was lower than average. Indeed, NS was larger in 2001 than in 2000, although P was smaller in 2001 than in 2000.
In 2003, both H T1 and P were lower than average. Therefore, snowfall amounts may have been smaller than average at higher sites due to reduced precipitation, but above average at lower sites because of lower temperature. In fact, NS was slightly larger in 2003 than in 2002.
As demonstrated above, the T condition is a dominant factor in SDmax at lower sites, whereas SDmax at higher sites has a stronger connection with the P condition. The dependence of SDmax on P should increase with altitude because the fluctuation of T does not have a large influence on the percentage of snow in winter precipitation if high altitude makes T low enough for snow formation.
To examine this hypothesis, we analyzed the relationship between air temperature and precipitation at three sites with different altitudes: FS3 (97ma.s.l.) representing the flatland area, C1 (423ma.s.l.) representing the mid-altitude area and SW4 (1305ma.s.l.) representing the mountainous area. Note that SW4 was located in a different region from the other two sites, but the mountain site in the same region (SW3) could not be used because it did not collect precipitation data. Figure 6 shows the distributions of precipitation with air temperature during each precipitation event; the curves in the figure show the normalized form obtained from averaged data over 5 years. In the figure, the resolution of air temperature is 0.1˚C, and the sum of precipitation at each temperature is a normalized value obtained by dividing by total precipitation in the winter season. Hereafter, we call this distribution the winter precipitation curve (WPC). The WPC at flatland site FS3 had a sharp peak near 0˚C, indicating that precipitation was most likely at a temperature of near 0˚C. At the mid-altitude site C1, there were two peaks, one around 0˚C and the other around –4˚C, but neither was as sharp as the peak at FS3. WPC at the mountain site SW4 also showed two peaks. The peak located near 0˚C is very small, whereas the other located around –8˚C was large but not as sharp as that at FS3. The analysis results suggest that WPC changes with altitude, but that all the sites also have a WPC peak around 0˚C. These different patterns should affect the sensitivity of snowfall amount to fluctuation of air temperature.
Winter precipitation curves averaged over 5 years at each site. The sum of the precipitation amount for each temperature was normalized by dividing by the total precipitation for the winter season. The graphs show running mean values for 11 data points.

Figure 7 shows the cumulative proportion curves, which were made from Figure 6. Assuming that the critical air temperature between snow and rain is 1˚C, we estimated the change in snow proportion, SP, with fluctuations in air temperature, T, of ±0.7˚C, which was the standard deviation of air temperature during the period 1998–2010. The values of SP in an average year at each site were 44% (FS3), 78% (C1) and 91% (SW4). If T was decreased by 0.7˚C, the SP changed to 51% (FS3), 81% (C1) and 93% (SW4). On the other hand, if T was increased by 0.7˚C, the SP values changed to 32% (FS3), 73% (C1) and 89% (SW4). Therefore, SP at FS3 should fluctuate from 32% to 51%; in other words, it should show a change range of 19% resulting from fluctuation in T (CR T ). At C1 and SW4, the CR T values were 8% and 4%, respectively. The standard deviation of P during the period 1998–2010 was ±15%. Thus, the fluctuation of SP caused by the fluctuation of P (CR P ) may be considered as 30%. Comparing CR T and CR P , CR P was larger than CR T at all sites, but the difference between CR P and CR T increased with altitude. These results support our hypothesis, i.e. The dependence of SDmax on P should increase with altitude.
Cumulative proportion curves of winter precipitation at each site, calculated from Figure 6.

In the above analyses, we assumed for simplicity that the fluctuation in P is independent of that in T, but some studies (Reference Nakamura and ShimizuNakamura and Shimizu, 1996; Reference Takeuchi, Endo and MurakamiTakeuchi and others, 2008; Reference Yamaguchi, Nakai, Iwamoto and SatoYamaguchi and others, 2009) have indicated that there is an obvious relationship between fluctuations in P and T in the study region. Therefore, the natural altitudinal distribution of SDmax should show more complicated fluctuations than those estimated from the above hypothesis. However, our study should contribute to an understanding of the reasons behind observed altitudinal distribution of SDmax.
5. Conclusions
We collected and analyzed more than 15 years’ worth of data on air temperature, snow depth and snow water equivalent in mountainous regions of Japan. In the mountainous areas, neither a notable increase in mean winter temperature nor a reduction of maximum snow depth, SDmax, was recognized.
Although the fluctuations in maximum snow water equivalent, SWEmax, showed the same trend as SDmax, the SWEmax fluctuation was larger than that of SDmax. Therefore, monitoring of only SDmax fluctuations is not sufficient for revealing the fluctuation of water resource originating from snow.
To better understand the correlations between the variables, data from each mountain site were compared with those from a nearby flatland site. The SDmax fluctuations in the mountainous areas sometimes showed different trends from those in flatland areas, especially the western parts of Honshu, because mountain SDmax depends more on winter precipitation than on mean winter air temperature, whereas mean air temperature is the dominant factor influencing fluctuations in SDmax in flatlands.
Although the data in this study cover more than 15 years, a longer study period is needed to clearly determine the effects of climate change on mountain snowpack. Thus, data from these sites will continue to be collected and analyzed.
Acknowledgements
We thank the JMA for providing the hourly meteorological datasets. We are also grateful for helpful suggestions from M. Ishizaka, T. Kobayashi, I. Kamiishi, H. Hirashima and H. Motoyoshi of the Snow and Ice Research Center, NIED, as well as from T. Sato, K. Kosugi and M. Nemoto of the Shinjo Branch of the Snow and Ice Research Center, NIED. Helpful comments and suggestions from R. Essery and an anonymous reviewer are greatly appreciated.



