

Introduction
Although decentralization has the potential to improve government effectiveness and strengthen democratic processes in low-income countries, this potential often remains unrealized (Devarajan et al. Reference Devarajan, Khemani, Shah, Ahmad and Brosio2009). The construction of effective subnational tax systems offers a particularly vivid illustration of this challenge: although fiscal decentralization is critical to achieving the broader efficiency and governance gains associated with decentralization, it is a realm in which reform has been particularly ineffective, or at the very least, incompletely administered (Bird Reference Bird2011; Jibao & Prichard Reference Jibao and Prichard2015). Increasingly, explanations for these failures have focused on political barriers to reform, moving beyond the largely technocratic approaches of the past (Jibao & Prichard Reference Jibao and Prichard2015; Smoke Reference Smoke2013). However, most accounts have continued to begin implicitly with an image of an “ideal” rational-legal system of local government taxation. The reality of subnational taxation—particularly outside of major metropolitan centers—is often much “messier,” characterized by pervasive informality and grounded in existing social relationships and collective norms. Existing reform prescriptions for local government taxation seek in many ways to simply wish this actuality away, calling for improved monitoring, less discretion for collectors, and greater collection and enforcement capacity. However, despite being intuitive in rational-legal terms, such approaches may encounter significant challenges in practice, as they fail to adequately acknowledge inescapable capacity constraints and the broader social reality in which collection efforts are embedded.
This article provides a ground-level view of the day-to-day realities of local government taxation in the context of a decentralization agenda that has been prioritized by both international donors and the central government. The goal is to reveal the informal norms and institutions governing the tax system as it functions in practice in relatively marginalized and understudied areas, and to explore the potential implications for local governance. We do so through a focused study of market taxation in two districts in Ghana’s disadvantaged northern regions, Lawra and Yendi (World Bank 2004). Aside from their relative fiscal significance to local governments in Ghana, market taxes are often the principal manner through which relatively marginalized citizens—poor market traders, most of whom are women—interact with the local state (Owusu & Lund Reference Owusu and Lund2004). More basically, because market taxes are direct and thus highly “visible” to citizens, they are more likely than indirect taxes to spur citizen engagement through “tax bargaining” between citizens and governments (Bird & Zolt Reference Bird and Zolt2005; Joshi et al. Reference Joshi, Prichard and Heady2014; Prichard Reference Prichard2010, Reference Prichard2015).
In adopting this focus, we draw on a growing literature on the informal institutions and practices that underpin local economies and governance systems. These approaches seek to understand how informal institutions interact with formal regulatory systems and practices, and how formal and informal processes can work together as “hybrid” institutions, forming “second best” approaches to governance (Guha-Khasnobis et al. Reference Guha-Khasnobis, Kanbur and Ostrom2006; Meagher & Lindell Reference Meagher and Lindell2013; Cleaver Reference Cleaver2001; Titeca & Flynn Reference Titeca and Flynn2014). However, while this growing body of literature has advanced thinking about “real” governance in low-income countries, studies to date have generally focused on informality within cross-border trade or urban centers. By contrast, there are, to our knowledge, no in-depth studies of the day-to-day experiences of taxpayers in smaller towns—despite the fact that these areas are home to a large share of citizens in low-income countries. We thus seek to shed light on an area that has been overlooked by researchers and policymakers alike.
In order to do so, we draw on intensive field research carried out in Lawra and Yendi in 2011 and 2012, as well as broader research about the Ghanaian tax system spanning almost a decade. The field research included interviews and focus group discussions with market traders, representatives of various market associations and “commodity groups,” and in-depth interviews with representatives from the respective local governments and central government ministries. This included semistructured interviews with fifty traders in each location based on purposive selection from multiple “commodity lines,” as well as forty in-depth interviews with local government officials, national revenue authority representatives, civil society leaders, national policymakers, market representatives, and market association leaders. Footnote 1
We find that local tax systems are defined by a stark lack of administrative capacity, while informal tax practices are a prevalent and often normalized reality within local markets. These practices, shaped by social relationships and collective norms, are relatively predictable and socially accepted. In many cases these ingrained informal practices improve equity and state–society relations, by, for example, smoothing tax demands in the face of seasonality and building trust between taxpayers and tax collectors. However, in other cases they serve to reinforce existing social hierarchies and power dynamics, as when tax collectors unfairly target itinerant and foreign traders or grant special privileges to well-connected individuals. The implication is that improved outcomes could be achieved through a clearer understanding of the often informal dynamics of local taxation, and in turn, through reforms that “work with the grain” of inescapable local realities, while seeking to minimize the potential costs of informality (Booth Reference Booth2011; Kelsall Reference Kelsall2011).
Literature Review
Since the 1980s, international donors have supported decentralization programs across a wide range of low-income countries, with the expectation that decentralized governance would expand local autonomy, improve service delivery, and deepen accountability to citizens. However, the results have frequently fallen short of expectations, with efforts to strengthen local tax systems yielding particularly limited gains in most cases (Bahl Reference Bahl1999; Jibao & Prichard Reference Jibao and Prichard2015).
This poor track record reflects, at least in part, a disconnect between official, “formal” policies and the “informal” local institutional realities that often shape outcomes in practice (Smoke & Lewis Reference Smoke and Lewis1996). Footnote 2 International policymakers have tended to frame fiscal decentralization efforts through a paradigmatic Weberian lens that reflects recent Western institutional history, while focusing on bureaucratic reforms within formal institutions. This approach risks overlooking the many ways in which local political and social dynamics shape governance outcomes (Booth Reference Booth2011; Devarajan et al. Reference Devarajan, Khemani, Shah, Ahmad and Brosio2009; Smoke Reference Smoke2013). Fiscal decentralization processes are not simply technical or managerial exercises; rather, informal institutions continually interact with official rules to generate the practical “working” norms that define both behavior and outcomes (Blundo Reference Blundo2006; Olivier de Sardan Reference Olivier de Sardan2008; Titeca & de Herdt Reference Titeca and Herdt2010; Titeca & Kimanuka Reference Titeca and Kimanuka2012).
A more realistic assessment of the informal realities governing subnational taxation can shed light on the ways in which local institutional resources and historical legacies may be positively harnessed to support local development. To this end, a growing body of research views informal economic and governance systems less as “backward” or “dysfunctional” and more as “arrangements that work.” These mechanisms can be harnessed to strengthen tax collection, public service delivery, and governance through collaborative interaction between formal and informal institutions, described variously as “hybrid governance,” “coproduction,” or “formal–informal linkages” (Guha-Khasnobis et al. Reference Guha-Khasnobis, Kanbur and Ostrom2006; Joshi & Moore Reference Joshi and Moore2004; Meagher & Lindell Reference Meagher and Lindell2013).
The importance of understanding “real” governance at the local level is thus increasingly accepted, though the implications of these systems for livelihoods and governance are invariably complex. In certain instances, informal practical norms can address concerns that are ignored by state regulations, forming the basis of an underlying “moral economy” motivated by popular norms of fairness and reciprocity (Scott Reference Scott1976; Thompson Reference Thompson1971). However, alongside the potential benefits of informality lies the reality that informal governance practices are likely to reflect existing social hierarchies and power relations (Cleaver et al. Reference Cleaver2013; Meagher & Lindell Reference Meagher and Lindell2013). Hybrid or plural governance arrangements need not create more inclusive institutions in practice, but may instead simply increase opportunities for some while multiplying disadvantages for others (Cleaver et al. Reference Cleaver2013; Meagher Reference Meagher2013; Titeca & de Herdt Reference Titeca and Herdt2010).
These tensions are made plain by a small body of research that has begun to look at the informal realities governing taxation, primarily in postconflict settings. For example, Titeca and de Herdt (Reference Titeca and Herdt2010) have argued that while nonstatutory negotiation of tax rates may deprive the state of resources, it can also be adaptive to the realities of economic underdevelopment and political marginalization. In contexts where the state is weak and/or taxpayers are well organized, informal practices can result in better treatment of taxpayers, including some circumstances in which populations essentially dictate what taxes are extracted (Titeca & de Herdt Reference Titeca and Herdt2010; Titeca & Kimanuka Reference Titeca and Kimanuka2012). However, this recent research also emphasizes the substantial scope for coercion by government or nonstate taxing officials, as well as the high barriers to taxpayer collective action, making small-scale or marginalized economic actors particularly unlikely to influence the practical norms underpinning the de facto rules of the game (Schomerus & Titeca Reference Schomerus and Titeca2012; Titeca & de Herdt Reference Titeca and Herdt2010; Titeca & Kimanuka Reference Titeca and Kimanuka2012). More basically, the weakest actors are often most vulnerable to extortion, while more powerful actors are able to collude with tax collectors to avoid taxes.
The overall conclusion from existing research is not that informal or hybrid governance is inherently positive or negative for those affected, as observed impacts are diverse and both context- and actor-specific. Instead, the message is more nuanced: tax outcomes in practice are substantially shaped by informal norms and practices, and any effort to understand local government taxation should begin from an understanding of these realities (Blundo Reference Blundo2006; Olivier de Sardan Reference Olivier de Sardan2008). Critically, while these patterns of informal governance shape tax incidence and livelihoods, they may also influence the ability of taxpayers to engage with the state, as well as their perceptions of the state and its legitimacy. For this reason, understanding the informal realities shaping local government taxation may also be important for understanding decentralized governance more broadly (Joshi et al. Reference Joshi, Prichard and Heady2014).
Background: Local Government Revenue Collection in Ghana
On the surface, Ghana has implemented an ambitious decentralization program. Since 1988 the country has gradually been divided into six Metropolitan Assemblies, fifty-six Municipal Assemblies, and 154 District Assemblies, each of which, in turn, comprises subdistrict town, area, urban, and/or zonal councils. Footnote 3 In principle these assemblies enjoy significant political and fiscal autonomy, with each assembly responsible for setting rates for local government taxes within its jurisdiction. The assembly is responsible for gazetting, publishing, and making publicly available these tax rates, which are reviewed annually and codified within a fee-fixing resolution. The bulk of internally generated tax revenue comes from fees for trading in the market or exporting foodstuffs outside of the district, fees for the issuing of business licenses, and the basic rate, a poll tax. These taxes, in turn, are collected by a combination of salaried tax collectors—employees of the local government whose salaries are paid by the central government—and commission-based collectors, who typically receive a 10 to 20 percent commission on market taxes.
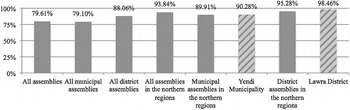
Despite seemingly strong legislative foundations—and symptomatic of the limitations of the broader decentralization agenda—local revenue mobilization in Ghana is extremely weak, with local governments heavily dependent on donors and fiscal transfers from the central government. As indicated in figure 1, almost 80 percent of local government revenue nationwide comes from central government transfers, while reliance on transfers is well above 90 percent in the historically marginalized northern regions, where both of our case districts are situated. Footnote 4 Poor local revenue collection reflects low capacity, but also limited revenue sources allocated to local governments, with local governments retaining authority over an incoherent and complex set of revenue instruments that offer low collection potential and high collection costs. In this context, market revenues, in the form of fees and stall rents, are of considerable importance, representing, from 2001 to 2011, an average of 27 percent and 24 percent of local government tax revenue in Lawra and Yendi, respectively. Finally, the central government retains an important direct presence in individual districts: the Ghana Revenue Authority (GRA) maintains regional and/or district offices that are responsible for collecting central government income and value-added taxes, districts are overseen by a presidentially appointed district chief executive, and up to 30 percent of assembly members in each district are also appointed by the president (GoG 1992).
Grants and Transfers as Shares of Total Assembly Revenue
Source: Authors’ calculations based on data from the Ministry of Local Government and Rural Development

Local Government Taxation in Practice
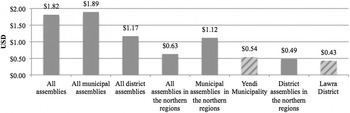
To capture the day-to-day realities of taxation we focus on the districts of Yendi and Lawra in Ghana’s relatively marginalized northern regions. Both districts have primarily agricultural economies, with poverty rates far above national averages, while revenue collection on a per capita basis is comparable across the two locations, though below national averages for similarly sized districts (see figure 2).
Average Per Capita Internally Generated Funds, 2009–2011
Note: “Internally generated funds” include both tax revenue and other locally generated revenue, including that from investments. Data is based on the local government structure as it existed in 2011 and thus includes 124 districts, 40 municipalities, and 6 metropolises. Per capita data is based on 2010 populations. USD equivalents were calculated using the international market exchange rate for August 1, 2012.
Source: Authors’ calculations based on data from the Ministry of Local Government and Rural Development

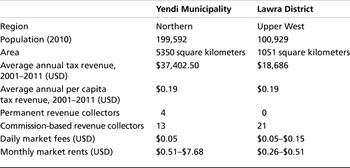
Though the goal is not to systematically compare the two districts, they differ in important ways that allow for selective comparison and additional insights (see table 1). Most obviously, Yendi is twice as large and more economically active. More subtly, Yendi has been home to more adversarial politics in recent years, grounded in chieftaincy and ethnic conflict (Jönsson Reference Jönsson2009). This, in turn, has been reflected in tax practices, with civil society leaders reporting relatively poor relations between taxpayers and the government in Yendi, as well as adversarial engagement by the chieftaincy with tax issues. By contrast, taxpayers in Lawra are reported to exhibit more positive attitudes toward tax compliance, while the local government enjoys a more positive relationship with the chieftaincy (Carroll Reference Carroll2011). Footnote 5 We expected the situation in Lawra to be associated with a greater degree of “quasi-voluntary” or “grudging” compliance—that is, a greater degree of taxpayer cooperation with tax authorities (Levi Reference Levi1988; Moore 2013; Tilly Reference Tilly and Janoski2005).
Comparison of Key Features of Yendi and Lawra

Note: In 2012, as part of a nationwide local government administrative reorganization, Lawra District was split into two administrative districts: Lawra and Nandom. Accordingly, the 2010 population data reported is larger than the cut-off for district assemblies, though Lawra was still considered a district rather than a municipality at the time.
Source: Data collected from the local assemblies, from market interviews, and authors’ calculations based on data obtained from local assemblies
Yendi and Lawra have both daily and rotating weekly markets, the latter of which attract itinerant traders from the wider district and region. Yendi, close to the Togolese border, is situated on major trading routes leading to two regional capitals, and its periodic market is integrated within the subnational regional and transnational West African trading economies. The periodic market in Lawra is similarly regionally integrated, owing largely to the small size of subdistrict markets and the proximity of the Burkinabe border. The markets in Yendi are larger than those in Lawra, with more extensive permanent market infrastructure, including a public lavatory and storage units. Markets in both locations offer a large range of local foodstuffs and agricultural products, including what is known locally as the “northern yam,” while the sale of wholesale foodstuffs is more prevalent in Yendi. Additionally, periodic markets offer plenty of nonagricultural commodities, such as used clothing and plastic housewares, while the markets in each location host a range of makeshift “chop bars” selling cooked food or pito, a locally brewed millet-based beer.
Market interviewees in our case studies were conducted with a mix of small traders who operate exclusively within district markets and traders who have additional operations outside of the market space itself in small business spaces or kiosks. Of the respondents, 98 percent reported paying local taxes, though with variation among market fees, market rents, and other taxes. Approximately 46 percent reported exclusively paying daily market fees, 20 percent reported paying monthly market rents for occupying formal market stalls, 31 percent reported paying both market fees and market rents, and 3 percent reported paying another type of local tax. Additionally, 58 percent of interviewees reported making some form of regular payment to a local traditional authority, while 9 percent, all of whom operated small businesses in addition to their market trade, reported paying national income taxes in the form of “tax stamps.” Footnote 6
Against this background, our analysis proceeds in three parts. First, we discuss key features of the economic and institutional context for local government market taxation, highlighting a series of relatively inescapable constraints shaping tax collection. The second part of the analysis focuses on capturing these informal practices, emphasizing the ways in which local economic realities, social norms of fairness and reciprocity, and social hierarchies and power dynamics influence outcomes. Finally, we consider the nature of relations among market traders, market associations, and the state, drawing attention to continued barriers to strengthening the voices of marginalized taxpayers.
Capacity, Resource, and Institutional Constraints
Understanding the day-to-day realities of market taxation first requires an appreciation of the stark capacity, resource, and institutional constraints confronting tax collection efforts. As in low-income countries generally, human and resource-capacity constraints in Ghana hamper local tax systems, with revenue collectors and supervisors demonstrating limited procedural, technical, or rights-based understanding of the local tax system. Rapid fiscal decentralization has likewise created challenges to the establishment of functional bureaucratic institutions, particularly at the subdistrict level; indeed, at the time of research several subdistrict councils and revenue offices in Yendi were not fully operational as a result of resource constraints. Footnote 7 Low wages for tax collectors, particularly relative to those of national collectors, exacerbate these challenges. Both salaried and commission-based collectors reported that low remuneration fuels their lack of motivation, while local government officials reported that this likewise creates challenges in attracting qualified individuals. Commission-based incomes are particularly vulnerable because of overall low revenue potential from small traders, as well as seasonal fluctuations in market activity and irregular payment schedules from the government office.
Administrative fragmentation and weak monitoring of tax collectors, particularly in subdistrict areas, exacerbates the issue of limited human capacity and enables informal practices. Neither Yendi nor Lawra sets revenue targets for subdistrict areas, while several subdistrict revenue collection offices were simply not monitored at all, reflecting both high monitoring costs and low revenue potential. Accordingly, district officers reported that subdistrict area councils often fail to remit revenue to the assembly for periods of four to six months at a time. A lack of monitoring, in turn, has enabled illegitimate tax collectors to extract revenue with virtual impunity from market traders in certain cases. Moreover, government tax collectors in these subdistrict regions have been reported to unlawfully extract taxes from itinerant traders traveling to the rotating periodic or central district markets. These traders thereby face double taxation—once at an informal checkpoint before leaving their home area, and a second time, lawfully, in the host market.
Finally, unclear tax legislation and unequal power dynamics amplify the tendency toward informality. Most obviously, the complexity and opacity of local government taxation, and market taxation in particular, have consequences for the uniform application of tax legislation. Distinct market fees are charged for every conceivable commodity, generating a poor understanding of the tax legislation among both taxpayers and tax collectors and enabling ample space for arbitrariness and negotiation in the setting of rates. Meanwhile, given the weakness of local capacity, politically influential individuals can circumnavigate bureaucratic processes or pressure tax officials to lower or overlook their tax assessments, with negative implications for the horizontal equity of the tax regime. Footnote 8
Moral Economy, Power Relations, and the Reality of Local Market Taxation
The formal institutional environment for tax collection is thus characterized by bureaucratic weakness and significant scope for discretion. The result, however, is not a simple proliferation of arbitrary enforcement and corruption. Instead, we find that socially embedded norms and informal practices govern outcomes “in the shadow” of weak formal institutions, dictating relatively consistent divergence from formal policy. These informal practices, driven by local economic realities and accepted notions of fairness, may have positive implications for social welfare and horizontal equity. However, underlying power dynamics and social hierarchies also shape informal norms in practice, limiting their equalizing potential.
At a basic level, the official tax system may be too inflexible for variable and unpredictable local economic realities. Central government representatives generally assume that taxes and fees on the poorest segments of the populations are so low as to have a negligible impact on taxpayers. However, while local market taxes may be modest in absolute terms, they often represent a significant and steady burden on highly variable, seasonal, and insecure incomes. Footnote 9 Correspondingly, front line officials often adopt informal practices, driven by social norms of fairness, to soften the impact of blunt formal tax instruments. For instance, while local collectors are mandated to collect market fees daily, tax collectors in Lawra are reported to be “sympathetic” to traders during the seasonal market downturn, collecting market fees less frequently during the rainy season. By understanding the reality that in a bad season a fixed tax applied with “blind rigor” is, in effect, “an expanding proportional claim on . . . diminishing resources” (Scott Reference Scott1976:52, 92), local tax collectors are able to make tax rates more sensitive to actual profits than is permitted by statutory rules. Moreover, in practice collectors apply relatively standardized informal exemptions for, most notably, the elderly, disabled, recently widowed, and mothers of young twins. For example, taxpayers and tax collectors in Yendi market relayed the example of an elderly trader who is no longer asked to pay tax, as collectors “take pity on her” because she is “tired,” with collectors simply moving along to “stronger women.” The majority of traders support these informal exemptions, which represent socially sanctioned ways through which frontline officials enhance the progressiveness and legitimacy of the local tax system.
Further, tax collectors in both districts described their hesitancy to enforce penalties, which are fixed regardless of the tax rate in question and can be as high as fifty times the original rate (LDA 2009). Local tax collectors were reported to be lenient toward traders making little profit, allowing them to make up for missed payments at future collections, taking goods in lieu of payment, or simply ignoring tax obligations. Other traders generally do not perceive these forms of evasion negatively. For example, traders explained that in certain instances it may even be fair for other traders to hide from collectors, as these women may simply be trying to ensure that they have enough money to pay for their trips home and to feed their families.
Social norms of fairness also inform local understandings of acceptable forms of “corruption.” While tax compliance theory suggests that corrupt tax collectors or uneven tax enforcement may lower tax morale by reducing perceptions of fairness (e.g., Fjeldstad Reference Fjeldstad2004; Fjeldstad & Semboja Reference Fjeldstad and Semboja2001), taxpayers largely accepted forms of petty corruption among tax collectors. Traders explained that due to low commission rates, it is fair for collectors to keep a little extra for themselves, or to “chop small.” Footnote 10 As several female traders from the Lawra market explained, “everyone eats at work.” This is not to say that all forms of “corruption” were deemed acceptable: traders frequently condemned efforts to extract large sums from those who could not pay, or the tendency of some collectors to extract additional revenues from illiterate or foreign women, as discussed below. Indeed, this kind of intolerance is a further indication that practices in the market, and notions of what constitutes “corruption,” are socially embedded within local logics and norms (Olivier de Sardan Reference Olivier de Sardan1999), implying a subjective and context-specific understanding of legality and legitimacy.
A general principle of reciprocity underlies these social norms (Olivier de Sardan Reference Olivier de Sardan2008; Scott Reference Scott1976). From one side, the chief revenue collectors in both districts explained that they are hesitant to enforce the relatively severe penalties for tax evasion, as their capacity to encourage tax compliance is underpinned by social relationships with taxpayers, and it would be undermined if they violated social norms of fairness. Conversely, taxpayers described sympathy for collectors and a desire to pay whenever they are able in order to help collectors “avoid trouble” with their supervisors. For instance, a woman selling beans from a low stool in the Yendi market explained that if she pays her market fee, it leaves both her and the collector free to do their jobs. The willingness of collectors “to go and come” is particularly valued by traders, given the unpredictability of their daily solvency, and it was central to traders’ feelings of solidarity and reciprocity with them. In Lawra, where taxpayers are relieved of daily tax obligations during seasonal downturns, taxpayers showed an appreciation for local tax collectors and a willingness to pay in order to make collectors’ jobs as easy as possible. Put most broadly, when taxpayers voluntarily comply with tax demands, there is tacit consensus that collectors will be more understanding to taxpayers when they are unable to pay.
Alongside these norms of reciprocity, underlying social relations and behavioral expectations shape tax compliance. Taxpayers described a willingness to comply with tax payments in order to avoid disrupting the social order, to “keep the peace” within the market, to avoid public embarrassment, or to maintain good relations with tax collectors, whom traders in Lawra described as the community’s “brothers” and “sons.” Traders in Lawra described their willingness to pay tax in order to avoid the “penalty” of the collectors “not being happy with them” or having collectors embarrass them in front of their peers. In Yendi market some traders explained that a “penalty” of not paying the market tax is perceived by other traders as disruptive or “antisocial.” This is consistent with what Clark (Reference Clark2010b) describes as the “need to keep trade running smoothly”—a collective desire within the market that ensures compliance with informal agreements and norms. These social pressures, of course, are closely intertwined with economic motives: for instance, traders in both Lawra and Yendi explained that being labeled as disruptive or “antisocial” carries important economic costs associated with a loss of reputation (see also Cleaver et al. Reference Cleaver2013).
A comparison of taxpayer perspectives about national and local tax collectors offers a further window into the particular role that norms of fairness, reciprocity, and social obligation play in local market taxation. Within our case districts, taxpayers clearly distinguished local tax collectors from their national counterparts, who are often from different regions and ethnic backgrounds and are more likely to be perceived as “strangers,” thus not fitting within local networks of reciprocity, exchange, and solidarity. Footnote 11 Traders perceive local tax collectors as more responsive to local economic and social realities, whereas national tax collectors represent an inflexible application of tax legislation, providing less opportunity for informal tax settlements, little leniency with regard to nonpayment, and a stricter application of penalties (see Atuguba Reference Atuguba2006). Reflecting a common experience among traders, a batik seller in Yendi said she had no issues with local collectors, but described GRA collectors as being less understanding, unfriendly, “harsh,” “quarrelsome,” and more willing to lock her store or confiscate her goods. Unsurprisingly, taxpayers in both case districts reported less willingness to pay taxes to national collectors.
A final component in understanding these informal norms and practices is the enduring role of the chieftaincy in tax collection. Footnote 12 Though indirect involvement by chiefs in tax collection is not mandated by legislation, and direct taxation on their part is constitutionally barred (GoG 1992:Art.174.1), the capacity of local governments to extract revenues often remains dependent on the unofficial involvement of traditional authorities. At the same time, direct collection of informal “taxes” by chiefs remains common—for instance, to provide for seasonal harvest festivals or community-based projects (Agyemang Reference Agyemang2011; Atuguba Reference Atuguba2006; Jönsson Reference Jönsson2009; Rathbone Reference Rathbone1999). These taxes are based, in principle, on a reciprocal relationship with taxpayers: chiefs receive taxes in cash and kind, while taxpayers can then come to them to address disputes or to receive forms of social insurance in downtimes (Atuguba Reference Atuguba2006). Meanwhile, chiefs’ influence over formal tax compliance is rooted in their ability to shape popular perceptions of the legitimacy of local taxes, and of local governments more generally.
Chieftaincy support, or lack thereof, for government tax collection can often be understood as part of a broader struggle for local influence. In Lawra, the chieftaincy has provided support for tax collection by playing an important role in public tax education and sensitization campaigns. By contrast, chieftaincy efforts to undermine tax collection are much more prevalent in Yendi, where recent intrachieftaincy conflicts have negatively affected the relationship between the local government and chiefs. Indeed, during the localized conflict in Yendi in the early 2000s, and for many subsequent years, the local government faced major challenges in collecting local revenues because of unharmonious relations between the chiefs and the local government. Footnote 13 In other instances, chiefs have provided “social insurance” for their subjects by shielding them from local or national government collectors. The prominent role of chiefs, despite the absence of any legal standing in this domain, serves as a further illustration of the importance of informal norms in shaping tax practices.
However, while certain informal practices may at once reflect and engender a local moral economic order, the story is not uniformly positive. Just as informality can improve outcomes and yield greater cooperation, informal tax practices, rooted in existing local power dynamics, can reinforce social inequities and hierarchies (Cleaver et al. Reference Cleaver2013). In our case districts the most vulnerable groups in the market—including illiterate, itinerant, and foreign traders—were widely felt to receive less favorable treatment by tax collectors. For instance, traders accused local tax collectors, particularly at the subdistrict level, of taking advantage of illiterate and non-Ghanaian traders by charging them twice using the same tax receipt, charging higher rates than listed on the receipt, or giving them counterfeit tax receipts. In other instances, informal regulations are unevenly applied, based on the discretion of the tax collector. For instance, while exemptions were routinely made in Lawra for a pito brewer whose business was slow, kayakaya (market porters) and women selling small amounts of vegetables did not receive the same benefits, even though their self-reported profits were comparable. These porters and traders often had to borrow money from peers in order to pay the market tax.
In other cases, certain individuals enjoy informal privileges in the market, putting others at competitive disadvantages. For instance, larger traders renting district market stalls are often not required to pay daily market fees, making their cumulative monthly tax payments less than those of smaller traders who sit without a stall but are required to pay a daily market fee. In addition, politically connected traders, relatives of the local chiefs, and tax collectors’ family members are often informally exempted from market fees. Though one might expect negative taxpayer perceptions of these unofficial exemptions, the majority of traders simply accepted this practice as a fact of their social system.
The aggregate impact of these various informal practices is difficult to gauge precisely. Nevertheless, survey evidence from Carroll (Reference Carroll2011) indicates that the overall effect may be regressive, even when compared to an already regressive formal system. This is consistent with our findings: those in privileged positions appear to benefit most from special treatment, while informality often increases the vulnerability of those already on the margins. However, there are also substantial benefits for the majority of market traders arising from the greater flexibility associated with informality, including attention to income seasonality and special treatment for the elderly, disabled, and widowed. That is, the reality is consistent neither with a romanticized view of an informal moral economy nor with a legalistic approach that labels all forms of informality as corruption. In any case, the question of ultimate interest is not whether informality is, on balance, “good” or “bad,” since informality is in many ways an inescapable feature of local government taxation of market traders and small businesses. The more relevant question, to which we return below, is how to think about these systems, and their reform, in a way that is aligned with the reality of how they function in practice.
Market Traders, Market Associations, and the State
Beyond providing insight into the forces shaping tax collection, understanding the reality of market taxation offers a lens through which to consider the broader relationship between small taxpayers and the state. A growing literature argues that a critical motivation for more effective market taxation lies not in the (modest) revenue collected, but in the potential for tax collection to act as a catalyst for deeper engagement between market traders and the state, thus potentially fostering enhanced accountability (Joshi et al. Reference Joshi, Prichard and Heady2014). However, there is mounting recognition that this ideal outcome of “tax bargaining” is far from guaranteed: there are stark barriers to effective collective action by marginalized individuals, governments are frequently unresponsive in the face of low-level mobilization, and business associations themselves may be weak or internally undemocratic (Joshi & Ayee Reference Joshi, Ayee, Bräutigam, Fjeldstad and Moore2008; Meagher & Lindell Reference Meagher and Lindell2013; Prichard Reference Prichard2010). There is a corresponding need to better understand these barriers to effective collective action and potential areas of opportunity.
These obstacles to collective action are readily apparent in our case districts, where traders tend to be poorly organized and to demonstrate little understanding of the local tax system. Within our case districts, less than a fifth of all respondents (17%) reported knowing how their assembly spends tax revenues, while what was “known” was often inaccurate. For instance, the vast majority described local tax revenues as being used for community development projects, such as schools and roads, which are in fact funded by central government transfers or external grants, whereas almost all locally generated revenues fund only the administrative costs of the assemblies. The majority of traders in both case districts reported never having engaged with tax collectors or assembly representatives to discuss issues of taxation, never having attended a civic education program on taxation, and feeling that they do not have the right to ask questions of collectors or assembly representatives. The latter sentiment is particularly striking, and was reflected across the market interviews. A trader in Lawra explained that taxes “come from above,” and she simply does what is asked of her without question. A trader in the same commodity line reported her belief that she does not “have the right to ask what the government does with its money.” In Lawra itinerant traders were especially likely to reflect these sentiments: one woman explained that she did not have the right to question the tax collectors because “they are strangers” to her. Meanwhile, in Yendi a trader explained that she did not have the right “to bother the tax collector” about where the money goes; the tax collector allows her to trade in the market if she pays the market fee, and she should not demand anything more than that. A woman selling wholesale agricultural goods in the Yendi market reported being “scared to ask what they [the tax collectors] do with the money,” further explaining that it was not her “right to know.” Elsewhere in the Yendi market, a woman disdainfully explained that “Yendi is not like Europe: we can’t expect anyone to consult with us or explain why the government takes taxes.” Consistent with these statements, a majority (60%) of respondents did not feel well informed about why they pay taxes. That said, this proportion was 80 percent in Yendi, and only 36 percent in Lawra, suggesting, more optimistically, that markets can sometimes be sites for spreading information and engagement, as Lawra is home to a larger range of market associations and closer social ties between tax collectors and taxpayers.
While the potential for market associations to act as conduits for information is apparent, so too are the limits of these associations. None of the traders interviewed in Yendi were members of any association or cooperative. While 34 percent of respondents in Lawra reported involvement in associations, the majority were described as rotating savings and credit associations, rather than vehicles for political mobilization or engagement. For instance, expressing a common experience, a representative of the butcher’s association in Lawra explained that his group had set up a rotating savings and loan program, though he emphasized that the group has no connection to the local assembly or council and “no way to reach them.”
Though membership in “formal” associations is limited, markets throughout Ghana are also informally organized into a system of commodity-based groups. These groups may have a formal structure with officially recognized members, but they may also be defined more informally (Clark Reference Clark1991). These informal organizations are designed to offer mutual support for traders, including support in negotiating with government officials and chiefs, while they also serve to reinforce informal rules and sanctions within the market (Clark Reference Clark2010a, Reference Clark2010b). However, despite the well-established role of these informal organizations in Ghanaian markets, traders in both districts reported a lack of accountability on the part of association leaders. While research by Clark (Reference Clark1991, Reference Clark2010a, Reference Clark2010b) has pointed to the existence of informally institutionalized forms of internal and external accountability within commodity groups elsewhere in Ghana, our evidence reinforces the message that effective accountability is not universal or guaranteed—even in Lawra, which has been identified by other researchers as an example of relatively inclusive market governance around taxation (Carroll Reference Carroll2011). We found that market associations often lack inclusivity and internal accountability, while sometimes exacerbating social divisions and economic exclusion (see also Joshi et al. Reference Joshi, Prichard and Heady2014; Meagher Reference Meagher2010, Reference Meagher2013). Indeed, traders described associations as being dominated by politics among traders and leaders, which they viewed as negatively affecting the utility and sustainability of the groups. For example, a female trader in Lawra described a daily market association created to discuss issues, cooperate on trading strategies, and engage in a collective savings program. However, the group had dissolved amidst “politics among the women,” leaving the trader unsatisfied and reluctant to start or join another association.
We similarly did not find evidence in our case districts of associations or commodity groups serving as effective links to the local government (see also Owusu & Lund Reference Owusu and Lund2004). Indeed, traders reported that the association leaders, or “market heads,” had no clear channels of access to the assembly, while traders did not perceive them as direct routes to information or accountability. This was more apparent in Yendi, where the Yendi Cooperative Food and Farming Market Society, the primary market association, has a limited number of members, with unclear information diffusion strategies within the market and unclear representation, despite having an assemblyman on its committee. These connections are somewhat stronger in Lawra, home to a larger number of formal associations as well as direct communication channels to the district assembly through the Lawra District Union, which represents sixteen cooperatives and three hundred members across the district. However, even the union’s executive secretary explained that these communication channels offer limited substantive engagement with the assembly and are largely ineffective in practice, while taxpayers complain that they often do not receive even basic tax information through the associations. Footnote 14
The weakness of links among taxpayers, market associations, and the government is most clearly illustrated by the process for approving the annual fee fixing resolution, which sets local tax rates. In both districts, assembly finance officials described the process as being fair and inclusive, with representatives of market associations both contributing to policy formulation and communicating the fee fixing resolution to their members. However, the Yendi external auditor of the Ghana Audit Service explained unequivocally that the resolution is set, in fact, without consultation with the market traders or their associational representatives. The same reality was reported in Lawra. Footnote 15 Meanwhile, traders and tax collectors provide regular reports of market heads’ failing to communicate the fee fixing resolution to group members, with tax collectors explaining that this makes their job more difficult by increasing the hostility of traders toward them.
While this overall picture is discouraging, there are scattered examples of more effective relations between associations and the local government. For example, a small number of associations in both districts have negotiated tax rates with the assembly or chief and collected revenue on behalf of these authorities. The seamstress association in Lawra collects payments on behalf of the local government from its members and has negotiated down the rate its members pay to the district assembly for business licenses. In Yendi the aforementioned market cooperative assists revenue officers in collecting the tax on export foodstuffs, earning a commission for doing so. Meanwhile, more informally, a pito brewers’ association in Lawra successfully negotiated with the local chiefs in order to absolve its members of the obligation to contribute informal taxes for the annual Kobine (harvest) festival when business was slow.
However, even where such bargains have been struck, they are best understood as pragmatic ventures rather than as avenues for expanded taxpayer engagement with the local government, since there is no evidence that these forms of “associational taxation” have led to greater political mobilization or accountability in other areas. Tellingly, the executive secretary of the Lawra Cooperatives Union was not aware of any revenue mobilization partnerships with associations in the district, despite their existence in practice. Association members, for their part, do not generally view engagement with the local government as a critical role for associations, which are first and foremost expected to keep trade flowing in the market and to support members in ceremonial and social activities (see Owusu & Lund Reference Owusu and Lund2004; Clark Reference Clark2010a, Reference Clark2010b).
Formal Rules, Informal Realities, and Implications
Ultimately, the local tax systems in Lawra and Yendi have underperformed relative to many of their core objectives: they are characterized by weak collection, negotiation of rates, widespread leakages, and ineffective monitoring. Seen through a technocratic lens, addressing these challenges is a relatively straightforward matter, and to some extent is already reflected in reform developments throughout Ghana. These include the creation of new monitoring frameworks and requirements, an extension of the reach and authority of the national revenue agency, rotation of national staff to avoid collusion between taxpayers and officials, aggressive penalties for noncompliance, and an overall drive toward legal rationality.
However, the realities of local government taxation suggest that these approaches, taken in isolation, may have limited success and potentially be counterproductive. Improved monitoring may yield some benefit, but the limited potential revenues from small traders and the distances involved in monitoring subdistrict areas virtually ensure that face-to-face interactions and informal norms will remain pivotal to actual outcomes. Moreover, there is little evidence to suggest that harsh penalties, the rotation of staff, and the extension of the power of the GRA have led to improved collection; on the contrary, it is clear that in many cases these efforts have served to breed mistrust between taxpayers and the government. Meanwhile, standard reform proposals frequently fail to acknowledge the equity benefits that may arise from existing informal norms or to recognize the ways in which unequal local power dynamics can distort the intended goals of reform.
The implication is that a more productive approach to understanding and strengthening local taxation would acknowledge inescapable local constraints, attempt to work “with the grain” of existing practices, and seek to embrace the benefits that can arise from informality, while curbing the worst excesses of these systems. In this context, more careful attention to three areas in particular stands to yield a fuller understanding of local taxation, and local governance more broadly: the role of market associations, the role of traditional authorities, and the relationship between central and local government authorities.
Local Market Associations
In seeking to strengthen local government tax collection from market traders and small businesses, a few basic facts loom large. First, limited state resources mean that the ability of governments to monitor frontline collection is likely to remain limited, with collection correspondingly shaped by informal norms. In addition, taxpayers frequently express a willingness to pay more taxes in return for greater transparency and greater reciprocity from government. Finally, while local governments claim to work with local market associations in order to develop policy, monitor collection, and transmit information to taxpayers, evidence from our research makes clear either that these claims are disingenuous or that these efforts are undermined by weak ties between the formal representatives of market associations and the majority of traders.
Taken together, these realities suggest a potentially important role for local market associations in shaping local taxation, and governance more broadly. In principle, closer engagement with empowered market associations offers an informal mechanism for both monitoring tax collection and strengthening accountability. At one extreme, research has documented the potential for partnering directly with informal associations in collecting revenue from their members (Joshi & Ayee Reference Joshi, Ayee, Bräutigam, Fjeldstad and Moore2008; Joshi et al. Reference Joshi, Prichard and Heady2014). However, even less formalized arrangements offer associations the opportunity to play an important role in ensuring rules-based collection, while retaining some scope for frontline negotiation and flexibility. Furthermore, strengthening market associations has the potential to facilitate collective action and bargaining by otherwise vulnerable and isolated traders, which may allow for greater reciprocity and trust between taxpayers and governments.
The long history of formal and informal market associations, and of commodity market groups, lends credence to the idea that they can be effective channels through which taxpayers connect to their local governments. However, some existing research has noted that market associations can sometimes reinforce existing inequalities rather than creating broader opportunity (e.g., Joshi & Ayee Reference Joshi, Ayee, Bräutigam, Fjeldstad and Moore2008; Meagher & Lindell Reference Meagher and Lindell2013). The case studies here yield a similar message, as associations in Lawra and Yendi have often failed to play the constructive role that is sometimes ascribed to them in existing debates about taxation and accountability. There is a corresponding need to think more systematically about the role and potential of these types of associations in facilitating local collective action and effectively connecting citizens to local governments.
Traditional Authorities
While our account points to the limits and complexity of popular engagement with local tax systems, it also makes clear that effective tax collection depends to a significant extent on informal relationships, the support of powerful local brokers, and quasi-voluntary tax compliance among traders. This is consistent with research finding that effective tax collection is dependent to a significant degree on the perceived fairness and accountability of local government (Bodea & Le Bas Reference Bodea and LeBas2016; Ali et al. Reference Ali, Fjeldstad and Sjursen2013). However, our account goes beyond much existing research in underlining the fact that the legitimacy of the tax system is frequently dependent not only on formal rules, but at least equally on informal governance dynamics.
The importance of informal dynamics is most striking in relation to traditional authorities. In Ghana, the chieftaincy is vital to shaping the legitimacy of local taxation, given its historical tax collection authority and continued informal influence over tax compliance (Atuguba Reference Atuguba2006; Agyemang Reference Agyemang2011; Rathbone Reference Rathbone1999). Particularly within subdistrict area councils, revenue collectors are largely unable to mobilize revenue from taxpayers without the tacit support of the local chief. While this authority can be used to support the local government, it can also be used to undermine tax collection and government legitimacy. Further, there are clear risks that the chieftaincy may be unaccountable and may reinforce existing hierarchies and regressive patterns of tax collection. Ultimately, this account thus serves to highlight the important role played by chiefs in shaping local tax systems, though it also makes clear the significant scope for further exploration of the potential roles of informal traditional authorities in building stronger and more accountable local tax systems. Footnote 16
Taxpayer Relations with Central and Local Government Authorities
Finally, our account highlights the importance of understanding taxpayer relations with government officials, and the particular distinction that taxpayers make between local and central government officials. The GRA has focused on employing “outsiders” as local tax collectors in order to reduce the scope for collusion between taxpayers and tax collectors. This is an intuitively useful strategy, and it does appear to yield short-term gains in the form of somewhat stricter enforcement. However, our investigation, and anecdotal evidence elsewhere, suggests potentially significant longer-term costs, as modest revenue gains are offset by the emergence of a more adversarial relationship between external tax collectors and taxpayers.
Interviews with small taxpayers in Lawra and Yendi make clear that they have dramatically better relationships with local tax collectors. This relationship does not appear to reflect the simple absence of enforcement, but the greater flexibility of local tax collectors in responding to the often very real livelihood constraints faced by precarious small traders. There seems a strong likelihood—though one that warrants further research—that this more trusting relationship with tax collectors may have broader implications for perceptions of the legitimacy of the state. The consequence is that the technocratic instinct toward strengthening collection through coercion by more autonomous tax collectors may be self-defeating, with any short-term revenue gains more than offset by often overlooked impacts on trust in the state and on the extent and flexibility of the actual tax burden borne by the poor. This finding reinforces a key message from the broader literature: Seemingly intuitive technocratic interventions may fail if they do not account for the often more informal dynamics of everyday practice (e.g. Booth Reference Booth2011; Kelsall Reference Kelsall2011; Olivier de Sardan Reference Olivier de Sardan2008).
Conclusion
The weakness of local government tax collection in low-income countries is by now well documented, as are a relatively standard set of policy and administrative reforms designed to yield improved outcomes. However, to date, progress in achieving improved outcomes has been slow. These poor outcomes can be traced to a wide variety of causes, including uncommitted local reform leadership, limited resources, and a lack of support from central governments. To this story we have sought to add another, subtler element: the need to better understand the social foundations of tax collection in resource constrained and comparatively marginalized local government areas. We have argued that an acknowledgement of the inescapable resource and capacity constraints facing many local governments, and of the correspondingly critical role of informal practices in shaping outcomes, offers a significantly different understanding of the nature of local government tax challenges.
Our findings underline the need for greater openness to the potential value of “hybridity” in the governance of local taxation, particularly among marginalized groups. “Hybridity” seeks to maximize the benefits that can emerge from reliance on flexible local systems, while minimizing the risks that powerful interests will capture informal processes, thereby reinforcing existing inequalities. The latter point is critical, as informal norms can generate improved governance outcomes, but only if supported by proactive efforts that ensure that marginalized groups participate in shaping these informal practices (Cleaver et al. Reference Cleaver2013). Such efforts stand not only to improve the equity of tax outcomes, but also, potentially, to strengthen the ability of marginalized taxpayers to engage in broader bargaining with local governments.
Acknowledgments
The International Centre for Tax and Development provided funding for this research. We are grateful to Shandana Khan Mohmand, Giulia Mascagni, and two anonymous reviewers for providing useful comments and feedback. We are also grateful to the Local Government Service Secretariat and the Ministry of Local Government and Rural Development, as well as Christian Aid Ghana—Rebecca Dottey in particular—for providing invaluable support during fieldwork.