Introduction
Papaya (Carica papaya Linnaeus) is an important tropical fruit marketed worldwide, with most production occurring in a few countries – in particular, India and Brazil (Pathak et al. Reference Pathak, Mandavgane and Kulkarni2019). Although Brazil has extensive planted areas and a favourable climate for the year-round production of papaya, phytosanitary problems, including the occurrence of fruit flies (Diptera: Tephritidae), can limit the export of fruits. Among the main species of fruit fly in Brazil, 121 members of the genus Anastrepha that are native to the Americas occur in the country (Zucchi and Moraes Reference Zucchi and Moraes2021). Of note among the pests causing serious quarantine-related problems for papaya exports are Anastrepha fraterculus (Wiedemann, 1830), a native polyphagous species, and Ceratitis capitata (Wiedemann, 1824), an exotic species recorded in Brazil in 1901 (Martins et al. Reference Martins, Alves and Zucchi1993; Martins and Fornazier Reference Martins and Fornazier2014). A successful management programme using a systems approach was implemented in Brazil in the 1990s to enable the export of papaya to the United States of America. The systems approach involves the integration of actions during the pre- and postharvest periods to improve production, harvesting, packaging, and transport of a commodity that meets quarantine-security requirements (Martins et al. Reference Martins, Ventura, Lima, Culik, Costa and Ferreira2012). Essential to this type of programme is the monitoring of fruit fly abundance and richness.
Knowledge of the abundance of fruit flies and of the distribution patterns of species richness is essential for pest management programmes because analysis of this information allows the pest-infestation period to be evaluated, critical areas for planting to be identified, and scenarios for implementation of control measures by harvest management, by release of control agents, and by management and conservation of the diversity of natural enemies of the flies, to be developed (Lundgren and Fausti Reference Lundgren and Fausti2015).
In this study, we investigated the patterns of richness and abundance of Anastrepha, analysed through time, space – expressed by the distance of papaya orchards from an Atlantic forest remnant – and area size. The patterns of richness and abundance of the fruit flies were also analysed based on meteorological data. The analyses were based on a full time series (1998–2010) and four partial series within the full series to investigate the impact of the systems approach programme on fruit fly richness and abundance in commercial papaya production fields.
Materials and methods
Dataset
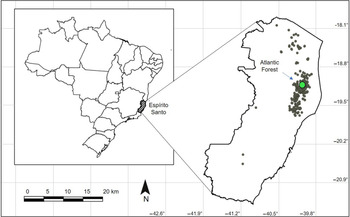
The dataset used in this study is part of a project entitled “Survey of fruit flies in the state of Espirito Santo, Brazil”, coordinated by the Instituto Capixaba de Pesquisa, Assistência Técnica e Extensão Rural. Data were obtained via weekly monitoring using one McPhail trap every two hectares at different georeferenced points (18° 02ʼ 35.7" to 20° 33ʼ 58.3" S and 39° 13ʼ 00.7" to 41° 09ʼ 16.1" W) in papaya orchards in commercial production fields of Espirito Santo, Brazil (Fig. 1) from 1998 to 2010. This is the main production area in the state for papaya export. We investigated the richness and abundance of a pool of species of Anastrepha. The distance between each orchard and the forest remnant was established, based on the same point within the forest fragment (19° 59ʼ 04" S and 39° 55ʼ 24" W), a central area located in the Reserva Natural Vale, which is a protected Atlantic forest remnant with high biodiversity within approximately 23 000 ha. Annual mean rainfall, temperature, and relative humidity were obtained from the Instituto Capixaba de Pesquisa, Assistência Técnica e Extensão Rural to evaluate the influence of these factors on fruit fly richness and abundance.
Maps of fruit fly collection sites in the state of Espirito Santo, Brazil, 1998–2010.

Time series and the systems approach
The time periods consisted of a full time series of fruit flies in papaya orchards, from 1998 to 2010, and four partial time series, two of which include data from the beginning of the systems approach implementation and the other two of which include data showing the impact of the systems approach on fruit fly abundance and diversity. The first partial time series, 1998–2005, was analysed for fruit fly species richness. The second time series, 1998–2003, was analysed for fruit fly abundance. The third time series, 2006–2010, was analysed for fruit fly species richness, and the fourth partial time series, 2004–2010, was analysed for fruit fly species abundance. In the four series, richness and abundance were analysed separately because the systems approach affected species abundance and richness at different times. For convenience, we named the 1998–2005 series – the first partial time series analysed and the period during which management actions were implemented but were not yet yielding observable effects on richness and abundance – “the continuous implementation of systems approach”, and we named the two partial time series between 2004 and 2010 “impact on richness” and “impact on abundance” because these periods showed visible impacts on richness and abundance, respectively.
Data analysis
The results indicated that the relationship between richness or abundance and rainfall, temperature, and humidity followed a normal distribution. A multiple regression then was employed to analyse the significance of the relationships between richness or abundance and those three environmental variables. The distribution of richness and abundance in time or at distance between the papaya orchards and the Atlantic forest remnant did not follow a normal distribution. We therefore used generalised linear models with Poisson errors to analyse the relationship between fruit fly richness or abundance and time or distance between papaya orchards and the forest remnant.
Nonlinear models fitted to the data
We used the R package “sars” to fit 19 SAR models describing convex and sigmoid shapes (Matthews et al. Reference Matthews, Triantis, Whittaker and Guilhaumon2019) aiming to find the best model shape to describe the relationship between fruit fly richness and area, by comparing information criterion weights using a barplot. Nonlinear and linear regressions (CRAN, version 1.1.1; R Core Team 2020) were also used to investigate the relationship between the explanatory variables (time or distance) and the response variables (abundance or richness) and to test the significance of the relationship between them. The Akaike information criterion was used to compare the best fit of the regression models to the data.
Richness-partitioning analysis
In this study, beta diversity was partitioned at three scales – area, ecoregion, and geographic region – to understand the degree to which different area sizes could explain the changes in richness over different time periods and to compare the impact of the systems approach on beta diversity. Within insect communities, often only a fraction of species are capable during dispersal of reaching regions that are more distant than others due to resource availability. However, this distribution may not be obvious because of the intense movement of insects among orchards, thereby requiring beta diversity – partitioning procedures to consider the possibility of the richness being other than that directly observed via trapping. Other factors besides area size may also significantly influence fly movement and, consequently, species richness. For example, host plant diversity and spatial scale have been listed as causes of richness variation in a tephritid community (Dinis et al. Reference Dinis, Prado and Lewinsohn2010).
The spatial scale used to analyse beta diversity can influence species-richness estimates. This happens mainly when species diversity is linked to host richness, which would require insects to travel more and colonise habitats at greater distances (Wagner and Edwards Reference Wagner and Edwards2001; Kemp and Ellis Reference Kemp and Ellis2017). In addition, human-caused disturbances on landscapes at different scales have also been shown to influence plant richness and tephritids (Dinis et al. Reference Dinis, Prado and Lewinsohn2010). The total number of species in all areas of the present study was described as γ. The mean richness of the areas studied was represented by
 $${\bar{\alpha}}$$
and was associated with area size. In that way, the reason why species were missing in specific areas could be associated with area size. The term “β
area
” was an estimate of the mean difference between
 $${\bar{\alpha}}$$
and the diversity predicted for the largest area. Generally, β contains both β
area
and β
replace
, with the latter term determining the mean number of species missing due to factors other than area size (Henry and Stevens Reference Henry and Stevens2009). The partitioning can then be described as
 $$\beta = {\beta _{area}}{\rm{\ +\ }}{\beta _{replace}}$$
, where
 $${\beta _{replace}}$$
is the mean number of missing species that are not explained by patch size. In the present study, β
replace
was classified as β
ecoregion
and β
geogr.region
to evaluate the richness response to different spatial scales. The parametric space “ecoregion” denotes a biogeographic regionalisation of terrestrial biodiversity, and the parametric space “geographic region” is defined as a biodiversity hotspot characterised by high species diversity (Reid Reference Reid1998). In the context investigated in the present study, the full partition can be viewed as γ = β
area
+ β
ecoregion
+ β
geogr.region
(Henry and Stevens Reference Henry and Stevens2009), where
 $${\beta _{replace}} = {\beta _{ecoregion}} + {\beta _{geogr.region}}$$
.
Time series and peaks
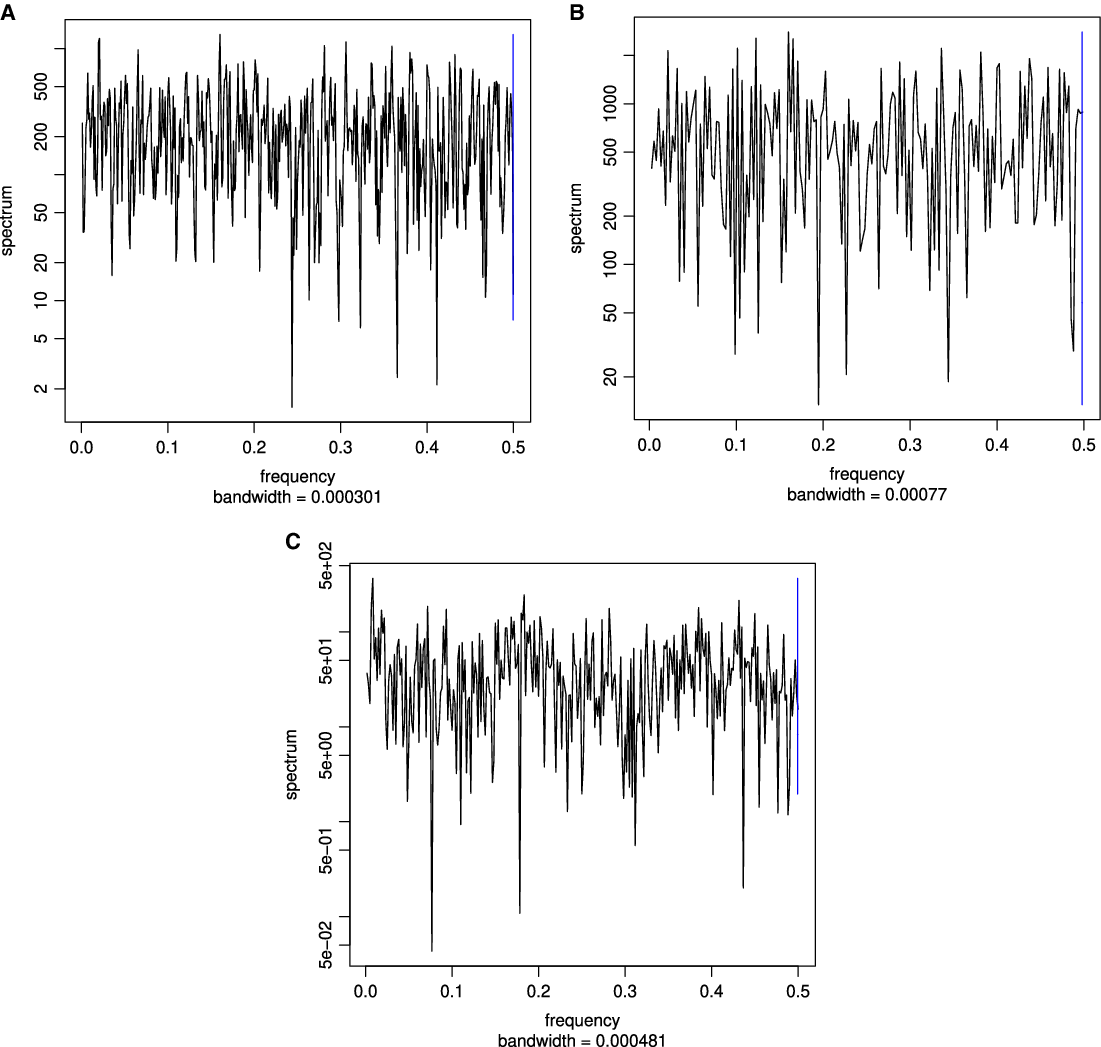
Periodograms were developed to evaluate the presence of potentially recurring peaks, based on comparisons among spectrum values. Spectrum values are useful when comparing the potential for new population peaks after a previous occurrence, based on frequencies rather than fluctuations of numbers, thereby producing a periodogram (Crawley Reference Crawley2013). For specific cases such as the dynamic series, 10-year cycles would have a frequency of 0.1 per year. The result of the analysis is a plot-on-log scale, in units of decibels, with the frequency (x axis) indicating the bandwidth, and 95% confidence interval in decibels shown by a vertical bar in the top right-hand corner (Crawley Reference Crawley2013). The interpretation of the result indicates that, at the maximum value where the spectrum takes place, cycles could occur. For example, if the value is 0.1, the result would show cycles with a period of 1/0.1 = 10 years. Longer cycles for frequency 0.05 would result in cycles of length 1/0.05 = 20 years.
Results
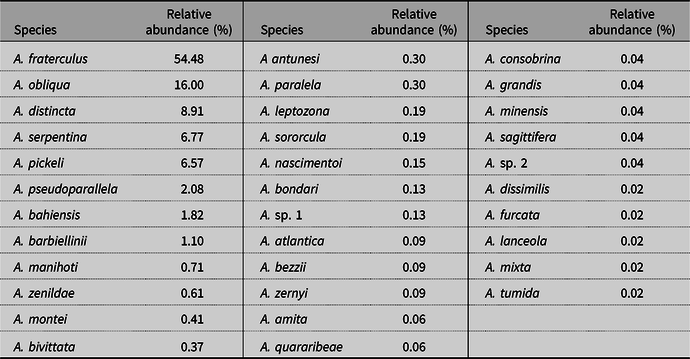
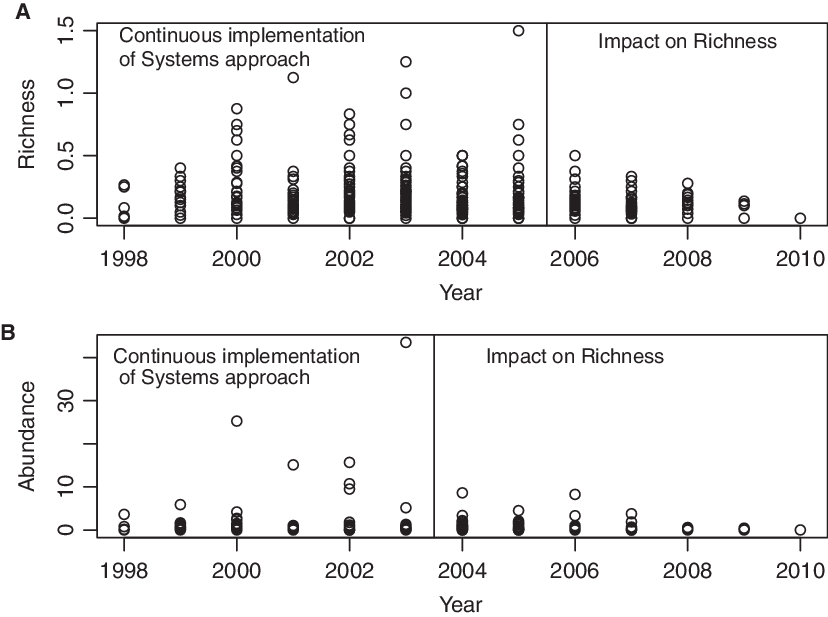
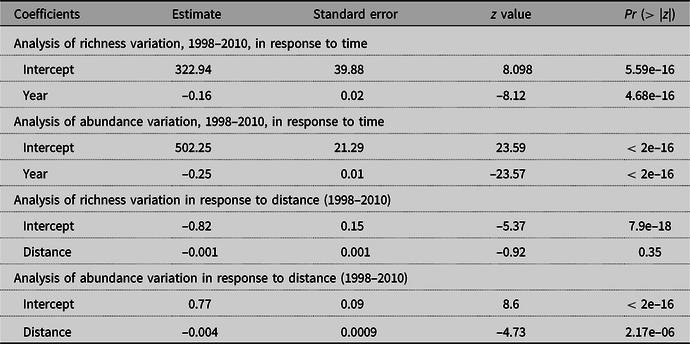
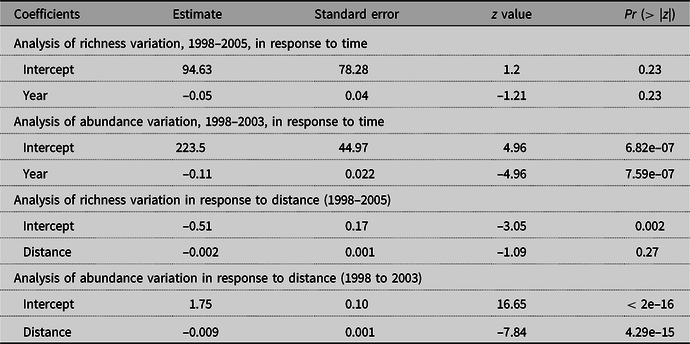
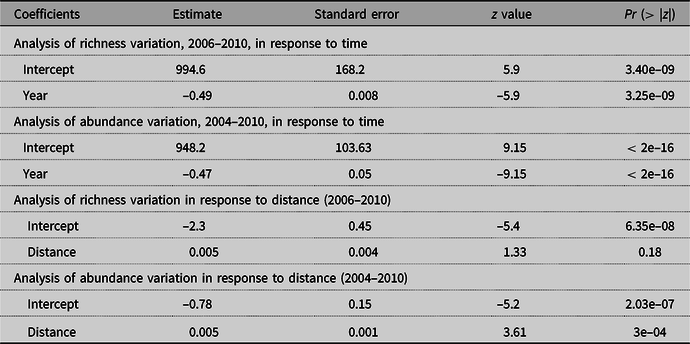
A total of 34 species was obtained during the 13-year series, with Anastrepha fraterculus and Anastrepha obliqua (Macquart, 1835) showing the highest abundance, comprising 54.48% and 16% of the specimens obtained, respectively (Table 1). Among the variables (rainfall, temperature, and relative humidity) evaluated with respect to their influence on richness and abundance, only relative humidity showed a positive relationship with richness (t = 2.826, P = 0.0199). Our results indicate an initial increase of richness and abundance during the period of continuous implementation of the systems approach, followed by a decrease after 2005 for richness and after 2003 for abundance – periods characterised by the impact on richness and on abundance when observing the dispersal of points (Fig. 2A, B). Fruit fly richness and abundance varied significantly over time from 1998 to 2010 (Table 2). Table 2 also shows the variation in richness and abundance in response to distance between the papaya orchards and the Atlantic forest remnant, with significant variation occurring only for abundance. The two subseries, 1998–2005 and 1998–2003, which were analysed for richness and abundance over time, respectively, indicated a significant relationship for abundance but not for richness (Table 3). The same result was observed for the distance between papaya orchards and Atlantic forest remnant (Table 3). The two subseries, 2006–2010 and 2004–2010, analysed for richness and abundance, respectively, indicated a significant relationship with time for both richness and abundance (Table 4), but with respect to distance, only abundance showed a significant relationship (Table 4).
Relative abundance of Anastrepha fruit fly species in papaya orchards in the state of Espírito Santo, Brazil, from 1998 to 2010.

A, Richness and B, abundance of Anastrepha fruit flies per hectare, 1998–2010, in papaya orchards in the state of Espirito Santo, Brazil, based on the effect of the systems approach and its impact on the richness and abundance of flies.

Regression with Poisson errors based on species of Anastrepha richness and abundance variation in response to time and distance among papaya orchards and Atlantic forest remnant.

Regression with Poisson errors based on species of Anastrepha richness and abundance variation in response to time and distance among papaya orchards and Atlantic forest remnant.

Regression with Poisson errors based on species of Anastrepha richness and abundance variation in response to time and distance among papaya orchards and Atlantic forest remnant.

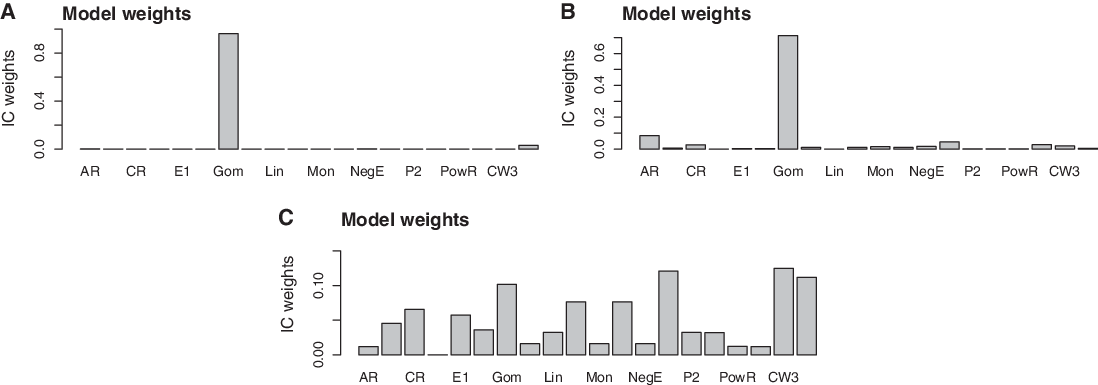
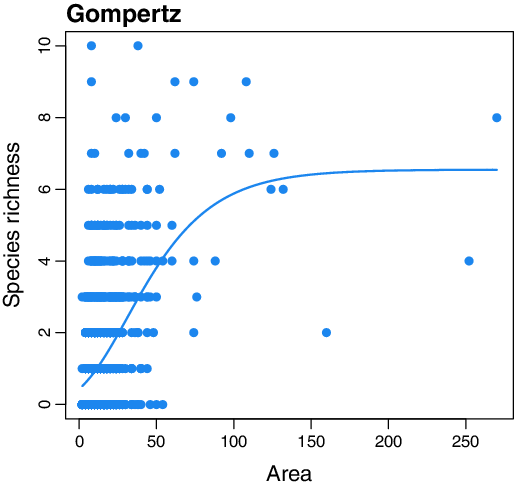
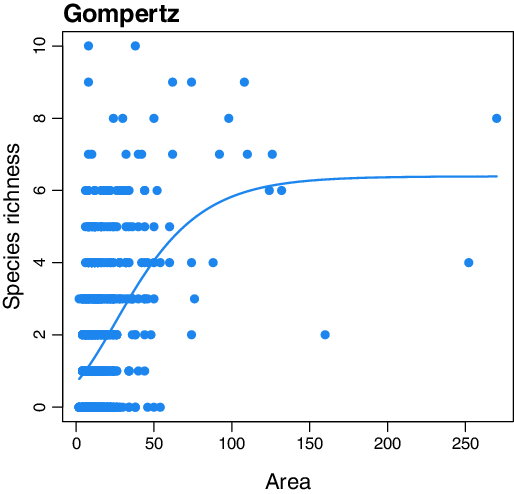
The information criterion weights were investigated for 19 mathematical functions describing model curve shapes (Fig. 3). The barplot for the full series (1998–2010) with respect to species richness per area shows the performance of the functions by comparing their respective information criterion weights (Fig. 3A). The Gompertz model was the function showing the highest information criterion weight (Fig. 3A) and the lowest Akaike information criterion (921), and the Weibull4 model showed the next highest information criterion weight, with Akaike information criterion equalling 927. The distribution of richness values in response to area sizes indicated that higher richness frequency was observed in areas below 50 ha. The Gompertz function yielded 6.55 as the theoretical estimate of richness (Fig. 4).
Barplot of the IC weights of 19 different models for the time series A, 1998–2010, B, 1998–2005, and C, 2006–2010, emphasising Anastrepha species richness per area size, with the Gompertz model (Gom) showing the highest information criterion weight. AR, asymptotic; BP, beta-P; CR, Chapman–Richards; Loga, logarithmic; E1, extended power 1; E2, extended power 2; Gom, Gompertz; Kob, Kobayashi; Lin, linear; Hel, logistic; Mon, monod; MMF, Morgan–Mercer–Flodin; NegE, negative exponential; P1, Persistence function 1; P2, Persistence function 2; Pow, power; PowR, power Rosenzweig; RF, rational; CW3, Weibull-3; CW4, Weibull-4.

The fit (solid line) of the Gompertz model to data for Anastrepha fruit fly richness (solid circles) in different area sizes in the state of Espirito Santo, Brazil, 1998–2010.

The barplot for the first subseries, 1998–2005 (the period of continuous implementation of the systems approach), shows the performance of the functions by comparing their respective information criterion weights (Fig. 3B). The Gompertz model also showed the highest information criterion weight, and its Akaike information criterion was 722, a lower value than the asymptotic model, for which the Akaike information criterion was 727, and the Persistence function 1, for which the Akaike information criterion was 728 (Fig. 3B). The distribution of richness values in response to area sizes indicates that higher richness was also observed in areas below 50 ha. The Gompertz model resulted in a theoretical richness of 6.39 (Fig. 5).
The fit (solid line) of the Gompertz model to data for Anastrepha fruit fly richness (solid circles) in areas of different sizes in the state of Espirito Santo, Brazil, 1998–2005.

The barplot for the subseries 2006–2010 did not clearly indicate a specific model to fit the curve to these data as observed in the previous series, although Weibull3 (CW3) showed the highest information criterion weight (Fig. 3C). The Akaike information criterion values were close to each other, showing the following values for the four models with the highest information criterion weights: for Weibull3, the Akaike information criterion was –2.75; for Persistence function 1 (P1), the Akaike information criterion was –2.69; for Weibull4, the Akaike information criterion was –2.53; and for the Gompertz model (Gom), the Akaike information criterion was –2.34. Figure 3C shows all functions’ fit, except that of Persistence function 1 because its model shape is convex and not sigmoid as with Weibull3, Weibull4, and Gompertz. In addition, the Persistence function 1 exhibited theoretical richness that was less than 0.5 – a value much lower than the other models – probably in response to its convex shape.
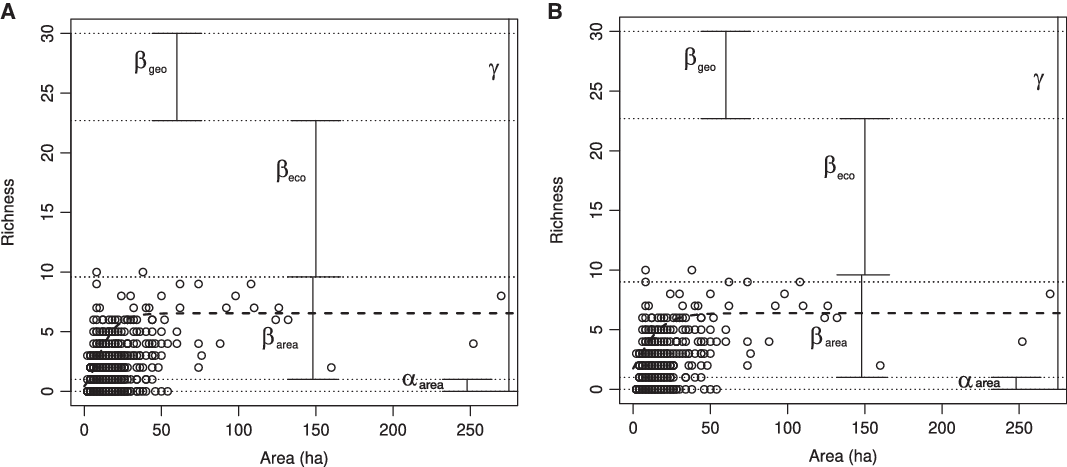
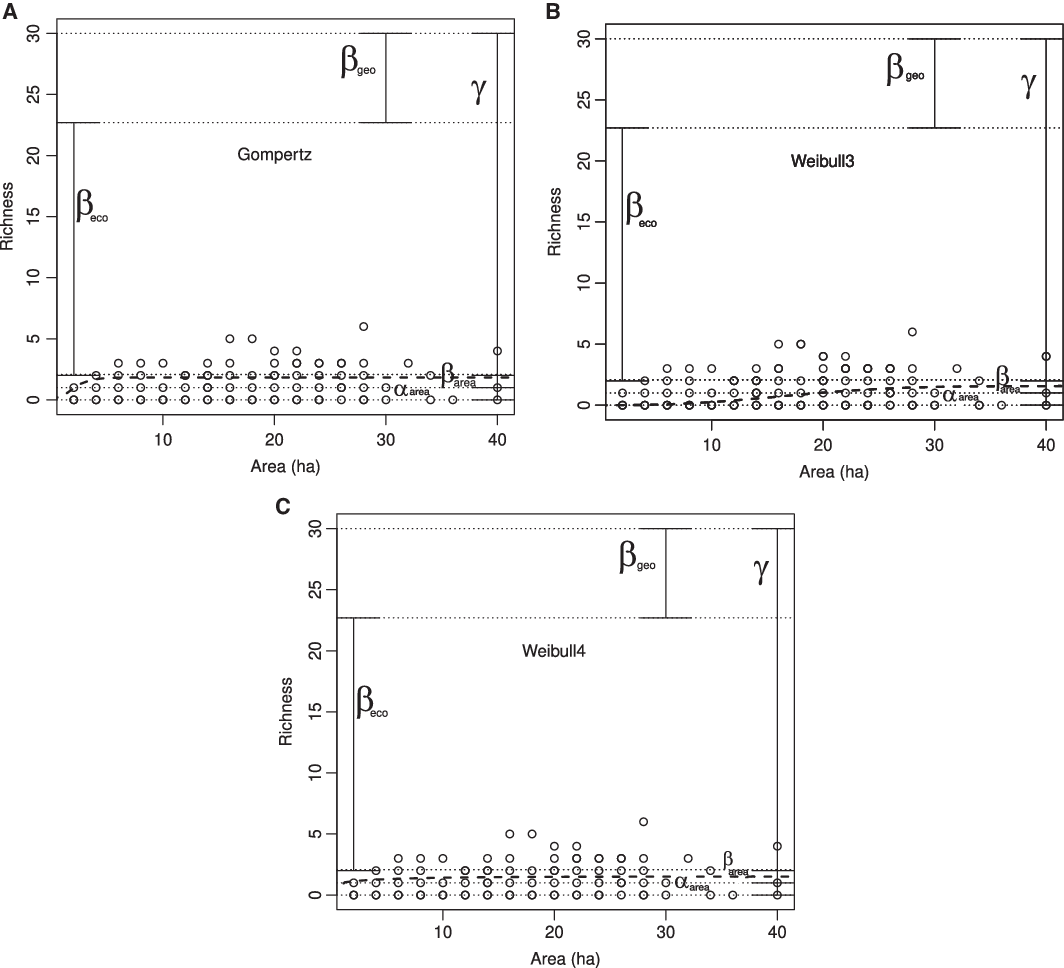
The diversity partitioning was investigated by analysing the distribution of fruit fly richness according to the beta-diversity types (Fig. 6). Most of the richness values were within the interval greater than 1 and less than 10, the β-area. The α-area contained the second-highest concentration of richness values, followed by β-eco with a few richness values close to the line between β-area and β-eco (Fig. 6). No richness value was observed in β-geo (Fig. 6). Figure 6A also shows the Gompertz curve fitted to the full series, and Fig. 6B shows the same curve fitted to the data influenced by the continuous implementation of the systems approach. Comparing the distribution of richness values in Figures 6 and 7, a clear difference between the figures can be observed, with the predicted richness decreasing from 6.39 to 1.57 (Weibull3), to 1.51 (Weibull4), and to 1.83 (Gompertz), and the decrease occurring from the continuous implementation of the systems approach to the impact on richness subseries (Figs. 6B and 7).
A, Additive diversity partitioning to analyse the distribution of Anastrepha fruit fly species from 1998 to 2010 (full series), in areas with different sizes, characterising different types of beta diversity, with the Gompertz curve fitted. Predicted richness for the maximum area is 6.55. B, Partitioning from 1998 to 2005 (continuous implementation of the systems approach), in areas with different sizes characterising different types of beta diversity, with the Gompertz curve fitted. Predicted richness for the maximum area is 6.39.

Additive diversity partitioning to analyse the distribution of fruit fly species from 2006 to 2010 (impact on richness), in areas with different sizes, characterising different types of beta diversity, with the A, Gompertz, B, Weibull3, and C, Weibull4 curves fitted. Predicted richness for the maximum value = 1.83 (Gompertz); 1.57 (Weibull3); 1.51 (Weibull4).

A comparison among the series, full series (1998–2010), continuous implementation of the systems approach (1998–2005), and impact on richness (2006–2010) also shows that the highest predicted fruit fly richness occurred from 1998 to 2010 (Fig. 6A). However, the distribution of richness values was almost the same for the full series and the series for the continuous implementation of the systems approach, with most of the points in
 $${\beta _{area}}$$
(Fig. 6). A slight difference in terms of point distribution can be observed exactly on the dotted line close to 10. In Fig. 6A, the points are distributed above or below this line, but in Fig. 6B, a couple of points fall on the dotted line. Only in the impact on richness series (2006–2010) were the points distributed in a narrower range, with most of the richness values scattered between 0 and 5 for all fitted models (Fig. 7). For this scenario, the β-area had a narrower vertical range than in the previous scenarios, and this characteristic led to the points also being distributed in β-eco (Fig. 7).
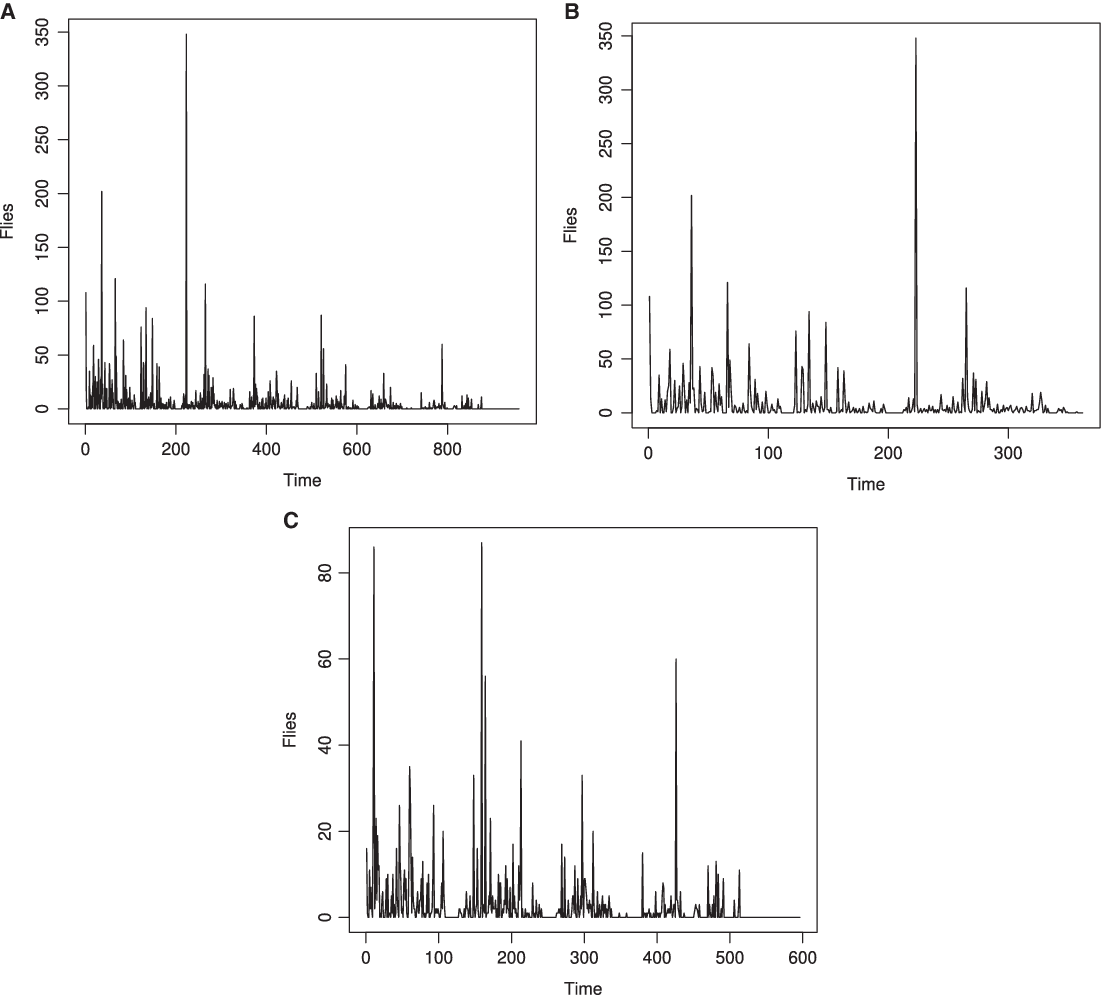
The time-series analysis for both the full series and the two subseries, continuous implementation of the systems approach (1998–2005) and impact on abundance (2004–2010), indicated clear differences in terms of peaks, mainly between the continuous implementation of the systems approach and the impact on abundance series, with respect both to peak magnitude (fly axis) and to the time of occurrence (time axis; Fig. 8). A comparative spectral analysis revealed a maximum spectrum value of 1295 for the full series, 2798 for the series for the continuous implementation of the systems approach, and a maximum spectrum value of 367 for the series for impact on abundance (Fig. 9). The difference between the three spectrum values reflects the series analysed, and the lowest value (367) occurred for the impact on abundance series. Comparing the potential peak production among the three scenarios, the full time series (1998–2010) and the subseries for the continuous implementation of the systems approach (1998–2005) would show a maximum peak with a period of 1/0.16 = 6.25 years. However, the impact on abundance series (2004–2010) would show a maximum peak with a period of 1/0.0008 = 125 years.
A, Full time series (1998–2010), B, continuous implementations of the systems approach subseries (1998–2005), and C, impact on abundance (2004–2010) subseries, as times series object in R language.

A, Spectral analysis for full series (1998–2010) with maximum spectrum of 1295 and frequency of 0.16, projecting a period of
 $${1 \over {0.16}} = 6.25\;{\rm{years}}$$
for a new peak of this size to occur; B, continuous implementation of the systems approach (1998–2005) with maximum spectrum of 2798 and frequency of 0.16, also projecting a period of
$${1 \over {0.16}} = 6.25\;{\rm{years}}$$
; and C, impact on abundance (2004–2010) with maximum spectrum of 367 and frequency of 0.008, projecting a period of
 $${1 \over {0.008}} = 125\;{\rm{years}}$$
between peaks.

Discussion
Of the Anastrepha species obtained in the data series from 1998 to 2010, a high percentage (87%) were previously recorded for the state of Espirito Santo (39 species; Zucchi and Moraes Reference Zucchi and Moraes2021). This number of species was observed for the total dataset. However, for the analyses, the species richness per area was used. The maximum value for richness per area was 10 species. Anastrepha fraterculus and A. obliqua were the most abundant species in the dataset. Both have wide geographical distributions and are highly polyphagous. Anastrepha fraterculus is the species with the largest number of host plants in Brazil (128), followed by A. obliqua (64; Zucchi and Moraes Reference Zucchi and Moraes2021). Dominance of these species has been observed in several Brazilian states (Garcia et al. Reference Garcia, Campos and Corseuil2003; Aguiar-Menezes et al. Reference Aguiar-Menezes, Souza, Lima-Filho, Barros, Ferrara, Eurípedes and Menezes2008; Lopes et al. Reference Lopes, Souza-Filho, Gotelli, Lemos, Godoy and Zucchi2015; Monteiro et al. Reference Monteiro, Tomba, Nishimura, Monteiro, Foelkel and Lavigne2019; Oliveira et al. Reference Oliveira, Uchoa, Pereira, Nicácio and Faccenda2019). Usually, in commercial orchards one or two fruit fly species are dominant, comprising a significant part of the total of captured specimens (Aluja et al. Reference Aluja, Celedonio-Hurtado, Liedo, Cabrera, Castillo, Guillén and Rios1996). An array of biotic and abiotic factors, including host plants, may simultaneously contribute to the establishment of fruit flies as dominant and codominant species in specific areas (Aluja et al. Reference Aluja, Celedonio-Hurtado, Liedo, Cabrera, Castillo, Guillén and Rios1996; Rwomushana et al. Reference Rwomushana, Ekesi, Ogol and Gordon2009). In addition, both A. fraterculus and A. obliqua are considered complexes of cryptic species sensu lato that are difficult to distinguish morphologically.
Effects of environmental variables
Our results suggest that only relative humidity influenced Anastrepha richness and that abundance was not influenced by any of the three environmental variables analysed. Environmental variables, particularly rainfall and soil moisture, can affect fruit fly life stages in different ways (Montoya et al. Reference Montoya, Flores and Toledo2008; Quesada-Moraga et al. Reference Quesada-Moraga, Valverde-García and Garrido-Jurado2012). Generally, rainfall, temperature, and relative humidity affect both fruit fly diversity and abundance (Nascimento et al. Reference Nascimento, Zucchi, Morgante and Malavasi1982; Garcia et al. Reference Garcia, Campos and Corseuil2003; Trassato et al. Reference Trassato, Lima, Monteiro Neto, Bandeira, Silva and Striicker2015; Gnanvossou et al. Reference Gnanvossou, Hanna, Goergen, Salifu, Tanga, Mohamed and Ekesi2017), but the correlation coefficients are usually low and some of them are statistically not significant. The absence of effects of temperature and rainfall on richness and abundance found in the present study is probably a function of a local aspect – that is, an area with orchards that are not far from each other and are all influenced by the same conditions, resulting in apparent stability of values during the observation period.
Effects of the systems approach
Fruit fly richness and abundance varied significantly from 1998 to 2010. The three subseries investigated – the continuous implementation of the systems approach (1998–2005) and the impacts on richness (2006 to 2010) and on abundance (2004–2010) – showed different periods; the continuous implementation of the systems approach subset described an increasing dispersal of points for both richness and abundance of flies, whereas the impact on richness and abundance subsets showed the opposite. The high abundance and richness of flies before 2006 probably occurred in response to the absence of pest management in previous years. Even with the implementation of the systems approach before 2006, it takes time for control actions to affect fruit fly abundance and species richness. However, pest control implemented through the systems approach did result in a lower richness and abundance of species of Anastrepha after a few years. The relationship between species richness and abundance is generally associated with commonness and rarity, which are usually cited as dependent on the heterogeneity of resources (Verberk Reference Verberk2011). In this study, fruit fly richness reached its maximum value at 10 species per area and then decreased in response to a set of actions, indicating successful pest management. The results analysed here were obtained mainly from papaya orchards, although the data were likely influenced by nearby urban and Atlantic forest remnant areas. The maximum richness found in the present study is coherent with fruit fly surveys in tropical areas, which generally do not find richness levels higher than those estimated in this study (Marsaro Júnior et al. Reference Marsaro Júnior, Nascimento, Ronchi-Teles and Adaime2012; Almeida et al. Reference Almeida, Coelho, Uchoa and Gisloti2019). The abundance of flies also changed during the study period. The most pronounced change in the number of flies occurred after 2005, probably in part as a result of the actions taken in the systems approach (Martins et al. Reference Martins, Ventura, Lima, Culik, Costa and Ferreira2012).
Generally, fruit flies infest papaya at the fruit’s advanced stages of maturity, but the Papaya meleira virus reduces the fruits’ resistance to fruit flies, allowing them to be infested while still unripe (Martins et al. Reference Martins, Ventura, Lima, Culik, Costa and Ferreira2012). When papaya fruits are harvested in early stages of maturity, the risk of infestation by fruit flies is low due to the toxicity of benzyl-isothiocyanate, which is present in the latex of the fruit (Tang Reference Tang1973; Martins et al. Reference Martins, Ventura, Lima, Culik, Costa and Ferreira2012). Analysis of the data from 2006 to 2010 provided strong evidence of the positive effect of fruit harvest management at the start of ripening.
Our results also indicate that fruit fly richness showed no significant variation in response to the distance of the papaya orchards from the Atlantic forest remnant. However, fruit fly abundance changed significantly in response to this factor for the full data series and for two subseries – the continuous implementation of the systems approach and the impact on abundance. It is possible that the distance analysed was not far enough to capture richness changes but was far enough to affect fly abundance. Some authors have reported that native vegetation acts as a reservoir for economically important Anastrepha species (Uramoto et al. Reference Uramoto, Martins and Zucchi2008; Uchôa and Nicácio Reference Uchôa and Nicácio2010; Garcia et al. Reference Garcia, Araujo, Uramoto, Walder and Zucchi2017). However, few studies have assessed the influence of nearby vegetation on orchards’ fruit fly communities. A pioneer study in the state of Minas Gerais, Brazil, showed that guava orchards adjacent to fragments of native vegetation harbour fruit fly species in common (Querino et al. Reference Querino, Maia, Lopes, Alvarenga and Zucchi2014), with the abundance of Anastrepha tending to be higher near preserved native forest due to the availability of hosts for the flies.
Comparison of data for two of the subseries – continuous implementation of the systems approach (1998–2005) and impact on richness (2006–2010) – showed a clear change in species richness. The richness of flies was perceptibly higher from 1998 to 2005 than from 2006 to 2010; this decrease was probably due to the systems approach implementation. Generally, crop environments have lower insect diversity than natural areas do because of the lower diversity of host plants in crop areas (Aluja Reference Aluja1999; Gurr et al. Reference Gurr, Wratten and Michael Luna2003). However, the richness analysis discussed here emphasises another aspect, this involving host plants and the diversity of species exploiting the same resource, as some species of Anastrepha are among the main pests of fruit grown in Brazil (Araujo et al. Reference Araujo, Uramoto, Ferreira, Mesquita Filho, Walder, Savaris and Zucchi2019). The diversity of tephritids in fruits depends on the association of each fly species with its host plants. Certainly, the attractiveness of different plants may influence the presence of species in host plants, thereby impacting the community structure of insects visiting the fruits (Almeida et al. Reference Almeida, Coelho, Uchoa and Gisloti2019).
Model selection
The information criterion weights differed among the periods investigated in the present study, especially when comparing the continuous implementation of the systems approach with the impact on richness subseries, with the Gompertz model usually best describing the nonlinear shape between species richness and area in each period. The ecological patterns produced by the theoretical curves are similar to each other for the full series and the continuous implementation of the systems approach subseries. These results were expected, because the continuous implementation of the systems approach period is part of the full series. However, the impact on richness period clearly shows very different richness values compared to the continuous implementation of the systems approach period – indicating a strong and lagging effect of the previously implemented management actions.
The sigmoid pattern observed in the relationship investigated here and described by the Gompertz model takes place generally in more complex systems, differing from patterns frequently observed in studies of this nature, including insects (Lomolino Reference Lomolino2001). In the present study, we tested 19 models that provided a wide range of possibilities for describing the relationship between area and species. We found that the Gompertz function provided the best shape for the full series and the continuous implementation of the systems approach subseries. For the impact on richness subseries, no specific model described its trajectory, probably in response to the low values of the series that resulted from the papaya pest management programme. According to the information criterion weights, the Weibull3 model best matched the shape for impact on richness data, with the lowest Akaike information criterion value of all models tested. The three functions – Weibull3, Weibull4, and Gompertz – resulted in sigmoid curves; we then fitted the three functions to the impact on richness subseries and found a sigmoidal pattern similar to those previously observed in the full series and continuous implementation of the systems approach subseries but with lower theoretical richness values.
The analysis of the relationship between richness values and area size indicates that higher richness was predominantly observed in areas smaller than 50 ha. This result can be linked to inter-habitat differences and influences, especially with respect to size and proximity of other areas such as urban environments or forests, as observed in the presence of different taxonomic groups (Lomolino Reference Lomolino2001; Rico-Gray and Oliveira Reference Rico-Gray and Oliveira2007). The papaya orchards investigated in the present study exhibited different area sizes and were relatively close to each other, with the predominance of aggregated areas varying their sizes. These conditions may have influenced the concentration of values below 50 ha.
Richness partitioning
The diversity partitioning analysis indicated that most of the richness values were within
 $${\beta _{area}}$$
(an estimate of the mean difference between and the diversity predicted for the largest area) for the full series and the continuous implementation of the systems approach subseries. Despite the similarity in terms of fruit fly richness within these series, comparison of all the series showed a significant decrease in fruit fly richness when comparing the full or continuous implementations of the systems approach series with the impact on richness subseries. This decrease was likely influenced by the effects also derived from the systems approach. There is an apparent similarity between Figures 6A and B due to the full and continuous implementation of the systems approach series being the same except for the time periods. However, the distribution of points differs slightly with respect to the asymptote.
The dotted line close to 10 shows a trend towards change in the point distribution as a transition between the continuous implementation of the systems approach and the impact on richness periods. In the impact on richness subseries (Fig. 7), the distribution of points differs entirely from the continuous implementation of the systems approach (Fig. 6B). The decrease in numbers from the systems approach affects the width of βarea. The parametric space for βarea is narrower in the impact on richness subseries than in the continuous implementation of the systems approach, probably in response to the decrease in number of fly species. The changes in beta diversity of insects living in Atlantic forest remnants, including fruit flies, were analysed by Novotny et al. (Reference Novotny, Miller, Hulcr, Drew, Basset and Janda2007), who emphasised the relationship between diversity and area and also discussed the role of host plant diversity in the relationship between richness and area size in tropical areas, with results indicating a low rate of change in beta diversity for tropical forests.
Although the preference for host plants defines the presence of several species in different environments, the movement of species – especially polyphagous species – also is highly important in the configuration of insect communities (Mazzi and Dorn Reference Mazzi and Dorn2012). The movement of insect pests from one place to another is, on the one hand, associated with their origin, abundance, and spatio-temporal distribution. But this movement is also capable of influencing species richness at other localities at different scales because of the relationships to different environments and to other species, as resource availability significantly influences the balance of intra- and interspecific relationships (Senger et al. Reference Senger, Tyson, Roitberg, Thistlewood, Harestad and Chandler2009; Mazzi and Dorn Reference Mazzi and Dorn2012).
The richness change in βarea in the context of diversity partitioning may also have important implications for the expansion of fruit fly populations and species distributions, because some of the insects affected by pest management techniques may attempt to establish in other locations, including in new orchards. The maximum richness clearly decreased when the continuous implementation of the systems approach subseries was compared to the impact on richness subseries, with values decreasing from 6.55 to 1.83. This result highlights the importance of using richness-partitioning analysis for problems in agriculture, mainly when species richness is involved. The richness of fruit fly species depends directly on their host plant preference, but this association is also influenced by the landscape, particularly when orchards are scattered in different areas, including near Atlantic forest remnants (Monteiro et al. Reference Monteiro, Tomba, Nishimura, Monteiro, Foelkel and Lavigne2019).
Diversity partitioning has received intensive attention from ecologists who are interested in the functionality of the diversity decomposition, describing different levels of coverage for the number of species distributed at different spatial scales (Jost et al. Reference Jost, DeVries, Wall, Greeney, Chao and Ricotta2010; Veech and Crist Reference Veech and Crist2010; Chao et al. Reference Chao, Chiu and Hsieh2012). This approach has been discussed intensely in terms of concepts and theoretical aspects important for species diversity, particularly the use of additive or multiplicative partitioning to quantify and interpret alpha, beta, and gamma diversity, at multiple scales of sampling.
The study proposed by Chao et al. (Reference Chao, Chiu and Hsieh2012) shows that both additive and multiplicative beta diversity can be useful in quantifying and analysing community composition, but neither are appropriate when comparing multi-site compositional similarity because of the dependence on number of communities and alpha diversity, respectively, for multiplicative and additive beta partitioning. However, the objective of the present study does not require the condition of removing the dependence of the above-mentioned variables to compare species diversity among areas. The data obtained were analysed to account for the influence of the area size on the fruit fly species richness distributed in papaya orchards. We chose a way to investigate the relationship between area and fruit fly richness at different beta-diversity scales, which are compatible with the main aspects of the diversity partitioning approach (Henry and Stevens Reference Henry and Stevens2009; Jost et al. Reference Jost, DeVries, Wall, Greeney, Chao and Ricotta2010; Veech and Crist Reference Veech and Crist2010; Chao et al. Reference Chao, Chiu and Hsieh2012).
The approach used in this study takes into account the type of data available to analyse fruit fly diversity in commercial papaya orchards located within Brazilian Atlantic forest areas. The data exhibit the condition required to use Henry and Stevens’s (Reference Henry and Stevens2009) formalism, demanding that gamma describes the total number of species and that alpha describes average richness of patches, or orchards, in the present study. For the beta-diversity analyses, the partitioning was necessary to consider the spatial structure of the orchards vis-à-vis nearby native forest, making it possible to consider the presence of species not always instantly and locally detected.
The additive partitioning employed here makes possible a direct comparison of average richness among samples, because the measures of diversity were expressed in the same units, as required by Henry and Stevens’s (Reference Henry and Stevens2009) approach. Therefore, the analysis used to investigate fruit fly species richness patterns provided a way to better quantify the relationship between area or distance and fruit fly species richness.
Losses and gains of species are events generally common in insect communities and depend on many factors, with time being one of the main factors. In a spatial dimension, species composition – understood as beta diversity – can vary significantly in response to time among sites (Legendre and Gauthier Reference Legendre and Gauthier2014; Shimadzu et al. Reference Shimadzu, Dornelas and Magurran2015), and statistical methods have been proposed to evaluate changes in diversity through time at different patches (Legendre Reference Legendre2019).
Although the approach employed in the present study does not specifically consider losses and gains of species, the β-replace diversity value considered took into account a highly dynamic scenario in terms of insect movement, with papaya orchards located close to each other, thereby allowing species to migrate easily among orchards. This condition provides, at least in the algorithm used in this study, the multi-site homogeneous replacement chance, which makes insect losses and gains liable for recognition over time in the entire area, because replacements are equally possible for all orchards.
Time significantly influenced the dynamics of losses and gains of species in the orchards investigated, especially when different time-period subseries, comprising data without management effects and data showing results after systems approach effects, were compared. These conditions showed the temporal impact of the pest management measures on fruit fly species richness similar to some extent to what Legendre (Reference Legendre2019) discussed. Species richness is highly sensitive to multiple factors, especially those that influence population demographics and species diversity, including climate change or human activities (Legendre Reference Legendre2019).
Time series and peaks
The time series investigated in the present study showed several peaks occurring at different time periods and with different population sizes, especially when the full series or continuous implementation of the systems approach subseries were compared to the impact on abundance subseries. Peaks may occasionally be associated with cycles in insect populations, with different explanations for their occurrence. Immigrating populations may show substantially increased growth rates in habitats that are closely connected to each other, reducing the time period between peaks in situations where high connectivity exists between habitats. This condition could result in more rapid changes from peaks to valleys than might occur in isolated populations, depending on population density (Johnson et al. Reference Johnson, Bjørnstad and Liebhold2006). Cycles have been analysed much more often under laboratory conditions, with different variables such as temperature, humidity, or photoperiod controlled (Prout and McChesney Reference Prout and McChesney1985).
The existence of cycles or observation of recurrent peaks in natural conditions is less common but, in insects, is of particular importance for agricultural landscapes, because of the risk of outbreaks in crops. In these cases and also in cases of strong interactions, such as in host–parasitoid systems, spectral analyses provide important information. In this context, the occurrence or likelihood peaks can be taken into account in decisions regarding interventions in agricultural systems (Ferreira and Godoy Reference Ferreira and Godoy2014). In the present study, spectral analysis yielded useful results, indicating that the time series for the full and continuous implementation of the systems approach would show peaks with a 6.25-year periodicity and the impact on abundance subseries would show peaks with a 125-year periodicity.
The present study combined three analyses in an attempt to better understand the ecological patterns inherent in a long-term series. It also projected trends of potential infestations of fruit flies, focusing on monitoring and papaya-harvesting management. The analyses essentially complemented each other because they were capable of evaluating the relationships among time periods, distance from an Atlantic forest remnant, harvesting, and pest management based on the richness and abundance of Anastrepha fruit flies, which are economically important for Brazilian fruit growers.
Conclusions
The systems approach implemented in papaya orchards resulted in a significant reduction in both richness and abundance of Anastrepha species. The Gompertz model satisfactorily described the sigmoidal relationship between area and species diversity. Additionally, its nonlinear nature was useful for analysing the parametric space and estimating theoretical richness in the diversity partition. The periodograms generated in the present study were useful for projecting the occurrence of future population peaks of fruit flies with critical values for the production of papaya in commercial orchards, indicating that the systems approach delays the time between large fruit fly population peaks.
Acknowledgements
The authors thank CNPq, FAPESP (2014/16609-7), and FAPES for scholarships and financial support. They also thank Janet W. Reid (JWR Associates, Trumansburg, United States of America) for editing the English text. Two referees and the editor made useful comments, which undoubtedly contributed to substantially improve the clarity of the manuscript.