Introduction
Sperm capacitation is a critical post-ejaculatory maturation process that confers the ability to fertilize oocytes in vivo and in vitro (Pitnick et al., Reference Pitnick, Wolfner and Dorus2020; Keller and Kerns, Reference Keller and Kerns2023). During capacitation, sperm acquire hyperactivated motility – a high-amplitude, asymmetrical flagellar beat that improves their ability to navigate the female reproductive tract. Concomitantly, acrosomal remodelling prepares sperm for the acrosome reaction, during which acrosomal enzymes are released to facilitate penetration of the oocyte zona pellucida (Hirohashi and Yanagimachi, Reference Hirohashi and Yanagimachi2018; Qu et al., Reference Qu, Han, Chen, Lv, Zhang, Cao, Zhang and Jin2022). Calcium (Ca2+) influx through specific ion channels is central to these events; channel activity and downstream signalling are modulated by changes in pH, membrane potential and protein tyrosine phosphorylation (pTyr). Collectively, these regulatory inputs coordinate the biochemical and physiological changes that establish capacitation and sperm fertilizing ability (Yi et al., Reference Yi, Manandhar, Sutovsky, Zimmerman, Jonáková, Leeuwen, Oko, Park and Sutovsky2010; Yoshida and Yoshida, Reference Yoshida and Yoshida2011; Li et al., Reference Li, Kang, Peng, Wang, Weng and Zeng2021; Sugita et al., Reference Sugita, Takarabe, Kageyama, Kawata and Ito2024).
Consistent with an emerging role of UPS remodelling in boar sperm capacitation, prior work has reported capacitation-associated modifications and redistribution of 26S proteasome components in boar spermatozoa (Zigo et al., Reference Zigo, Kerns, Sutovsky and Sutovsky2018).
The UPS is the principal pathway for selective protein degradation in eukaryotic cells, preserving proteostasis by recognizing and degrading ubiquitinated substrates (Yin et al., Reference Yin, Popelka, Lei, Yang and Klionsky2020). In the canonical UPS pathway, substrates tagged with K48-linked polyubiquitin chains (typically ≥4 ubiquitin moieties) are recognized by the 19S regulatory particle and processed by the 26S proteasome, which consists of a, 20S catalytic core capped by one or two 19S regulatory particles (Tanaka et al., Reference Tanaka, Mizushima and Saeki2012; Tomko and Hochstrasser, Reference Tomko and Hochstrasser2013; Sahu and Glickman, Reference Sahu and Glickman2021). Within the 19S regulatory particle, RPN2 and RPN13 are non-ATPase subunits with distinct structural and regulatory roles (He et al., Reference He, Kulkarni, da Fonseca, Krutauz, Glickman, Barford and Morris2012; Rosenzweig et al., Reference Rosenzweig, Bronner, Zhang, Fushman and Glickman2012). RPN2 functions primarily as a large scaffold subunit that organizes docking interfaces for substrate receptors and processing factors, whereas RPN13 contains a Pru (pleckstrin-like receptor for ubiquitin) domain that functions as an intrinsic ubiquitin receptor and can recruit or regulate deubiquitinating enzymes (Liang et al., Reference Liang, Wang, Wang, Liu, Zhang and Liang2021; Liu et al., Reference Liu, Liu, Dong, Zuo and Liu2022). Together with other receptors and shuttle factors, these subunits contribute to substrate recognition and delivery to the proteolytic core. Experimental and structural studies indicate that RPN13–RPN2 interactions modulate RPN13 conformation and ubiquitin-binding activity, thereby influencing substrate engagement by the proteasome (Liang et al., Reference Liang, Wang, Wang, Liu, Zhang and Liang2021; Adler et al., Reference Adler, Oren and Shaul2023).
Although RPN13 and RPN2 exhibit some functional overlap in substrate handling, their distinct structural features and regulatory roles warrant separate consideration. RPN13 can associate with RPN2 through defined interfaces, and RPN2 acts as a scaffold that positions RPN13 and other factors within the 19S particle (Zhu et al., Reference Zhu, Cao, Mo, Shi, Hu, Xu, Quan, Liang, Li and Hong2023). Such interactions are thought to coordinate substrate recruitment, deubiquitination and delivery to the 20S catalytic core, thereby facilitating efficient recognition and processing of ubiquitinated substrates (Yu et al., Reference Yu, Wang, Zheng, Gao, Jia, Zhu, Lu, Jia, Chen and Dong2018).
Despite the established role of UPS in cellular proteostasis, the dynamics and functional significance of specific proteasomal receptors during sperm capacitation remain poorly understood. Therefore, in this study, we investigate how RPN2 and RPN13 are regulated during in vitro porcine sperm capacitation and whether modulation of RPN13 affects capacitation-associated markers and fertilization-related outcomes, including early embryo cleavage after IVF. To ensure a rigorous comparison, the non-capacitated control (Non-Cap) was defined as sperm incubated for 4 h in Capacitation Medium lacking bovine serum albumin (BSA) (CM minus BSA), serving as a time-matched control for the capacitated group (Cap), which was incubated in complete CM. We hypothesize that ubiquitin-dependent regulation of RPN13 (including changes in its association with ubiquitin/ubiquitinated proteins) alters its steady-state abundance and interactions with proteasomal partners such as RPN2 during capacitation and that perturbing RPN13 function will affect signalling and functional readouts of capacitation.
Materials and methods
Reagents
Unless otherwise stated, chemicals were obtained from Sigma–Aldrich (St. Louis, MO, USA). The Fluo-4 AM calcium detection kit (S1061S), SDS–PAGE loading buffer (P0015L), RIPA lysis buffer (P0013B), protease inhibitor cocktail (P1006), BCA protein assay kit (P0010S) and HRP-conjugated goat anti-mouse/rabbit IgG (A0216, A0208) were purchased from Beyotime Biotechnology (Shanghai, China). Anti-PSMD1 (Rpn2; also referred to as proteasome regulatory subunit RPN2) antibody (ab2941; Abcam, Cambridge, UK; rabbit polyclonal IgG; concentration range 1 mg/mL, batch-dependent) was used for western blotting (WB) and immunoprecipitation (IP) at 1:1000 (final ∼1.0 μg/mL) and for immunofluorescence (IF) at 1:300 (final ∼3.33 μg/mL). Anti-RPN13 mouse monoclonal antibody (sc-271398; Santa Cruz Biotechnology, Dallas, TX, USA; provided at 200 μg/mL according to the datasheet) was used for WB and IP at 1:1000 (final ∼0.20 μg/mL) and for IF at 1:300 (final ∼0.67 μg/mL). Protein tyrosine phosphorylation was detected using an anti-phosphotyrosine antibody (mouse monoclonal, P1869; Sigma–Aldrich; supplied at ∼2 mg/mL) at 1:2000 for WB (final ∼1.0 μg/mL). Ubiquitin was detected using an anti-ubiquitin antibody (mouse monoclonal, #3936; Cell Signalling Technology; concentration is lot-dependent, e.g., 794–852 μg/mL in representative certificates of analysis (COAs)) at 1:1000 for WB (final ∼0.79–0.85 μg/mL). Primary antibody working dilutions were selected based on manufacturers’ recommendations and preliminary titration to maximize signal-to-noise. Protein A/G agarose beads/resin (FI8802; FITGENE, Guangzhou, China) were used for co-immunoprecipitation (Co-IP). RA190 (S6851) was purchased from Selleck (Houston, TX, USA). The JC-1 mitochondrial membrane potential kit (C2006) and Enhanced ATP Assay Kit (S0026) were purchased from Beyotime Biotechnology (Shanghai, China). BODIPY™ FL ATP probe (A12410; Invitrogen/Thermo Fisher Scientific) was used for ATP imaging.
Semen processing and ethics statement
All procedures were conducted in accordance with the Guide for the Care and Use of Laboratory Animals (8th ed., National Research Council) and received approval from the Institutional Animal Care and Use Committee of the university. The study is reported in compliance with ARRIVE guidelines. Semen was collected from eight healthy Landrace boars. All boars were actively used for artificial insemination with no recorded subfertility, and farm records for the preceding 6–12 months indicated farrowing rates within the routine operational range. Only ejaculates meeting quality criteria (>80% total motility; <20% morphological abnormalities) were used. Ejaculates failing day-of-collection quality thresholds were excluded. A total of six ejaculates that met all quality criteria were used for subsequent experiments.
Sperm in vitro capacitation (IVC) and inhibition treatments
Sperm were washed three times in PBS (600 × g, 5 min each). The sperm were then resuspended in capacitation medium (CM), which contained 119 mM NaCl, 4.7 mM KCl, 2.5 mM CaCl2, 0.5 mM MgSO4, 25 mM NaHCO3, 5 mM glucose, 1 mM sodium pyruvate, 10 mM HEPES and 3 mg/mL BSA (pH 7.4). The inclusion of bicarbonate in CM was intended to activate soluble adenylyl cyclase and downstream protein tyrosine phosphorylation, a hallmark of sperm capacitation. Sperm samples were assigned to four treatment groups. For the Non-Cap group, sperm were incubated for 4 h in Capacitation Medium lacking BSA (CM minus BSA), serving as the incubation control. For the Cap group, sperm were incubated in CM for 4 h at 37.5°C in 5% CO2. For the CM + dimethyl sulfoxide (DMSO) group, sperm were incubated in CM with vehicle (DMSO) for 4 h (final DMSO ≤0.5%). RA190 was prepared as a DMSO stock solution and diluted into CM immediately before use; accordingly, sperm in the CM + RA190 group were incubated in CM containing 2 μM RA190 for 4 h, with the final DMSO concentration matched to the vehicle control (≤0.5%).
Analysis of sperm motility and hyperactivation
Motility was quantified by computer-assisted sperm analysis (CASA-QH-III, Beijing, China). Immediately prior to analysis, aliquots from each treatment group were diluted in phosphate-buffered saline (PBS; 1×; Solarbio, Cat. P1020; 136.0 mM NaCl, 2.6 mM KCl, 8.0 mM Na2HPO4·12H2O, 2.0 mM KH2PO4; pH 7.4) to approximately 20–40 × 106 sperm/mL to minimize sperm agglutination. The diluent was prewarmed to 37°C before use. CASA settings used a warmed stage (37.0–37.5°C), and thresholds for VAP, VSL, VCL, LIN, STR, WOB, ALH and BCF followed manufacturer defaults and were held constant across all samples. Analyses were performed in triplicate chambers (technical replicates) and averaged per ejaculate (biological replicate). Fields with significant sperm agglutination were excluded from the analysis.
The primary parameters recorded for this study were Total Motility (TM, %) and Progressive Motility (PM, %). Sperm hyperactivation (HA, %) was determined on a per-track basis by the CASA software. A sperm track was classified as hyperactivated when it simultaneously met the following thresholds: VCL > 150 µm/s, LIN < 50% and ALH > 3.5 µm. HA% was calculated as the percentage of motile sperm tracks fulfilling these criteria. Group means of VCL/LIN/ALH reported in Table 1 represent averages across all motile tracks and therefore are not expected to exceed the hyperactivation thresholds (microptic, 2016).
Effect of the RPN13 inhibitor (proteasome subunit inhibitor) RA190 on sperm kinematic parameters

Table 1. Long description
The table presents data on various sperm kinematic parameters across four different conditions: Non-Cap, Cap, CM + DMSO, and CM + RA190. The table has 4 rows and 11 columns. The columns are labeled as follows: VCL (μm/s), VSL (μm/s), VAP (μm/s), LIN (%), STR (%), ALH (μm), BCF (Hz), HA (%), TM (%), and PM (%). Each row represents a different condition and lists the corresponding values for each parameter. Row 1: Non-Cap, VCL 90.28 ± 4.08, VSL 45.25 ± 3.36, VAP 73.30 ± 3.42, LIN 50.36 ± 2.56, STR 65.46 ± 2.98, ALH 2.52 ± 0.31, BCF 18.5 ± 2.1, HA 2.4 ± 0.5, TM 85.6 ± 2.3, PM 53.4 ± 3.1. Row 2: Cap, VCL 130.41 ± 3.34, VSL 65.63 ± 3.47, VAP 79.52 ± 2.96, LIN 51.21 ± 4.27, STR 73.23 ± 3.78, ALH 4.61 ± 0.42, BCF 21.3 ± 1.8, HA 18.7 ± 2.1, TM 92.8 ± 1.6, PM 79.2 ± 2.4. Row 3: CM + DMSO, VCL 133.56 ± 3.56, VSL 62.45 ± 3.16, VAP 72.57 ± 4.16, LIN 52.30 ± 3.41, STR 71.27 ± 3.50, ALH 4.85 ± 0.38, BCF 20.9 ± 2.4, HA 19.4 ± 1.9, TM 91.4 ± 2.1, PM 77.4 ± 3.2. Row 4: CM + RA190, VCL 100.36 ± 4.27, VSL 49.63 ± 3.19, VAP 68.32 ± 3.84, LIN 51.84 ± 2.98, STR 65.82 ± 3.81, ALH 2.98 ± 0.45, BCF 19.2 ± 2.2, HA 6.2 ± 1.2, TM 80.3 ± 3.4, PM 58.1 ± 4.0.
Data are presented as mean ± SD (n = 6 ejaculates). Different superscript letters within the same column indicate significant differences among groups (one-way ANOVA with Tukey’s post hoc test; P < 0.05). Hyperactivation (HA, %) was defined per sperm track as VCL > 150 µm/s, LIN < 50% and ALH > 3.5 µm and expressed as the percentage of motile tracks meeting all criteria. Mean kinematic parameters (VCL, LIN, ALH, etc.) are averages across all motile tracks and therefore should not be used to directly infer HA%.
Fluo-4 AM calcium ion (Ca2+) staining
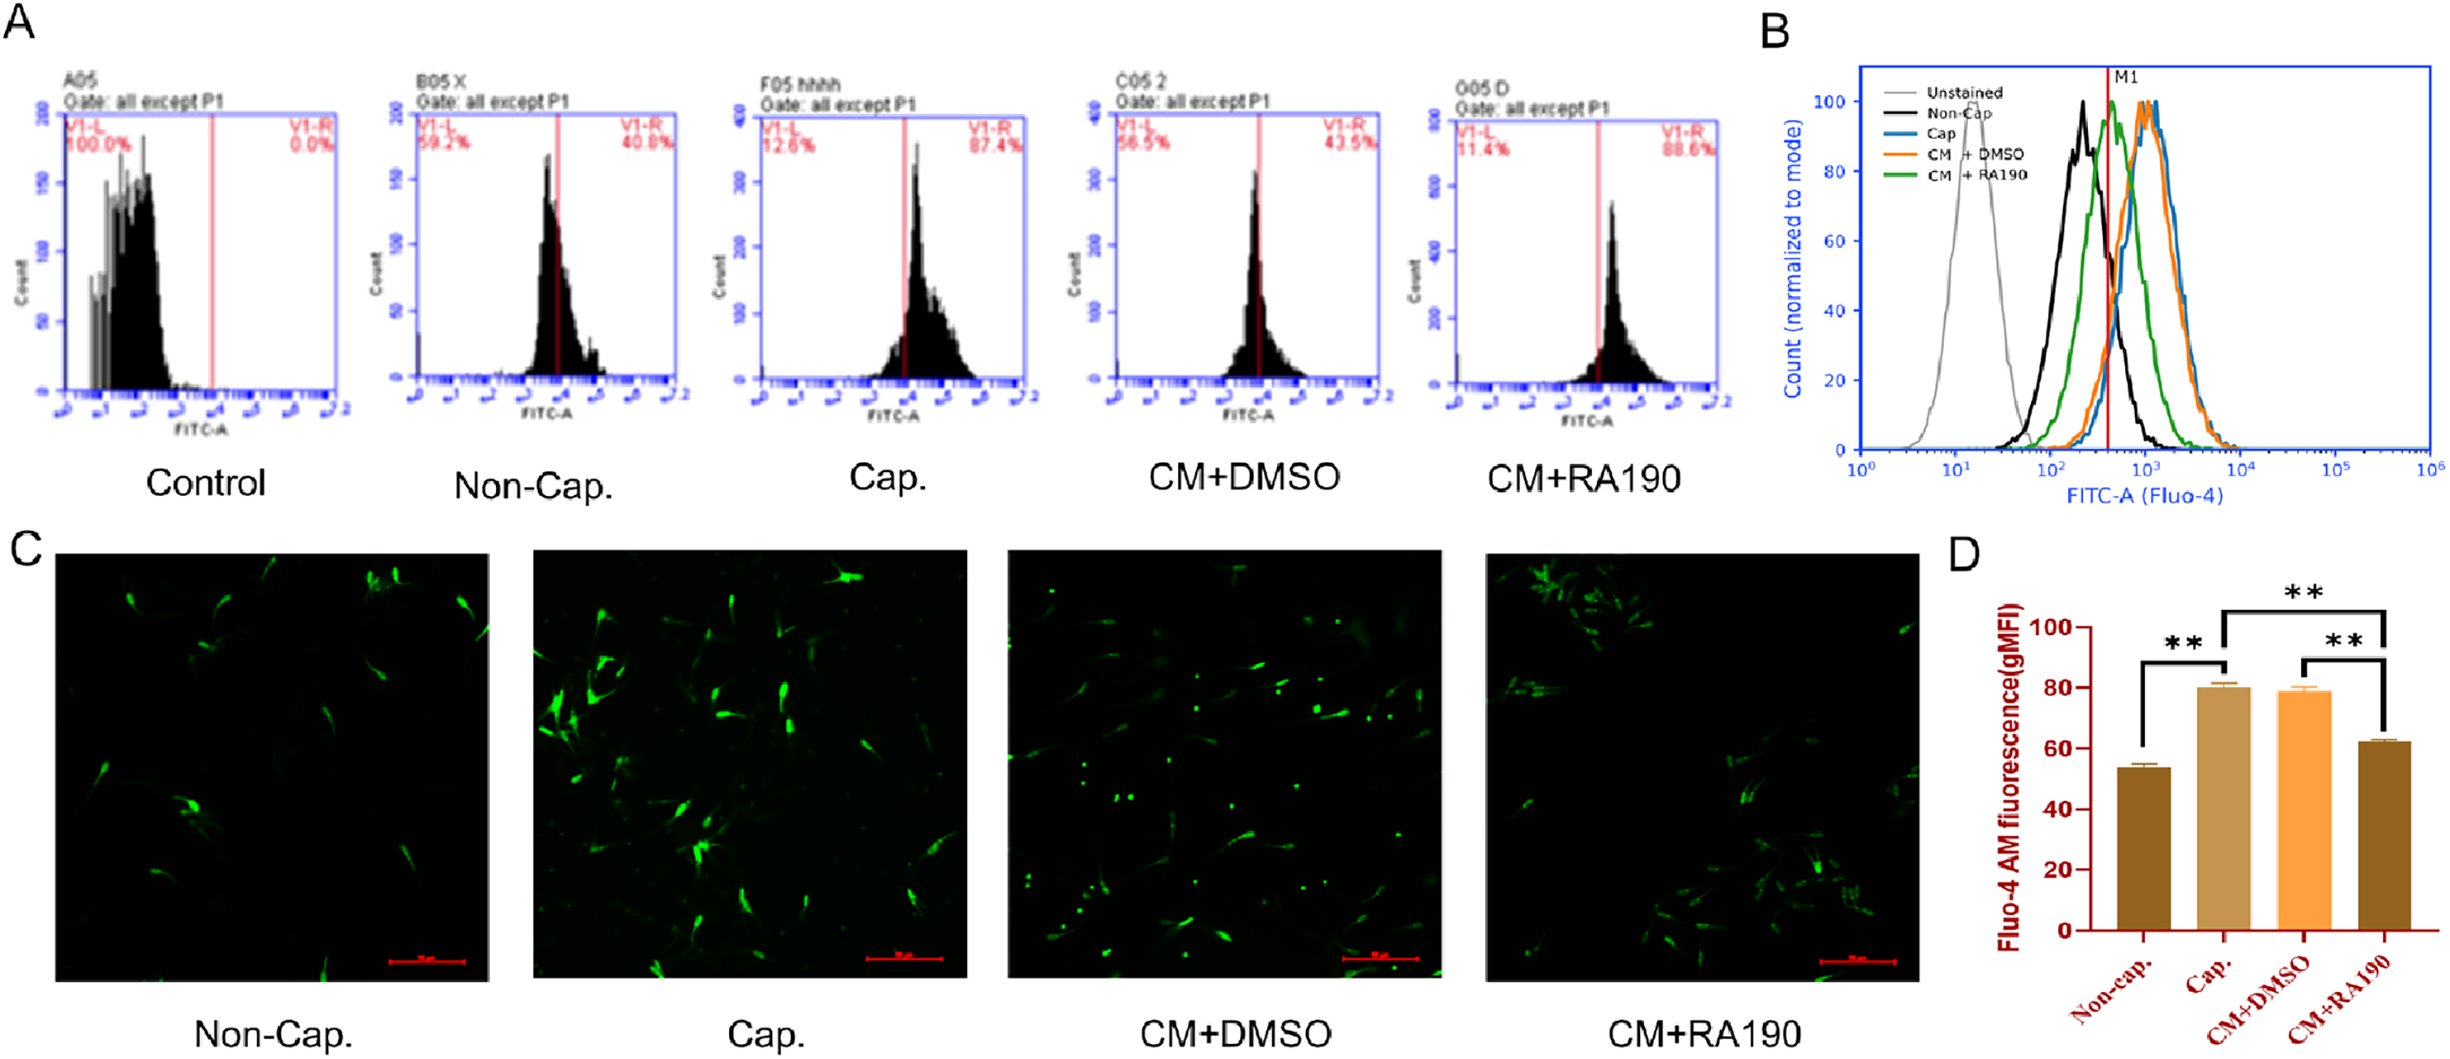
Sperm were adjusted to 1 × 10⁶ cells/mL and incubated with Fluo-4 AM at a final concentration of 2 μM (with 0.02% Pluronic F-127) in the dark at 37°C for 30 min. Cells were washed ×2 with PBS-PVA and resuspended in PBS–PVA (pH 7.4) as the assay buffer prior to acquisition. For microscopy, images were captured on an Olympus IX71 using a FITC filter set (Ex 490/20 nm, Em 525/30 nm); exposure and gain were kept constant across groups. For flow cytometry (BD C6 Plus), channels and settings were excitation 488 nm, detection FL1 (530/30 nm); 20,000 events were collected per sample. Gating was performed in FlowJo using unstained sperm and ionomycin-treated sperm (positive control) to define fluorescence thresholds. Spermatozoa were first gated on FSC-A vs SSC-A to exclude debris, followed by FSC-H vs FSC-A to remove doublets. Fluo-4 fluorescence was quantified as the geometric mean fluorescence intensity (gMFI) of FL1 (530/30) within the sperm gate. For visualization, representative single-sample histograms (Figure 2A) and overlay histograms (Figure 2B) were displayed on a log scale, with the unstained control included as a negative reference and the M1 gate/threshold applied consistently across samples. Representative fluorescence micrographs are shown in Figure 2C. For group comparisons (Figure 2D), gMFI values from each ejaculate were used for statistics. Because Fluo-4 was measured in a single-colour format, fluorescence compensation was not applied.
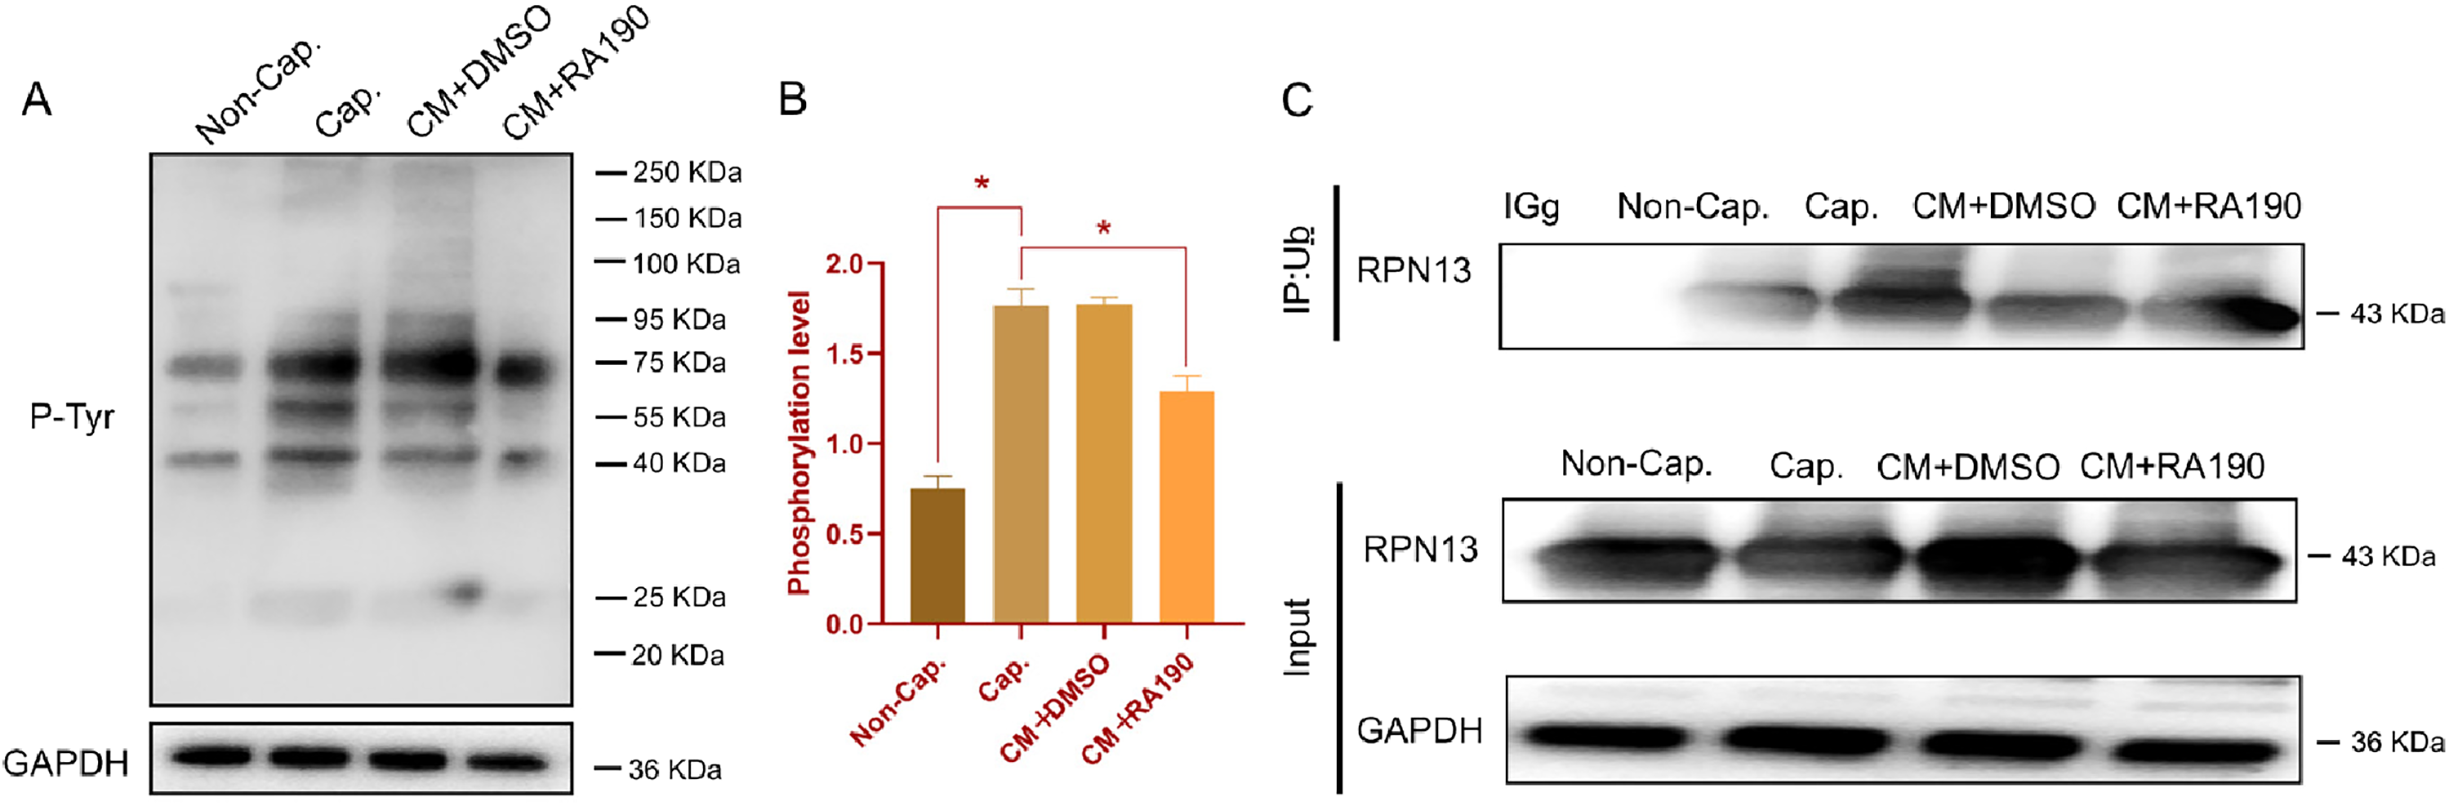
RPN13 inhibition impairs capacitation-associated protein tyrosine phosphorylation. (A) Western blot analysis of protein tyrosine phosphorylation (pTyr) levels in all four treatment groups: Non-Cap, Cap, CM + DMSO and CM + RA190. (B) Densitometric quantification of pTyr signals normalized to GAPDH (loading control) across all four groups. (C) Co-immunoprecipitation analysis of RPN13 and ubiquitin in capacitated sperm treated with CM + DMSO or CM + RA190. Data are presented as Mean ± SD. Statistical markers indicate significant differences (P < 0.05) relative to the Non-Cap control or the CM + DMSO control.

Effect of RPN13 inhibition on capacitation-associated intracellular Ca2+-related Fluo-4 signal. (A) Representative single-sample flow-cytometry histograms of Fluo-4 AM fluorescence from an unstained control and sperm from the four experimental groups (Non-Cap, Cap, CM + DMSO and CM + RA190), showing the M1 gate/threshold used to define Fluo-4–positive events consistently across all samples. (B) Representative overlay flow-cytometry histograms generated from the gated sperm population (FSC-A vs SSC-A, followed by FSC-H vs FSC-A doublet exclusion), plotted on a log scale and normalized to mode to visualize distribution shifts among groups. (C) Representative fluorescence micrographs of Fluo-4 AM staining in sperm from the four experimental groups. Scale bar: 50 μm. (D) Quantification of intracellular Ca2+-associated fluorescence by flow cytometry. Fluo-4 fluorescence was expressed as the geometric mean fluorescence intensity (gMFI; FL1 530/30) within the gated sperm population. Each dot represents one independent ejaculate (n = 6); bars show mean ± SD. Statistical significance was assessed by one-way ANOVA followed by Tukey’s post hoc test; key pairwise comparisons (Non-Cap vs Cap; CM + DMSO vs CM + RA190; Cap vs CM + RA190) are indicated on the plot.

Protein extraction
After treatment, spermatozoa were washed twice with ice-cold PBS to remove residual BSA from capacitation medium, then resuspended in ice-cold RIPA buffer (e.g., 100–150 μL per 1 × 10^7 sperm) supplemented with protease inhibitors and 1 mM PMSF. For each sample, 1 × 10⁷ spermatozoa were lysed. Samples were vortexed for 30 s and incubated on a rocking platform at 4°C for 40 min. Lysates were centrifuged at 3,000 × g for 10 min at 4°C to remove debris, and supernatants were transferred to fresh tubes. This low-speed clarification was used to remove insoluble debris while retaining soluble sperm proteins; pilot tests indicated comparable protein yields and band patterns to higher-speed clarification. Protein concentration was measured by BCA assay. Aliquots were stored at −80°C for long-term storage. For each SDS-PAGE, 25 μg of total protein was loaded per lane.
Sperm mitochondrial membrane potential assay (JC-1)
Sperm (1 × 10⁶/mL) were incubated with JC-1 working solution prepared per manufacturer’s instructions at 37°C, 5% CO2 for 30 min. After incubation, cells were centrifuged (800 × g, 5 min), washed and resuspended in PBS. For microscopy, samples were mounted and imaged using an Olympus IX71 with filter sets for JC-1 monomer (Ex/Em ≈485/530 nm, green) and aggregate (Ex/Em ≈540/590 nm, red). For each sample, 200–300 spermatozoa from randomly selected fields (≥5 fields per slide) were scored by two observers blinded to treatment. High ΔΨm was operationally defined as predominant red aggregate fluorescence; low ΔΨm as green monomer fluorescence. Aggregate/monomer ratios were also quantified using ImageJ on representative images.
Sperm ATP assay
Intracellular ATP was quantified using the Enhanced ATP Assay Kit according to manufacturer instructions with minor optimizations for sperm. Sperm were adjusted to 1 × 10⁶ sperm/mL; Fifty microliters of sperm suspension was mixed with 50 μL of the ATP detection working solution supplied with the kit (1:1, as recommended by the manufacturer), and luminescence was recorded in white 96-well plates. Plates were shaken for 2 min at room temperature, incubated for 5 min, and luminescence was measured using a microplate reader (NanoQuant M200 Pro; Tecan, Männedorf, Switzerland). ATP concentrations were calculated from a standard curve and normalized to nmol ATP per 106 sperm. For imaging, BODIPY™ FL ATP (an ATP-binding fluorescent probe) was diluted from a 5 mM DMSO stock to a final concentration of 0.5 μM (final DMSO < 0.5%) and incubated with live sperm (1 × 10⁶/mL) for 30 min in the dark; cells were washed twice (600 × g, 5 min) before imaging (Ex ≈ 503 nm, Em ≈ 512 nm). Because this probe reports ATP-associated binding/fluorescence rather than absolute ATP content, it was used only to visualize relative ATP-associated fluorescence patterns in live sperm, whereas absolute intracellular ATP concentration was quantified using the luciferase-based ATP assay described above.
Western blotting
Protein samples (25 μg per lane) were mixed with 4× loading buffer, denatured at 95°C for 5 min and separated on 10–12% SDS-PAGE gels. Proteins were transferred to PVDF membranes (Merck Millipore) at 90 V for 70 min in transfer buffer. Membranes were blocked with 5% non-fat milk in TBST (Tris-buffered saline + 0.1% Tween-20) for 1 h at room temperature, then incubated overnight at 4°C with primary antibodies. After three 10-min washes in TBST, membranes were incubated with HRP-conjugated secondary antibodies for 1 h at room temperature. Bands were visualized using ECL kit and imaged with the Essential V6 imaging system (Uvitec). Band densitometry was performed in ImageJ, and target signals were normalized to GAPDH as the loading control. GAPDH signals showed no obvious group-dependent variation across the experimental conditions and were therefore used for normalization.
Immunoprecipitation
Co-IP was performed using Protein A/G agarose beads/resin (FI8802; FITGENE, Guangzhou, China) with minor modifications. Briefly, sperm lysates (500 μg total protein per reaction) were pre-cleared with Protein A/G agarose beads (beads-only incubation) to reduce nonspecific bead binding. The pre-cleared lysates were incubated with the indicated primary antibody (anti-RPN13 or anti-PSMD1/Rpn2) at 4°C overnight with rotation. In parallel, two negative controls were processed identically: (i) a species- and isotype-matched normal IgG control (mouse IgG for anti-RPN13 IPs and rabbit IgG for anti-PSMD1/Rpn2 IPs) and (ii) a beads-only control (no antibody). Protein A/G agarose beads were then added and incubated for 2 h at 4°C. Beads were washed four times with wash buffer, resuspended in 20 μL 2× SDS loading buffer, boiled for 5 min, and eluted proteins were analyzed by SDS-PAGE and western blotting. Input (5–10% of total lysate), flow-through and eluates from the negative controls were retained and analyzed in parallel. Input samples were used as technical controls to verify protein presence in the Co-IP assay and were not intended for direct quantitative comparison with the whole-lysate western blots. Co-IP band intensities were quantified in ImageJ. Co-precipitated proteins (prey) were normalized to the amount of immunoprecipitated bait within the same lane, and values were expressed relative to the CM + DMSO (vehicle) group.
Immunofluorescence
Aliquots (1 mL) of treated sperm were pelleted at 600 × g for 5 min. The spermatozoa were then fixed and permeabilized in pre-chilled anhydrous ethanol at 4°C for 15–20 min. When 4% PFA fixation was used, cells were permeabilized with 0.1% Triton X-100 for 10 min. All staining steps were performed in suspension, and stained sperm were finally mounted onto slides for imaging. After washing × 3 with PBS-PVA, sperm were blocked in 1% BSA for 45 min at room temperature. For single-label immunofluorescence staining, sperm samples were incubated separately overnight at 4°C with anti-RPN13 (1:300) or anti-PSMD1/Rpn2 (1:300 [final ∼3.33 μg/mL]) primary antibody. The immunofluorescence analysis was used to assess the individual localization patterns and relative fluorescence intensities of RPN13 and RPN2, rather than direct dual-colour co-localization. Following three washes, samples were incubated with fluorescent secondary antibodies in the dark at 37°C for 2 h. Nuclei were stained with DAPI (1 μg/mL) for 15 min where applicable. Slides were mounted with anti-fade medium and imaged on an Olympus IX71 using a 40× objective. Exposure times were kept constant for comparative images. Image quantification was performed in ImageJ; observers were blinded to treatment. Negative controls included omission of the primary antibody and/or incubation with isotype-matched IgG, which yielded negligible fluorescence under identical acquisition settings.
Analysis of sperm–Egg binding ability and IVF
Porcine ovaries were obtained from Guangming Slaughterhouse (Yanji, Jilin, China). Cumulus–oocyte complexes (COCs) with homogeneous cytoplasm and ≥3 layers of cumulus cells were selected and matured in vitro in IVM I medium (TCM-199 supplemented with 10% exosome-depleted follicular fluid, 10 IU/mL hCG, 10 IU/mL PMSG, 0.06 mg/mL L-cysteine, 7.5 mg/mL penicillin and 5 mg/mL streptomycin) for 22 h, followed by culture in IVM II medium (same formulation without hormones) for an additional 22 h at 37.5°C in 5% CO2. After maturation, cumulus cells were removed using 0.1% hyaluronidase, and only metaphase II (MII) oocytes with a visible first polar body were used for subsequent assays. The maturation rate (MII/total cultured oocytes) was recorded for each biological replicate and ranged from 78.5% to 86.2% (mean ± SD: 82.3 ± 4.1%). For each biological replicate, ∼30 MII oocytes were allocated per treatment group.
After IVC, spermatozoa were pelleted and washed twice in IVF medium to remove residual RA190/vehicle, then resuspended and adjusted to 0.5 × 10⁵ sperm/mL. Sperm were co-incubated with oocytes for 6 h at 37°C in 5% CO2, followed by gentle washing to remove loosely associated spermatozoa.
Post-insemination assessments:(i) Sperm–zona pellucida (ZP) binding assay. After co-incubation and gentle washing, oocytes were fixed and stained with Hoechst 33342 to visualize sperm nuclei. ZP-bound spermatozoa were counted under fluorescence microscopy and expressed as the number of ZP-bound sperm per oocyte. Counting was performed blinded to group allocation.(ii) Early embryonic development. Putative embryos were cultured in PZM-3 at 37°C in 5% CO2. First cleavage was evaluated at 48–72 h post-insemination, and embryo development was recorded on day 4. Cleavage rate was calculated per inseminated viable oocyte (number cleaved ÷ number of inseminated viable oocytes). Because pronuclear formation (e.g., 2PN) was not scored, cleavage rate is reported as an integrated endpoint reflecting both successful fertilization and early developmental competence. IVF experiments were performed with ≥3 independent biological replicates.
Statistical analysis
Data are presented as mean ± SD unless stated otherwise. The biological replicate (independent ejaculate) was the experimental unit (n = 6 unless specified); technical replicates (e.g., multiple wells/fields per sample) were averaged within each biological replicate prior to analysis. Normality and homoscedasticity were assessed using the Shapiro–Wilk and Levene tests, respectively. For two-group comparisons, two-tailed Student’s t-tests were used (with Welch’s correction when variances were unequal); when normality was violated, the Mann–Whitney U test was applied. For multi-group comparisons, one-way ANOVA followed by Tukey’s HSD was used; when assumptions were not met, the Kruskal–Wallis test with Dunn’s post hoc (multiplicity-corrected) was applied. Exact two-sided P values are reported where possible; P < 0.05 (or an adjusted-P < 0.05) was considered significant. Where informative, effect sizes (e.g., Cohen’s d, η2) and 95% confidence intervals were provided. As a sensitivity analysis to account for repeated sampling across ejaculates, selected endpoints were reanalyzed using linear mixed-effects models (treatment = fixed effect; boar/ejaculate = random intercept), yielding concordant inferences. No ad hoc outlier removal was performed. Statistical analyses were performed in IBM SPSS Statistics 21.0 and GraphPad Prism 9. Western blot quantification was performed in ImageJ and normalized to loading controls.
Results
Validation of in vitro capacitation via key functional and molecular markers
To validate our in vitro capacitation model, we first assessed three key hallmarks of successful capacitation by comparing the capacitating group (Cap, +BSA) with the non-capacitating control (Non-Cap, -BSA).
First, at the kinematic level, CASA analysis (Table 1) showed that total motility (TM), progressive motility (PM) and hyperactivation (HA%) were significantly higher in the Cap group than in the Non-Cap group (P < 0.05). Second, at the molecular signalling level, incubation under capacitating conditions resulted in a significant and robust increase in protein tyrosine phosphorylation (pTyr) compared to the Non-Cap control group (Figure 1, P < 0.01), with prominent increases observed at approximately 130, 100, 55 and 25 kDa. Third, flow cytometry showed that capacitated sperm (Cap) exhibited significantly higher Fluo-4 gMFI than the non-capacitating (Non-Cap) control group (Figure 2D, P < 0.05). Representative single-sample histograms, overlay histograms and fluorescence micrographs are shown in Figure 2A–C.
Taken together, the concurrent and significant induction of hyperactivated motility, protein tyrosine phosphorylation and Ca2+-associated Fluo-4 fluorescence confirms the successful induction of a robust, capacitation-like state in our model.
Capacitation induces RPN2 and RPN13 degradation and enhances their interaction
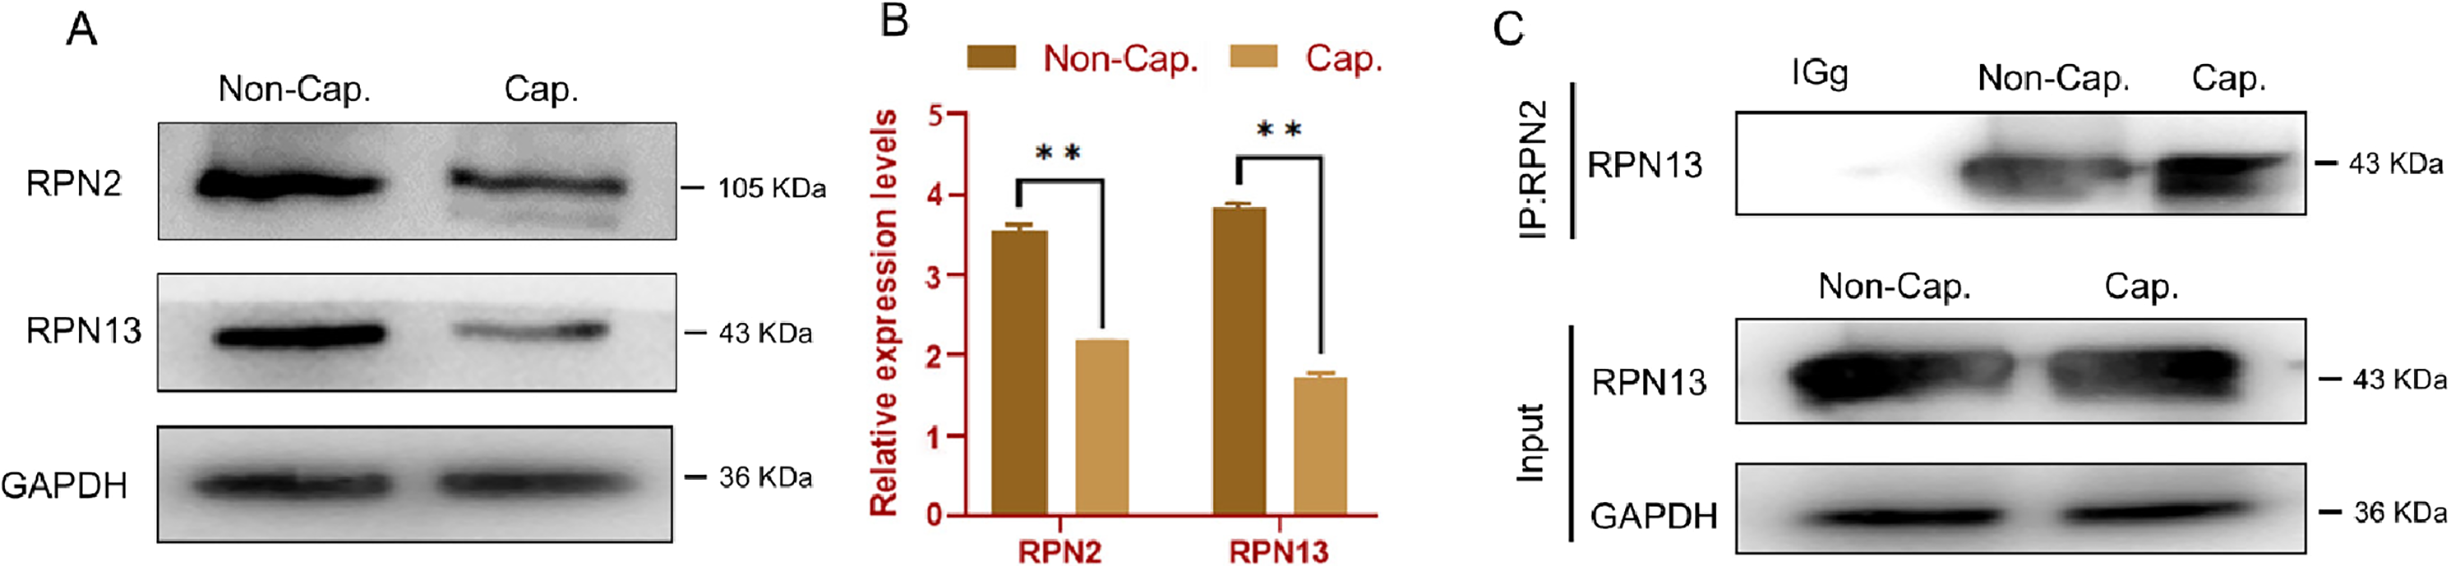
We next examined changes in proteasomal subunit expression by comparing sperm incubated for 4 h under capacitating conditions (Cap, with BSA) with those incubated in the non-capacitating control medium lacking BSA (Non-Cap) (Figure 3A). Densitometric analysis (Figure 3B) revealed a significant, capacitation-specific decrease in both RPN2 (105 kDa) and RPN13 (46 kDa) protein levels in the Cap group compared to the Non-Cap control (P < 0.01). Furthermore, Co-IP experiments showed that the RPN13–RPN2 interaction was markedly enhanced in the Cap group relative to the Non-Cap group (P < 0.01) (Figure 3C). The specificity of the Co-IP signals was verified using species-matched IgG and beads-only negative controls, which did not yield specific target bands.
Capacitation induces degradation and enhances interaction of RPN2 and RPN13. (A) Western blot analysis of the proteasomal subunits RPN2 and RPN13. Samples are sperm incubated for 4 h in non-capacitating medium lacking BSA (Non-Cap) and sperm incubated for 4 h in capacitating medium with BSA (Cap). (B) Densitometric quantification of RPN2 and RPN13 bands normalized to GAPDH. (C) Co-immunoprecipitation (Co-IP) analysis of RPN13 and RPN2 in sperm samples from the Non-Cap and Cap groups. Data are presented as Mean ± SD. **P < 0.01 indicates a significant difference between the Cap and Non-Cap groups.

Figure 3. Long description
Panel A: Western blot analysis of proteasomal subunits RPN2 and RPN13. The samples are sperm incubated for 4 hours in non-capacitating medium lacking BSA (Non-Cap) and sperm incubated for 4 hours in capacitating medium with BSA (Cap). The blots show bands for RPN2 at 105 KDa, RPN13 at 43 KDa, and GAPDH at 36 KDa. Panel B: A bar graph showing densitometric quantification of RPN2 and RPN13 bands normalized to GAPDH. The x-axis represents the proteins RPN2 and RPN13, and the y-axis represents the relative expression levels. The graph shows two sets of bars for each protein, one for Non-Cap and one for Cap, with significant differences indicated by double asterisks. Panel C: Co-immunoprecipitation analysis of RPN13 and RPN2 in sperm samples from the Non-Cap and Cap groups. The top part shows the immunoprecipitation results for RPN13, with bands at 43 KDa, and the bottom part shows the input controls for RPN13 and GAPDH.
Effect of the RPN13 inhibitor (proteasome subunit inhibitor) RA190 on RPN2 and RPN13 in capacitated sperm
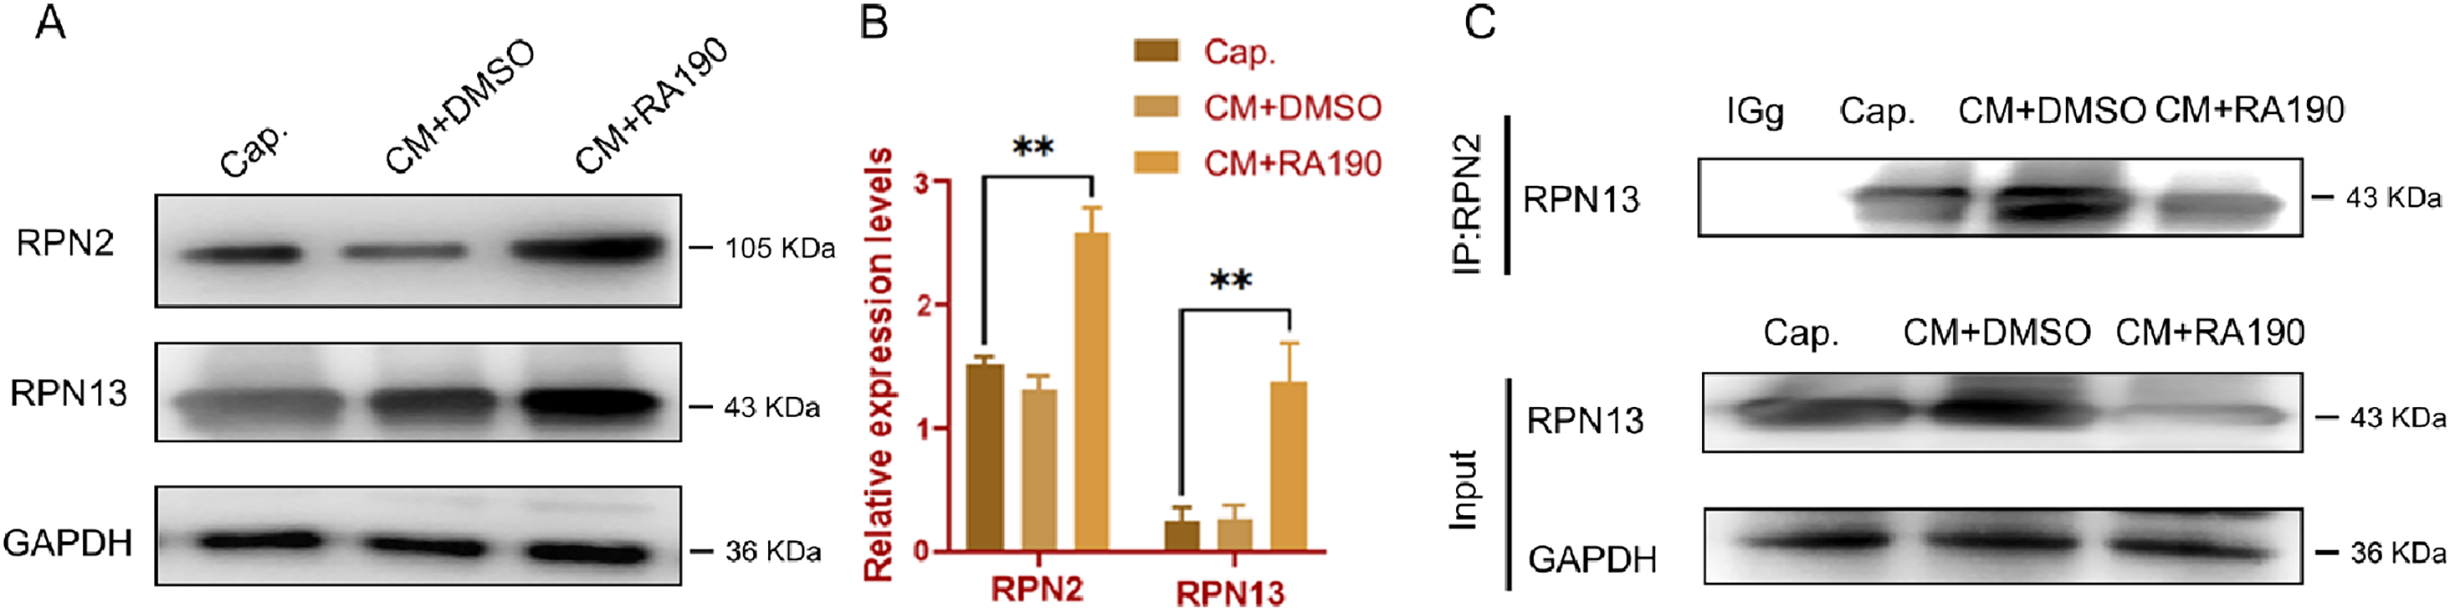
RA190 is an RPN13 inhibitor (proteasome subunit inhibitor) that covalently binds to RPN13 and inhibits its ubiquitin-receptor function (Anchoori et al., Reference Anchoori, Karanam, Peng, Wang, Jiang, Tanno, Orlowski, Matsui, Zhao and Rudek2013). To investigate the impact of this inhibition, we performed Western blot analysis on capacitated sperm (Figure 4A and B). The results showed that, compared to the capacitation (Cap) and DMSO vehicle (CM + DMSO) groups, RPN13 abundance was significantly increased in sperm treated with the RA190 inhibitor (P < 0.01), indicating that RA190 successfully prevented its degradation. Furthermore, Co-IP experiments revealed that in the presence of RA190, the interaction between RPN13 and RPN2 was significantly reduced (P < 0.05) (Figure 4C).
Effect of the RPN13 inhibitor (proteasome subunit inhibitor) RA190 on RPN2 and RPN13 in capacitated sperm. (A) Western blot analysis of RPN2 and RPN13 in capacitated sperm (Cap), vehicle-treated capacitated sperm (CM + DMSO) and sperm treated with 2 μM RA190 in capacitating medium (CM + RA190). (B) Densitometric quantification of RPN2 and RPN13 bands normalized to GAPDH. (C) Co-immunoprecipitation analysis of RPN13 and RPN2 in sperm from the Cap, CM + DMSO and CM + RA190 groups. Input lanes in panel C are shown only to verify protein presence in the Co-IP assay and were not used for between-group densitometric comparisons, because the loading fraction and exposure settings differed from those used for the whole-lysate western blots in panels A–B. Data are presented as Mean ± SD. Statistical markers indicate significant differences compared to the CM + DMSO vehicle control (*P < 0.05 or **P < 0.01).

Immunofluorescence localization of RPN13 and RPN2
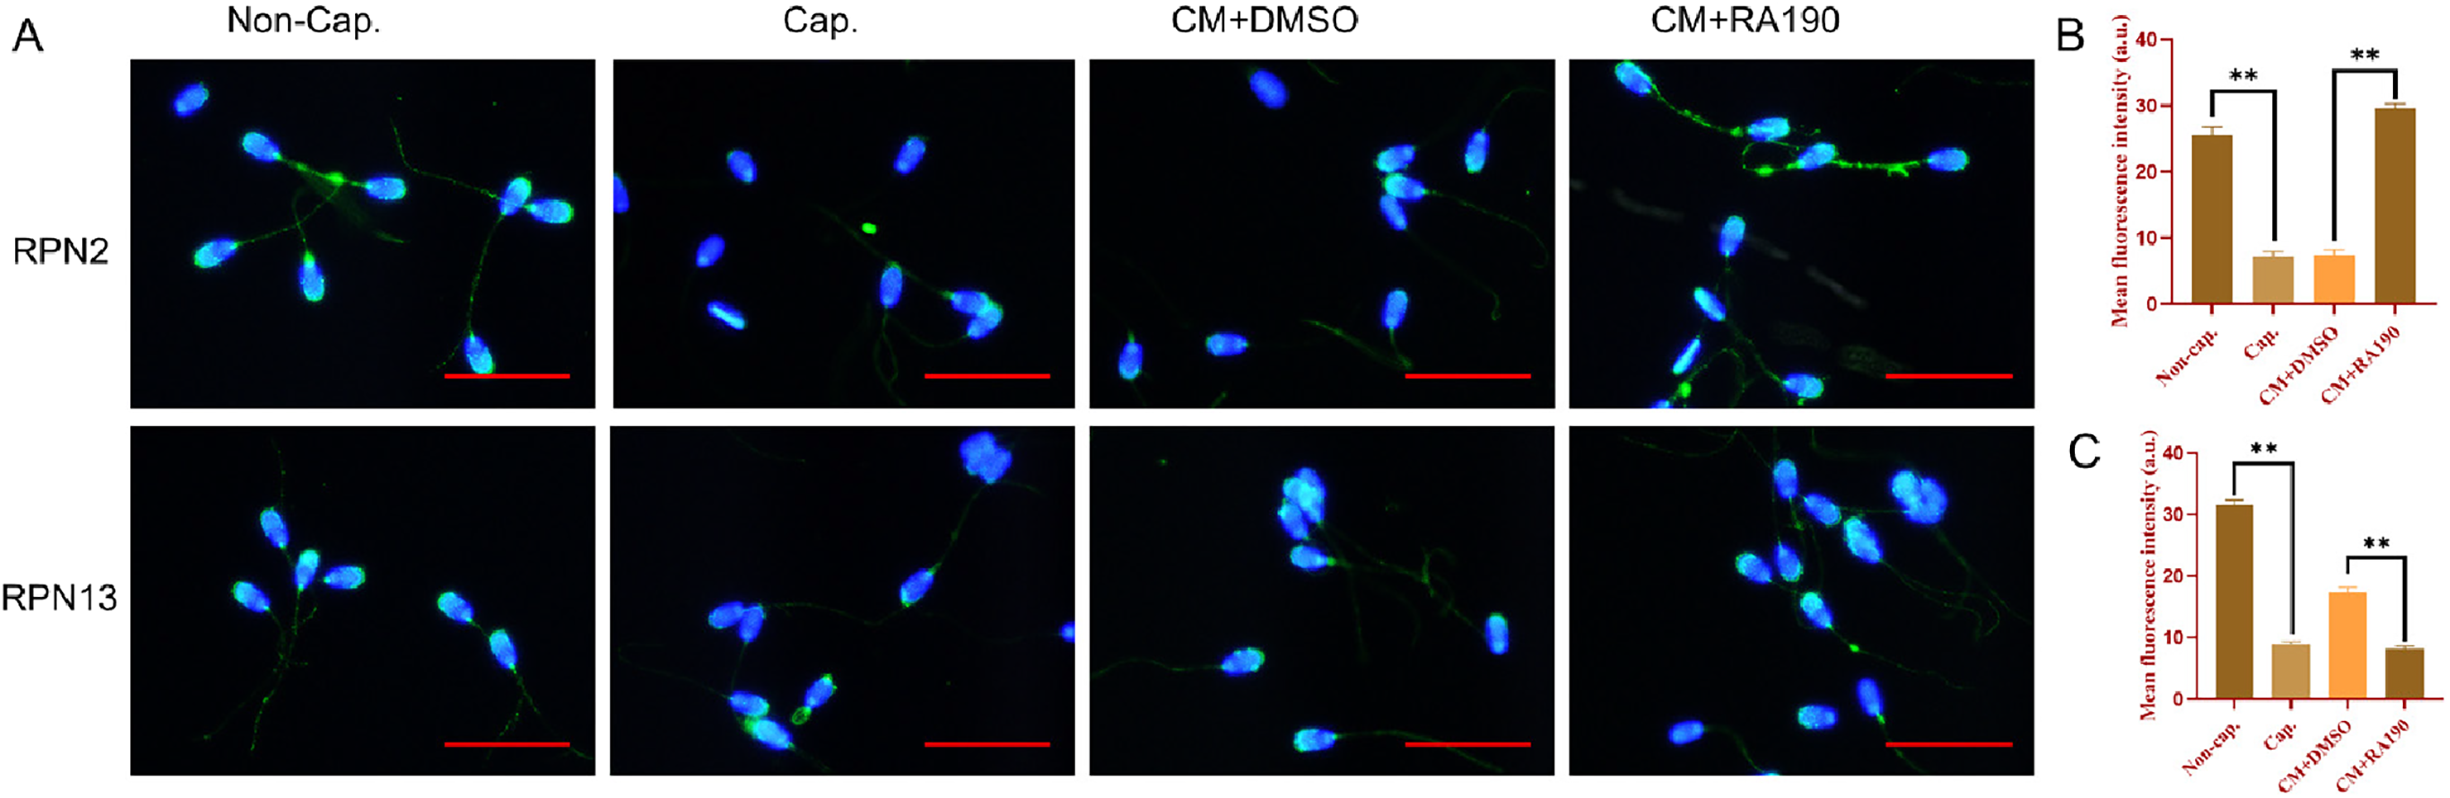
Immunofluorescence localization analysis further supported the changes observed by Western blotting (Figure 5A–C). RPN13 and RPN2 signals were mainly distributed in the acrosomal region and tail of spermatozoa. Based on separately stained images, the two proteins showed broadly similar regional distribution patterns; however, direct dual-colour co-localization was not assessed in the present study. Consistent with the Western blot data, a significant reduction in fluorescence intensity for both RPN13 and RPN2 was observed in the Cap group compared with the Non-Cap control. Conversely, treatment with RA190 attenuated this reduction. In addition, RPN2 fluorescence in the flagellar region appeared to decrease after capacitation, and this decrease was attenuated by RA190 treatment. Both RPN13 and RPN2 signals were also frequently observed in cytoplasmic droplets.
Immunofluorescence localization of RPN13 and RPN2. (A) Representative single-label immunofluorescence images showing the localization patterns of RPN13 and RPN2 in spermatozoa from the four treatment groups: Non-Cap (4 h, -BSA), Cap (4 h, +BSA), CM + DMSO and CM + RA190. DAPI was used to counterstain nuclei where applicable. Scale bar: 20 μm. (B) Quantification of mean fluorescence intensity of RPN13 across the four treatment groups. (C) Quantification of mean fluorescence intensity of RPN2 across the four treatment groups. Data are presented as Mean ± SD. Statistical markers indicate significant differences (P < 0.05) relative to the Non-Cap control or the CM + DMSO control.

RPN13 inhibition impairs all key capacitation hallmarks
Having established this successful capacitation, we investigated the role of RPN13 in these key events. Treatment with the RPN13 inhibitor RA190 significantly impaired all three key markers. Compared to the CM + DMSO vehicle control, RA190-treated sperm showed a significant reduction in the percentage of hyperactivated sperm (Table 1, P < 0.05), a significant reduction in protein tyrosine phosphorylation (pTyr) levels (Figure 1, P < 0.05) and a significant attenuation of the capacitation-associated increase in Fluo-4 fluorescence (gMFI) compared with the CM + DMSO vehicle control (Figure 2D, P < 0.05). Representative single-sample histograms, overlay histograms and fluorescence micrographs are shown in Figure 2A–C. In addition, Co-IP analysis showed that the ubiquitin signal associated with RPN13 was reduced in the CM + RA190 group relative to the CM + DMSO group (Figure 1C, P < 0.05).
Capacitation enhances sperm bioenergetics, which is disrupted by RA190
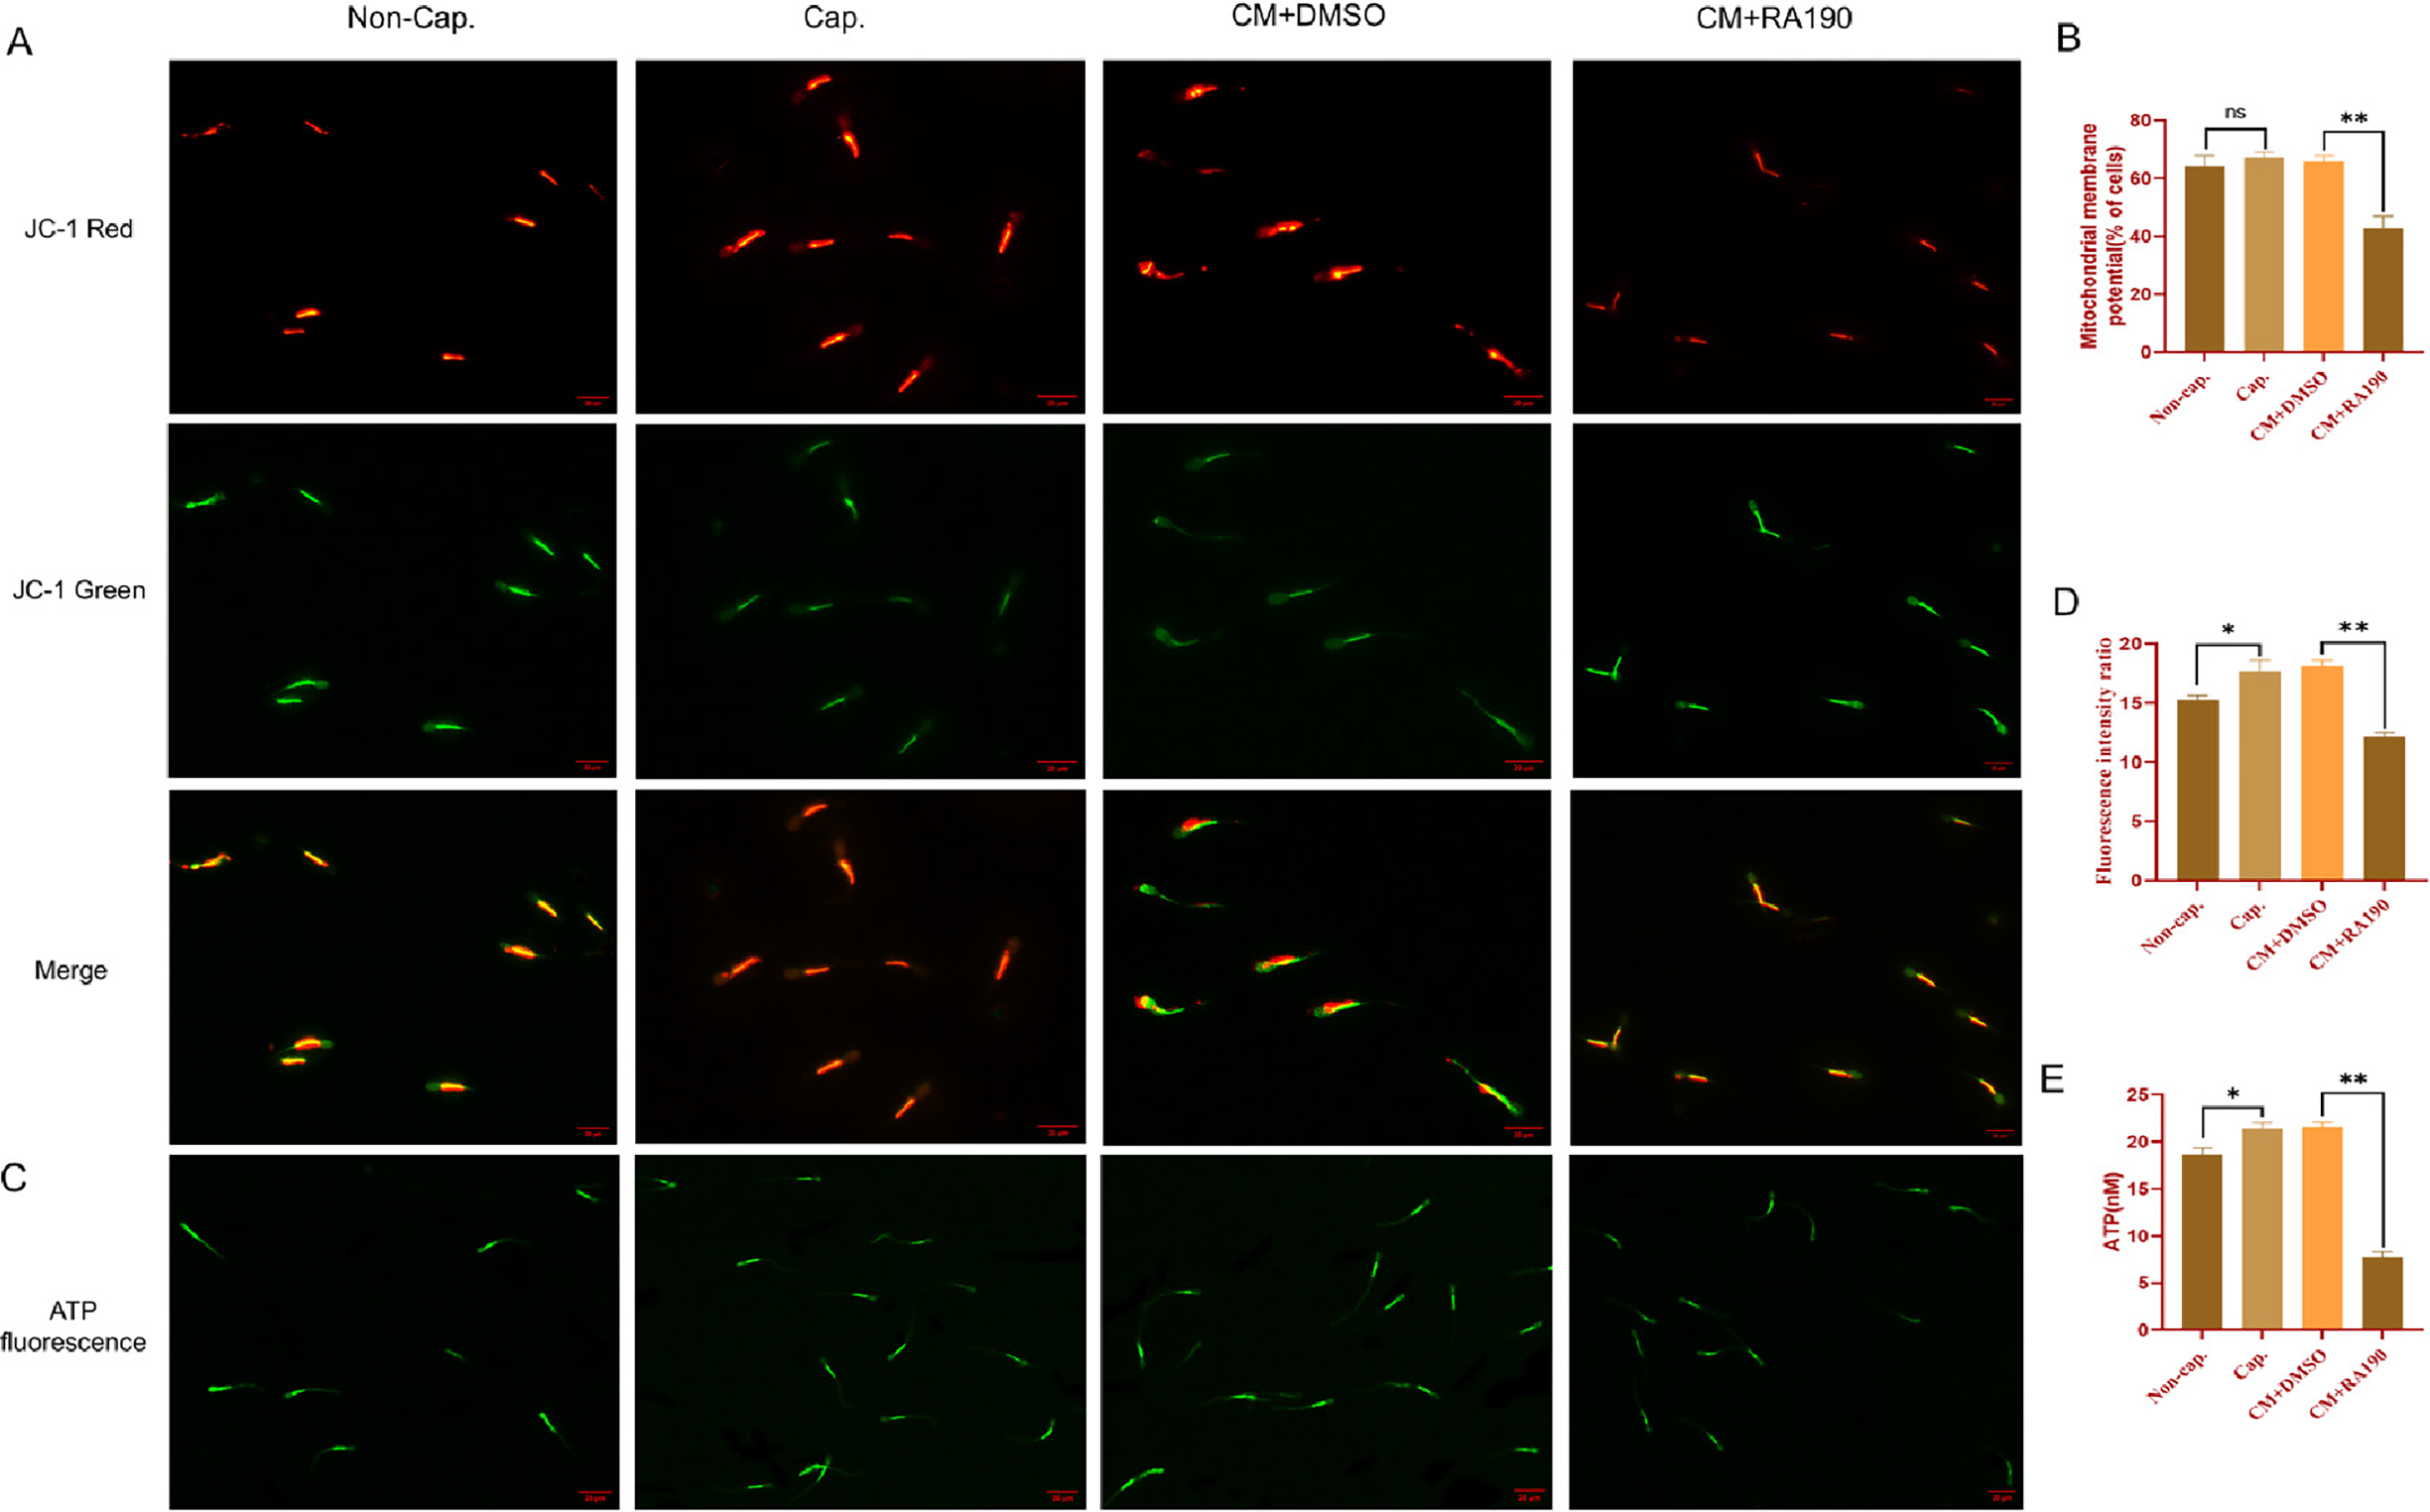
We also assessed the bioenergetic state (Figure 6) that supports these events. The proportion of sperm with high mitochondrial membrane potential (ΔΨm) was significantly higher in the Cap group compared to the Non-Cap control (P < 0.05). This capacitation-associated increase was significantly attenuated by RA190 treatment (P < 0.01). Intracellular ATP levels followed a similar pattern: ATP was significantly elevated in the Cap group relative to the Non-Cap control (P < 0.05), while RA190 treatment caused a significant decrease in ATP relative to the CM + DMSO group (P < 0.01).
Effect of RA190 on sperm bioenergetics during capacitation. (A) Representative JC-1 micrographs (aggregates = red, high ΔΨm; monomers = green, low ΔΨm) for all four treatment groups: Non-Cap, Cap, CM + DMSO and CM + RA190. Scale bar: 20 μm. (B) Proportion of sperm with JC-1 aggregate staining (high ΔΨm) from all four groups (200–300 cells counted per sample). (C) Representative images of BODIPY™ FL ATP fluorescence (ATP-associated fluorescence patterns) in sperm from all four groups. Scale bar: 20 μm. (D) Quantification of the JC-1 red/green fluorescence intensity ratio (aggregate/monomer) in all four groups. (E) Quantification of intracellular ATP concentration measured using the luciferase-based Enhanced ATP Assay Kit in all four groups. Data are presented as Mean ± SD. Statistical markers indicate significant differences (*P < 0.05 or **P < 0.01) relative to the Non-Cap control or the CM + DMSO control.

RPN13 activity contributes to sperm–Zona pellucida binding and early embryo cleavage after IVF
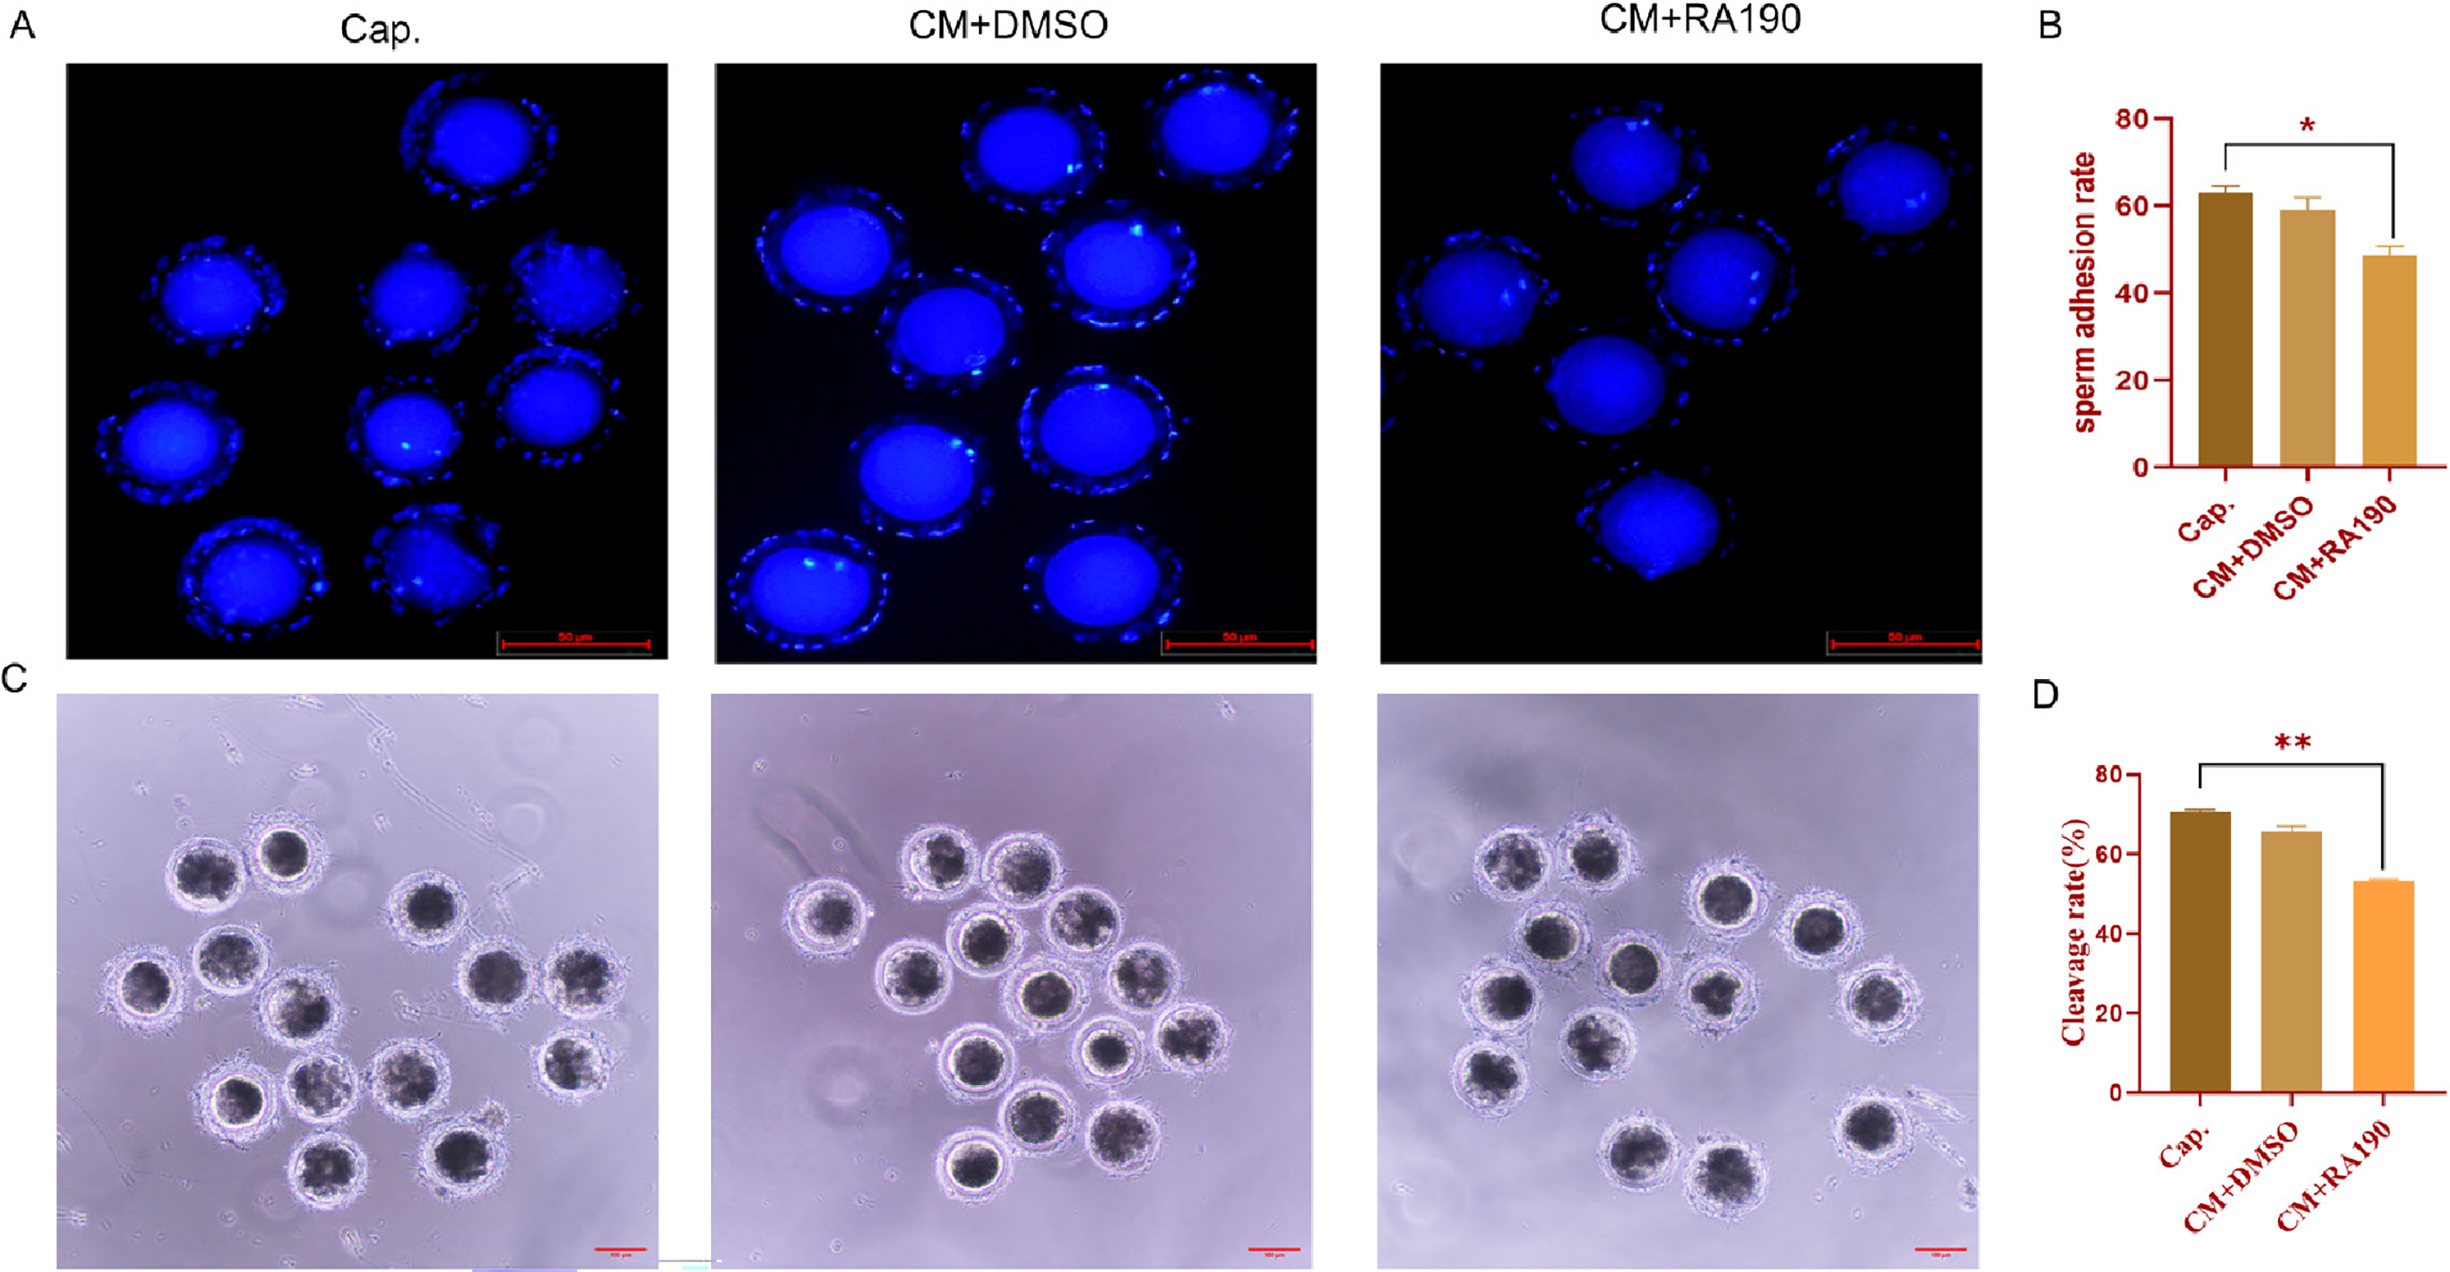
Finally, we assessed fertilization-related functional endpoints, including sperm–ZP binding and early embryo cleavage after IVF (Figure 7). We assessed the ability of capacitated sperm to bind to the zona pellucida. ZP-bound sperm counts per oocyte were significantly lower in the CM + RA190 group than in the Cap group (Figure 7B, P < 0.05); compared with the CM + DMSO group, the same downward trend was observed but did not reach statistical significance (P > 0.05). The subsequent early embryo cleavage rate after IVF mirrored these findings (Figure 7C–D). The cleavage rate in the CM + RA190 group was significantly lower than that in the Cap group (P < 0.01), whereas the reduction relative to the CM + DMSO group did not reach statistical significance (P > 0.05).
RPN13 activity contributes to sperm–zona pellucida (ZP) binding and early embryo cleavage after IVF. (A) Representative Hoechst 33342 staining used to visualize the nuclei of spermatozoa attached to the ZP. Images are shown for the capacitated control (Cap), vehicle control (CM + DMSO) and inhibitor-treated (CM + RA190) groups. Scale bar: 50 μm. (B) Quantification of ZP-bound sperm counts per oocyte (number of ZP-bound sperm per oocyte) in mature porcine oocytes from the three capacitated groups. (C–D) Bright-field images and quantification of early embryo cleavage after IVF using sperm from the Cap, CM + DMSO and CM + RA190 groups. Scale bar: 100 μm. Data are presented as mean ± SD. Key pairwise comparisons are indicated on the plot.

Figure 7. Long description
Panel A: Three images showing Hoechst 33342 staining to visualize the nuclei of spermatozoa attached to the zona pellucida (ZP) in different groups: capacitated control (Cap), vehicle control (CM+DMSO), and inhibitor-treated (CM+RA190). Each image shows multiple sperm cells with blue-stained nuclei. Panel B: A bar graph quantifying the number of ZP-bound sperm per oocyte in the three capacitated groups. The y-axis represents the sperm adhesion rate, and the x-axis lists the groups (Cap, CM+DMSO, CM+RA190). The graph shows a significant difference between the groups, indicated by an asterisk. Panel C: Three bright-field images showing early embryo cleavage after in vitro fertilization (IVF) using sperm from the Cap, CM+DMSO, and CM+RA190 groups. Each image shows multiple embryos at different stages of cleavage. Panel D: A bar graph quantifying the cleavage rate in percent for the three groups. The y-axis represents the cleavage rate, and the x-axis lists the groups (Cap, CM+DMSO, CM+RA190). The graph shows a significant difference between the groups, indicated by two asterisks.
Discussion
Sperm capacitation is an essential physiological process that enables ejaculated, motile spermatozoa to acquire hyperactivated motility and fertilizing ability. During capacitation, spermatozoa undergo hyperactivation, become capable of undergoing acrosomal exocytosis and acquire the ability to bind to the zona pellucida and support fertilization; perturbations at any of these steps can therefore reduce fertilization efficiency and compromise subsequent embryonic development (Pitnick et al., Reference Pitnick, Wolfner and Dorus2020; Keller and Kerns, Reference Keller and Kerns2023). Within this functional framework, regulated protein turnover – in particular the UPS – has emerged as a key determinant of sperm remodelling during capacitation. By recognizing and degrading ubiquitinated proteins, the proteasome contributes to the dynamic proteomic changes that underlie motility, signalling and acrosomal preparedness (Yin et al., Reference Yin, Popelka, Lei, Yang and Klionsky2020).
In this study, we focused on two proteasomal receptors, RPN13 and RPN2, and their regulation during porcine sperm capacitation in vitro. Using an in vitro model that compared sperm incubated for 4 h in capacitating medium (+BSA) to a time-matched, non-capacitating control medium lacking BSA (Non-Cap), we observed two robust, capacitation-specific features: (1) RPN2 and RPN13 protein levels significantly decreased, and (2) the interaction between RPN13 and RPN2 was markedly enhanced. These findings indicate that regulated turnover of both subunits, together with enhanced RPN13–RPN2 association, is a characteristic molecular feature of capacitation. The reduction in steady-state levels is consistent with regulated ubiquitination and subsequent proteasome-mediated turnover, a process that may contribute to the remodelling of proteasomal subcomplexes or substrate recruitment machinery during capacitation (He et al., Reference He, Kulkarni, da Fonseca, Krutauz, Glickman, Barford and Morris2012; Yau et al., Reference Yau, Sander, Eidson and Courey2021).
We then pharmacologically perturbed RPN13 function using RA190, a bis-benzylidine piperidone that covalently binds to cysteine 88 of RPN13 and inhibits its ubiquitin receptor activity (Anchoori et al., Reference Anchoori, Karanam, Peng, Wang, Jiang, Tanno, Orlowski, Matsui, Zhao and Rudek2013; Soong et al., Reference Soong, Anchoori, Roden, Cho, Chen, Tseng, Huang, Liao and Shyu2020). RA190 treatment altered the molecular signatures we measured and produced concordant functional impairments. RA190-induced accumulation of RPN13 together with reduced RPN13–RPN2 association suggests that pharmacologic inhibition of RPN13 stabilizes the protein while perturbing its interaction with proteasomal partners. Crucially, our model first established that capacitation successfully induced both protein tyrosine phosphorylation (pTyr) and sperm hyperactivation – key functional and molecular hallmarks of this process. RA190 treatment significantly attenuated both this pTyr signalling and the percentage of hyperactivated sperm. Concurrently, it also attenuated the capacitation-associated Ca2+ influx, decreased mitochondrial polarization and intracellular ATP, lowered zona pellucida binding rates and led to a significantly reduced early embryo cleavage rate after IVF (P < 0.01). These data indicate that ubiquitin-dependent modulation of RPN13 is associated with acquisition of capacitation-related phenotypes and subsequent fertilization-related events. Together, these findings support the view that RPN13 activity contributes to the acquisition of fertilization-related competence during capacitation.
Beyond a general role in protein turnover, our data allow us to propose more specific, testable hypotheses regarding the mechanistic role of RPN13. The attenuation of the Ca2+-associated Fluo-4 fluorescence signal and pTyr by RA190 suggests that RPN13 may be required for the degradation of a tonic inhibitor of calcium channels or a negative regulator of the cAMP/PKA pathway. Its accumulation upon RPN13 inhibition would prevent the sustained Ca2+ rise and tyrosine phosphorylation necessary for hyperactivation. Similarly, the bioenergetic defects could arise from the failed clearance of damaged mitochondrial proteins, leading to oxidative stress and inefficient ATP production. Future proteomic studies identifying the ubiquitinated substrates that accumulate upon RPN13 inhibition are needed to pinpoint these putative regulators. This proposed model, wherein RPN13-dependent proteasomal activity supports the turnover of factors that sustain Ca2+ signalling, phosphorylation cascades, mitochondrial integrity and surface remodelling for zona recognition (Balbach et al., Reference Balbach, Hamzeh, Jikeli, Brenker, Schiffer, Hansen, Neugebauer, Trötschel, Jovine and Han2020; Takei, Reference Takei2024), provides a framework for these future investigations.
Several non-exclusive alternative mechanisms deserve consideration. RA190 could exert off-target effects or interfere with deubiquitinating enzymes (e.g., UCH37) and scaffolding interactions that indirectly impair mitochondrial quality control or membrane remodelling (Zhu et al., Reference Zhu, Cao, Mo, Shi, Hu, Xu, Quan, Liang, Li and Hong2023). Accumulation of ubiquitinated or misfolded proteins might provoke proteotoxic stress that secondarily perturbs electron transport. Our CASA data (Table 1) argue against gross cytotoxicity: although RA190 caused a modest but significant reduction in TM and PM relative to the vehicle control (P < 0.05), sperm remained largely motile, whereas hyperactivation (HA%) and canonical capacitation-associated signalling (pTyr and Ca2+ influx) were markedly impaired. This pattern is consistent with prior observations that proteasome perturbation can compromise boar sperm motility parameters; for example, MG-132 has been reported to reduce motility in boar spermatozoa (Hackerova et al., Reference Hackerova, Klusackova, Zigo, Zelenkova, Havlikova, Krejcirova, Sedmikova, Sutovsky, Komrskova, Postlerova and Simonik2023). Together, these findings support a link between UPS/proteasome regulation and sperm kinematic performance during capacitation. This pattern is more consistent with a capacitation-focused functional disruption than with a generalized loss of sperm viability. This suggests that the observed ΔΨm/ATP defects are not simply explained by gross cytotoxicity but rather a specific impairment of capacitation-related bioenergetics.
We also acknowledge that the Non-Cap control used in the present study was generated by omitting BSA from the capacitation medium, while bicarbonate and calcium were retained. Although this condition was sufficient to distinguish Non-Cap and Cap sperm in terms of protein tyrosine phosphorylation, hyperactivation and Ca2+-associated Fluo-4 fluorescence, future studies should use a more stringent non-capacitating medium lacking BSA, bicarbonate and calcium to further minimize activation of capacitation-related signalling pathways.
Because dual-colour immunofluorescence staining was not performed in the present study, the current localization data support broadly similar regional distribution patterns of RPN13 and RPN2 but do not provide direct evidence of their subcellular co-localization. Future studies using dual-label immunofluorescence and confocal microscopy are needed to confirm the spatial relationship between RPN13 and RPN2 in capacitated spermatozoa.
In conclusion, this study directly addresses the knowledge gap identified in the introduction – the poorly understood role of specific proteasomal receptors in sperm capacitation. We have moved beyond correlative evidence by demonstrating that RPN13 and RPN2 are dynamically regulated and that RPN13 function is non-redundant for the acquisition of fertilizing ability. Our work establishes RPN13 as a key node linking UPS-dependent proteolysis to the functional maturation of sperm and provides a mechanistic foundation for future investigations into its specific substrates and signalling partners.
Conclusions
In summary, by using a time-matched non-capacitating control, our data reveal capacitation-associated regulation of RPN2 and RPN13 and support the contribution of RPN13 activity to key capacitation events and fertilization-related competence. These findings provide novel insights into the role of the proteasome in sperm biology and underscore RPN13 as a critical player in capacitation.
Future studies should prioritize defining ubiquitin-dependent regulation of RPN13 (e.g., identifying ubiquitinated species associated with RPN13 under capacitation and, if present, mapping RPN13 ubiquitination sites) and identifying its client proteins via mass spectrometry-based proteomics, coupled with direct measurement of 20S/26S proteasome activity under RPN13 inhibition.
Data availability
The data that support the findings of this study are available from the corresponding author upon reasonable request.
Acknowledgements
This study was supported by the National Natural Science Foundation of China (grant number 32360834).
Author contributions
Zhiwei Yao: Writing–original draft, Writing–review and editing, Validation, Methodology, Formal analysis, Data curation. Lipeng Cao: Writing–review and editing, Methodology, Investigation, Formal analysis, Data curation. Jie Wang: Methodology, Investigation. Kun Zhao: Methodology. Xuan Chen: Investigation. Yanqiu Lv: Conceptualization, Data curation, Writing–original draft, Writing–review and editing. Yi Jin: Conceptualization, Formal analysis, Funding acquisition, Methodology, Writing–original draft, Writing–review and editing.
Competing interests
The authors declare no conflict of interest.
Ethical standards
All procedures followed the Guide for the Care and Use of Laboratory Animals (8th ed., National Research Council) and were approved by the Experimental Animal Ethics Committee of Yanbian University (approval no. YD20250304007). The study is reported in compliance with ARRIVE guidelines.