I. INTRODUCTION
Owing to the rapid growth of subscribers in wireless communication systems [1] and the emergence of new communication standards, such as worldwide interoperability for microwave access (WIMAX) and 4 G long-term evolution (LTE), the mobile radio base stations (RBSs) must process different types of standards in increasing number of frequency bands. At the core of the RBS, the power amplifier (PA) is one of the most critical components since its performance affects the overall system performance in terms of output power, bandwidth, and efficiency [Reference Cripps2, Reference Colantonio, Giannini and Limiti3]. Modulation schemes, such as orthogonal-frequency-division multiplexing (OFDM), and quadrature amplitude modulation (QAM) are used in modern wireless communication systems to maximize the spectral efficiency [Reference Cripps2]. These modulation schemes result in signals with large amplitude variations and peak to average power ratios (PAPRs) in the range of 6–12 dB [Reference Misra4, Reference Sobol and Tomiyasu5]. In order to prevent strong distortion of the signal, these signals require the PA to operate at an average output power far below from the saturation region and hence, at low-efficiency levels.
Various techniques have been proposed to enhance the efficiency of PAs at back-off operation. Dynamic supply modulation (DSM) [Reference Raab6, Reference Raab7] and dynamic load modulation (DLM) [Reference Fager, Gustavsson, Nemati and Zirath8] have proven themselves to be the most promising methods. The DSM method requires efficient DC/DC converter as well as efficient envelope tracking amplification, whereas the DLM may be realized using extra active devices as implemented in Doherty amplifiers [Reference Doherty9] or using passive components [Reference Brown10]. In terms of cost, complexity, and additional power consumption, DLM using passive components seems to be more efficient than DSM and Doherty amplifiers in spite of the challenges in the dynamic range of power detector and the required speed to follow the envelope variation.
DLM can be realized by tunable matching networks (TMNs) using conventional passive components such as micro-electro-mechanical systems (MEMS) [Reference Brown10] semiconductor or ferroelectric-based varactors [Reference Nemati, Fager, Gustavsson, Jos and Zirath11]. Alternatively, passive load modulation technique using barium–strontium–titanate (BST) varactors can be implemented [Reference Nath12]. Recently, thick-film BST components have demonstrated promising perspectives in terms of tunability with high-power capability [Reference Bengtsson13]. Generally, BST-based TMN does not add any extra power consumption to the whole design due to the nA-range DC current leakage. The TMN, which presents different load impedances at various power levels, can be deployed to compensate the amplitude and phase distortions generated by the transistor [Reference Fu and Mortazawi14]. The use of this promising technology opens new horizons to PA design with high efficiency at backed off power levels with low cost, low complexity, and low-power consumption. This paper is an extension and further work of [Reference Arnous, Wiens, Preis, Maune, Bathich, Nikfalazar, Jakoby and Boeck15], where a broadband load-modulated PA using BST-based TMN was introduced for the first time as a main part of the matching network and used for load modulation. In this article, a new PA using distributed and lumped components has been designed and implemented to operate in the same band of the BST-based PA (BST-PA). This PA can be considered as a reference design to evaluate the performance of the BST-PA. The new PA tunability method is realized by changing the lumped components values of the output matching network (OMN) according to the output power level. Therefore, efficiency enhancement could be achieved at back-off output power level over the whole bandwidth. Both PA concepts are evaluated and compared in terms of large-signal measurements at maximum as well as 6 dB output back-off (OBO) power level.
The paper is organized as follows: the active device used in these PAs is characterized in Section II, while the design approach of matching networks is presented in Section III. The experimental results of both PAs are presented, compared, and discussed in Section IV. Finally, conclusions drawn from this work are given in Section V.
II. DEVICE CHARACTERIZATION
To design the proposed PAs, a 25 W GaN-HEMT packaged device (CGH40025) [16] was selected as the active device. The first step to design the PAs was to characterize the transistor. The device was biased in class AB mode with a drain voltage of V DD = 28 V and a drain current of I DQ = 135 mA. A harmonic load-pull simulation was used to extract the optimum load impedances at fundamental, second, and third harmonics of the transistor over the desired bandwidth. The optimum load impedances ensure a high-power added efficiency (PAE) at various output power levels across the desired bandwidth. The optimum output impedance varies with both power and frequency. When the power level drops from 44 to 35 dBm, the desired impedance becomes more inductive as depicted in Fig. 1. In addition, the trajectory of the optimum load impedances at 1.8, 2.0, and 2.2 GHz at various output power levels are illustrated separately. Simultaneously, the real part of the optimum load impedance varies between 5 and 14 Ω over the design band. Moreover, the figure depicts the safe region of the second harmonic load impedances, where the PAE is reserved at maximum available value across the bandwidth at various output power level. Consequently, load modulation of the OMN is necessary to realize these different load impedances.
Optimum fundamental load impedances (Z opt−Load) contours at 1.8, 2.0, and 2.2 GHz (triangles, squares, and circles respectively) at 44, 41, 38, and 35 dBm output power levels. Second harmonic load impedance safe region (dark zone). Optimum fundamental source impedances (Z opt−Source) at maximum output power level (gray shaded circle) across the bandwidth.

The effect of the harmonic load impedances on output power and efficiency was analyzed and considered in this study. The phase and the magnitude of the second harmonic were varied across the periphery of the Smith chart in order to study their influences on the performance of the device. Figure 2(a) shows the PAE versus the phase variation of second harmonic and magnitude at the center frequency (2.0 GHz), where the third harmonic was shorted during this analysis. It is noticed that the PAE was rather independent of the second harmonic phase except the region (170°–300°). In this region, the efficiency performance of the active device was dramatically degraded. Whereas, the magnitude influence of the second harmonic reflection coefficient, which is illustrated in the same figure, had less influence on the performance of the PA than the phase of the reflection coefficient. By maintaining a high magnitude of the second harmonic load reflection coefficient and simultaneously avoiding operation at critical phase zones, near short-circuit termination, will result in high-efficiency performance of the PA over the desired bandwidth. Moreover, the impact of the third harmonics was also analyzed at the center frequency (2.0 GHz) by fixing the second harmonic gamma load (Г2f0) in the safe region with a magnitude of 0.9 and phase of 120° as shown in Fig. 2(b). It shows the maximum PAE which can be reached of the device versus the phase variation of the third harmonic impedances.
(a) Influence of the second harmonic reflection coefficient phase and magnitude on PAE at f 0 = 2.0 GHz. (b) Influence of the third harmonic reflection coefficient phase on PAE across the bandwidth with Г2f0 = 0.9/120° at V DD = 28 V, I DQ = 135 mA.
Finally, the optimum source impedances of the transistor were extracted in a similar analysis. Figure 1 also shows the optimum fundamental source impedances (Z opt−Source) location range across the bandwidth. Based on the extracted impedances, the input matching network (IMN) was designed to ensure high and flat gain behavior over the whole bandwidth. The implemented IMN consists of stepped transmission lines and a single stub to compensate the parasitic effects at the input of the device [16]. An important factor regarding the design of the IMN was to obtain unconditionally stable transistor operation which is represented by stability factor K that must be larger than unity over the whole frequency spectrum. For this purpose, a series resistor was added at the input of the amplifier and bypassed by a capacitor to improve the stability at higher frequencies without causing a degradation of the gain across the bandwidth. Moreover, a parallel resistor was applied to the gate side to ensure the stability at lower frequency bands. Finally, an additional shunt RC network was added to the design to enhance the stability over the whole frequency spectrum. The IMN for both designs had the same topology to have a reasonable comparison between them.
The goal of both PAs is to provide high efficiency at maximum and OBO levels across the desired band. Therefore, a TMN is required to change the load impedances according to the output power levels. In the first design, capacitor power amplifier (CAP-PA), the OMN will be tuned manually by replacing the capacitors according to the required output power level; whereas in the second design (BST-PA), the OMN will be tuned by adjusting the control voltage of the BST-based TMN.
III. MATCHING NETWORK DESIGN APPROACHES
The OMN design approaches of both designs based on the characterization analysis in Section II are presented here.
A) First design using lumped capacitors (CAP-PA)
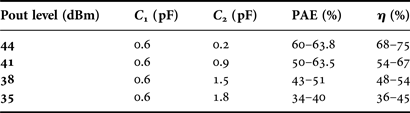
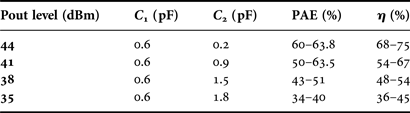
A multi-stage low-pass filter was used in the CAP-PA design. The OMN consists of three L-type matching networks in cascade, which is called two-stage ladder matching network. The advantage of ladder network over the П type network is that for higher impedance transformation ratios, the Q of a three-stage network is significantly lower and ensures a good matching across the bandwidth. However, this lower Q yields higher losses over the bandwidth. In this OMN, all lumped components were converted step by step to distributed components; expect two capacitors C 1 and C 2. They were used to tune the PA to get the maximum available efficiency depending on the output power level. Table 1 shows the required capacitance values at various output power levels. The table shows that C 1 can be fixed and converted to shunt stub based on simulation results. Nevertheless, it is more convenient to use a lumped component in order to be able to tune the design further after its fabrication.
Required capacitance values based on various output power levels at 1.8–2.2 GHz.
Based on these extracted values, the OMN was simulated and the reflection coefficient of matching network at the drain reference plane was considered. Figure 3 shows the reflection coefficient of matching network by changing the capacitance values based on required output power from high to low level, respectively. The simulation results show that the fundamental as well as the second harmonic response of the matching network were adjusted in safe region as shown in Fig. 3.
ГLoad simulation results of realized output matching network changing capacitance values based on required output power levels at 44, 41, 38, and 35 dBm (square, circle symbols, light, and dark lines, respectively) across 1.8–4.4 GHz.
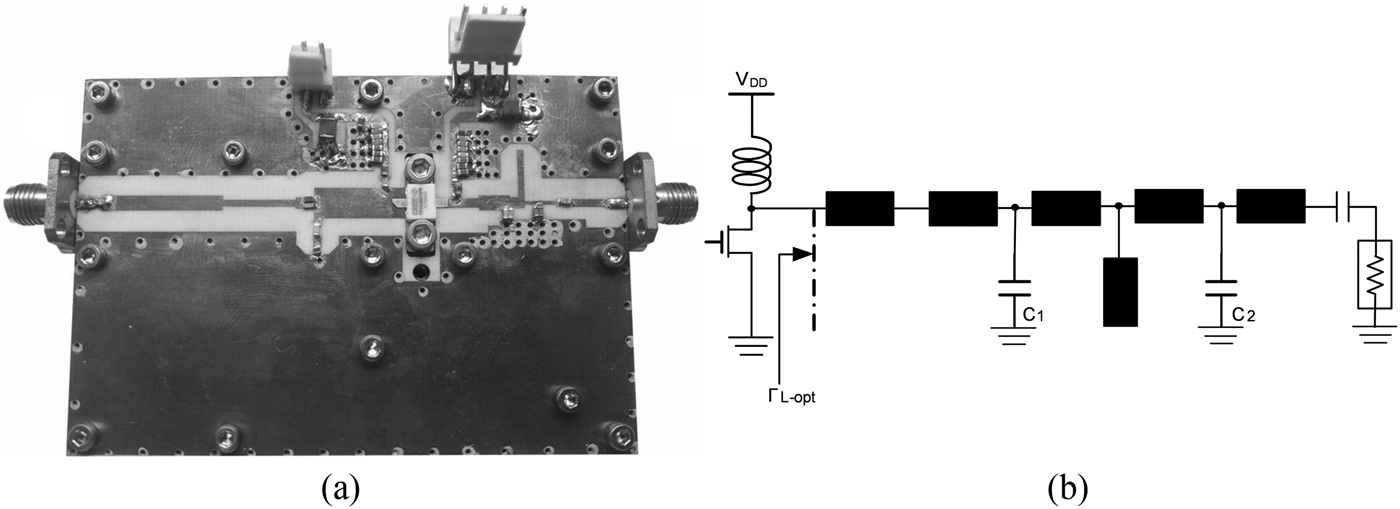
The schematic of the OMN design as well as the prototype is shown in Fig. 4. The broadband PA structure was realized on a Rogers 4003C (ε r = 3.55) substrate with a thickness of 508 µm. The size of the realized PA, shown in Fig. 4(a), is 8 cm × 5.5 cm.
(a) Prototype of the PA. (b) The output matching network schematic.
B) Second design using BST (BST-PA)
The main difference between the two designs is the tunability approach. The load is tuned electronically with BST-based varactors in this design. BST has an E-field-dependent permittivity, and hence allows the fabrication of electrically tunable inter digital capacitor (IDC) varactors as depicted in Fig. 5. Moreover, BST has moderate insertion loss tan D ~ 0.01 in telecommunication frequency range and offers sufficient tunability τ(400 V) in the range of 40–80% depending on the technology and the tuning field applied. Here, the tunability is defined as capacitance change normalized to the un-tuned capacitance. The mathematical relationship between the bias voltage and the capacitance is expressed in (1).
 $$\tau \lpar V\rpar =\displaystyle{{C\lpar 0\rpar - C\lpar V\rpar } \over {C\lpar 0\rpar }}\comma$$
where τ(V) is the tunability range with respect to V; V is the applied control voltage of the BST; C(0) the tunable capacitance at V = 0; C(V) the tunable capacitance with respect to V.
(a) Top view of IDC varactor pair. (b) Cross-section of the IDC with DC-bias-field penetrating the BST layer.
For the presented work, thick-film technology was chosen over thin-film technology, due to the requirements, such as linearity and tuning voltage. The fabrication and processing of BST as well as the realization of tunable components based on BST thick-films can be found in [Reference Menesklou, Paul, Zhou, Elsenheimer, Binder and Ivers-Tiffee17, Reference Maune, Sazegar, Zheng, Zhou, Giere and Scheele18]. The gaps of the IDC fingers were set to g = 15 µm which is a compromise between linearity and tunability.
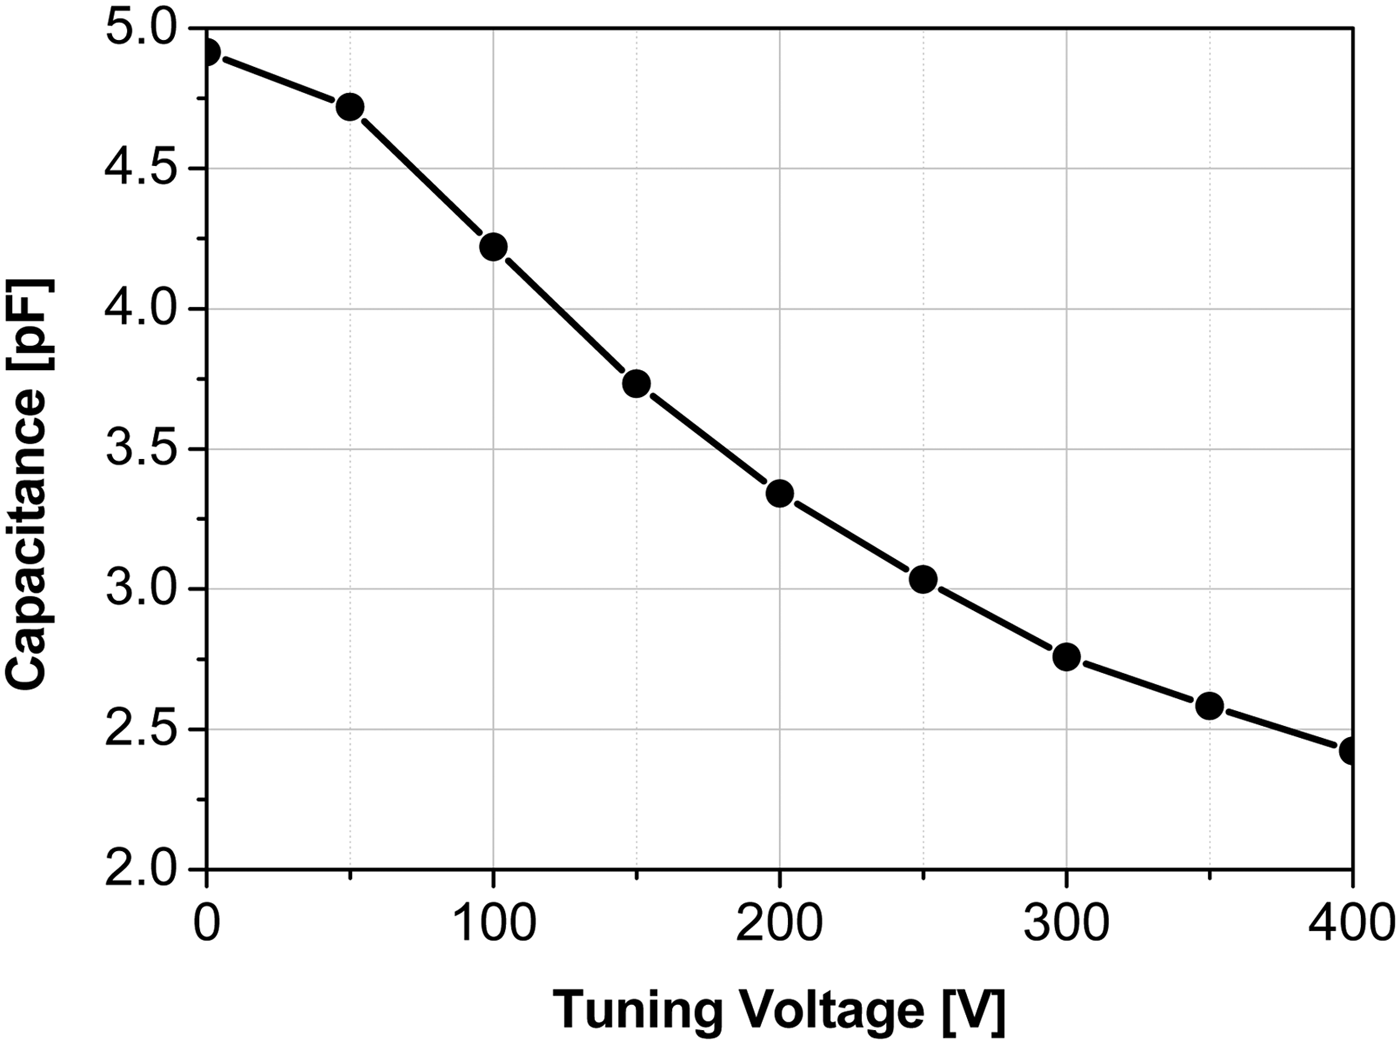
The measured capacitance drop of IDC processed on top of a BST thick-film layer is depicted in Fig. 6. The figure illustrates a measured tunability of τ(400 V) = 50% which corresponds an electrical field of 26 V/μm. Further increase in bias voltage can lead to higher tunability. However, it is limited by the breakdown voltage through air, and can be extended further by passivation.
Tunability of an IDC with 15 µm finger gap.
The OMN considers just the fundamental load impedances, due to the limited tuning range in the BST as mentioned previously. The schematic of the OMN is presented in Fig. 7(a) and was realized through two steps. First, a fixed pre-matching network was required to overcome the tunability limitation of the BST and to realize a broadband matching network. The pre-matching network which consists of stepped transmission line sections, shown in Fig. 7(a), was used to transform the low optimum load impedances of the transistor to appropriate impedances for the BST-based TMN. Figure 7(b) shows the optimum load impedances of the pre-matching network (Z opt/Pre) contours on Smith chart at different output power levels of 44, 41, 38, and 35 dBm, respectively over the design band. Next, the BST-based TMN structure should provide the required (Z opt/Pre) over the design bandwidth, and transform them directly to 50 Ω. Figure 7(a) illustrates the proposed circuit diagram of the TMN. The thick-film BST-based TMN was controlled by changing DC voltages of both shunt varactors in order to provide these different pre-matched load impedances as shown in Fig. 7 and capable to sustain a high-power level. In this design, the required impedance area was relatively large as observed in Fig. 7(b). Therefore, a high tuning control voltage range is required to cover the whole area.
(a) The output matching network schematic with pre-matching network and proposed circuit of the BST-based TMN structure. (b) Optimum pre-matching impedances (Z opt/Pre) values at various output power across the desired band.
1) DESIGN AND FABRICATION OF THE BST-BASED TMN
Starting with the Z opt/Pre of the pre-matched PA as depicted in Fig. 7(b), a TMN was designed and fabricated on a functional layer of BST with a height of 3 µm. The measured tunability of the utilized material (Fe-F co-doped Ba0.4Sr0.6TiO3) exhibits tunability τ(400 V) = 50% as mentioned previously.
The material sustains high voltages which empower fabrication and design of components for high-power applications. The thick-film technology in combination with high tuning voltages allow us to maintain the linearity of the whole design which was investigated in [Reference Bengtsson13] The detailed material properties and fabrication of the co-doped BST layers have been investigated and summarized in [Reference Zhou19]. To overcome the limitation of breakdown through air at high power and the high tuning voltage (higher than 400 V), the fabricated components were coated with SU8 polymer photo resist, which sustains electrical fields larger than 400 V/μm. Figure 8(a) shows the photograph of the fabricated structure along with its equivalent circuit. The initial values of the BST equivalent circuit at zero control voltage is shown in Table 2.
Initial values of the BST equivalent circuit.

The fabricated structure was measured in a 50 Ω system using an Anritsu 37397C vector network analyzer (VNA) with a semi-automatic on-wafer measurement system from Cascade Microtech. To extract the insertion loss of the component, the measured two port S-parameters were renormalized according to [Reference Frickey20]. Figure 8(b) shows the small-signal measurement results obtained at room temperature. The outer graph of Fig 8(b) shows the insertion loss extracted from generalized S-parameters at different tuning voltage levels 0–400 V. The inlay shows the input impedance on the Smith chart for different tuning values at different frequencies. Note that input impedances within the shaded areas can be continuously matched by varying the bias voltage between 0 and 400 V. Detailed simulations and fabrication process can be found in [Reference Wiens21].
(a) Fabricated prototype and the equivalent circuit. (b) Small-signal measurement results of the fabricated TMN.
The application of bias voltage progressively reduces the capacitance values down to 50% of the initial value at a bias voltage of 400 V. For the small-signal measurements, voltages higher than 400 V were not applied to keep a safety margin since in large-signal operation the varactor will have to face a combination of RF voltage and bias voltage. Nevertheless, due to the passivation layer, the actual breakdown of the component has shifted to higher values such that during the large-signal measurements even larger bias values than 450 V have been applied without destroying the component. Further increase in bias-voltage subsequently leads to a slightly larger impedance transformation area than the one depicted in Fig. 8(b).
The broadband tunable PA was realized on a Rogers 4003C (ε r = 3.55) substrate with a thickness of 508 µm. The size of the realized PA, shown in Fig. 9(a), is 8 cm × 5.5 cm. The substrate area around the TMN was gilded to ensure a stable contact between the BST and the rest of the OMN. The TMN was bonded using gold bondwires as shown in Fig. 9(b). The influence of the bondwires was simulated to minimize its impact to the PA performance. The designed load-modulated PA structure was completed using broadband bias tees with the same IMN and stability networks as in CAP-PA design. The PA was finally optimized for high power and efficiency at maximum and 6 dB OBO power operations. The design was implemented to compare between the performance using BST components and fixed capacitors.
(a) Prototype of the BST-PA. (b) Prototype of the BST.
IV. MEASUREMENT RESULTS
A) Small-signal measurements
Both PAs were biased equal with V DD = 28 V and I DQ = 135 mA to measure the small-signal gain. The CAP-PA design showed a good agreement of small-signal gain with simulated results of 15 dB across the whole bandwidth. Figure 10(a) heeds the small-signal gain of the BST-PA design. The figure illustrates the comparison between the simulated and measured gain of the BST-PA design (solid line and square symbols, respectively). The measured gain of the designed PA was shifted down in frequency from the simulated gain. The measured small-signal gain ranged between 11 and 15 dB across 1.6–2.0 GHz as shown in Fig. 10(a) (square symbols). This frequency shift is due to the practical realization of the BST-PA. More precisely, the tolerance of the gap between the BST components and the main substrate as well as the height of the bondwires caused unpredicted extra bondwire inductances on both sides of the BST. These tolerances were simulated and specified to de-embed this frequency shift effect. The gap between two substrates increased from 350 µm to ~550 µm, whereas the maximum height of the bondwires also increased from 150 to ~250 µm. This results in additional inductances on both sides of the BST structure with approximately 0.3 nH as shown in Fig. 10(b). This unavoidable inductance caused a 200 MHz frequency shift to lower frequency band compared to the targeted bandwidth. Hence, all measurement results of the BST-PA design were shifted to compensate this frequency shift, and allowed a detailed comparison between both designs. Figure 10(a) heeds the measured de-embedded small-signal gain (circle symbols). The measurement results of BST-PA will be presented based on the prescribed de-embedding technique. However, higher insertion loss of the implemented BST as well as additional inductances degraded the small-signal gain at higher frequencies as shown in Fig. 10(b).
(a) Small-signal measurement of the frequency shifted BST-PA design. (b) De-embedding of the bondwire influences with two inductors.
B) Large-signal measurements
A continuous wave (CW) input signal was used to perform the large-signal measurements. After determining the optimum drain bias of both PAs, the sensitivity of the PAs performance against the gate bias voltage V GS was evaluated by applying different gate-bias voltages. The output power and efficiency were measured for each gate voltage. It was observed that the performance could further be optimized by the additional tuning of the gate bias voltage. Therefore, the large-signal measurements were performed for both designs in class C mode with a gate bias voltage of V GS = −4 V and a drain bias voltage of V DD = 28 V. This bias point results in definitely higher PAE at OBO power levels compared to the class AB operation, due to the less power consumption in class C mode. However, at the maximum output power level, the efficiency is slightly lower than that of the class AB mode, due to the lower gain at maximum level compared to class AB. Experimentally, Fig. 11 shows the PAE performance of the CAP-PA design in class AB and class C mode at maximum and 6 dB OBO power levels as well as at optimum load impedances of the two output power levels based on Table 1 across the desired band. The results demonstrated a slight difference in PAE performance between the two modes of operation at maximum output power level; whereas, at 6 dB OBO level, the PAE performance in class C mode was better than that in class AB mode in spite of the lower gain. This could be attributed to the higher efficiency performance, due to the less power consumption at back-off level.
Measured PAE at maximum and 6 dB OBO range in class AB as well class C mode at optimum load of maximum and 6 dB OBO of CAP-PA.
1) MAXIMUM OUTPUT POWER LEVEL PERFORMANCE
Figure 12 heeds the performance of both designs at the maximum output power level. In the CAP-PA, the capacitors were adjusted to get maximum output power with high efficiency over the desired bandwidth. Figure 12(a) shows that the maximum measured output power of 44.5 dBm with drain efficiency of 65% and a gain of more than 11 dB across the bandwidth. Moreover, the BST-PA design measurement results are presented in Fig. 12(b). Basically, the maximum drain efficiency at maximum output power was sensitive to the control voltage of the BST (V C1 and V C2). It is noticed, that the performance could further be enhanced by increasing the control voltage to V C1 = V C2 = 450 V, where the BST-based TMN could involve more range of the required Z opt/Pre at maximum output power across the band. The figure heeds that the design had a maximum output power of 44 dBm with maximum drain efficiency of 70% and a gain of 9 dB. Figure 12(b) also shows degradation in performance at higher frequencies. This deviation could be caused due to the increase of losses in BST-based TMN structure and the additional bondwire inductances on both sides of the BST as mentioned previously.
Large-signal measurement results at maximum output power level versus the frequency. (a) CAP-PA at (C 1 = 0.6 pF and C 2 = 0.2 pF). (b) De-embedded BST-PA at (V C1 = V C2 = 450 V).
2) DRAIN EFFICIENCY EVALUATION
The comparison between the two designs in drain efficiency at maximum as well as at 6 dB OBO level with and without tuning the load was evaluated. Figure 13(a) shows the efficiency of the CAP-PA. The capacitance values of the OMN were adjusted according to Table 1 in order to ensure maximum available output power with maximum efficiency. The measured efficiency ranged from 61 to 69% (filled triangle symbols). However, at 6 dB OBO level and without tuning the load impedances, the efficiency degraded to 32–40% (filled square symbols). Tuning the load impedances of the OMN by adjusting the capacitance value according Table 1, the efficiency could be enhanced to 45–60% (filled circle symbols). In other words, 8–20% of efficiency enhancement in efficiency at 6 dB OBO range was achieved by adjusting the capacitance value of the OMN (filled diamond symbols) across the bandwidth. Whereas, Fig. 13(b) illustrates the drain efficiency performance of the BST-PA at maximum and 6 dB OBO power level as well as at two different controls biasing across the whole band. The measured efficiency at maximum output power level ranged from 59 to 70% (hollow triangle symbols) at V C1 = V C2 = 450 V. However, at the same TMN control setup, the 6 dB OBO level efficiency degraded to 49–51% (hollow square symbols). To improve the drain efficiency over the whole band, the control voltages V C1 and V C2 were re-adjusted to achieve the maximum available efficiency at 6 dB OBO level. Consequently, the bias voltages were tuned to V C1 = V C2 = 0 V to achieve the optimum load impedances at the 6 dB OBO range. As shown in Fig. 13(b), the enhancement in efficiency was between 2 and 9% over the whole bandwidth (hollow diamond symbols). The improvement in drain efficiency of the BST-PA was lower than the CAP-PA. Moreover, at 6 dB OBO range, the efficiency performance of the BST-PA was significantly better than the efficiency performance of CAP-PA at the maximum setup for both designs. This can be due to the BST thermal sensitivity which will be introduced later. The final comparison of efficiency performance between the two designs versus the frequency is presented in Fig. 14(a).
Efficiency performance of PAs across the bandwidth. (a) CAP-PA. (b) De-embedded BST-PA. At maximum output power (triangle symbols), at 6 dB OBO with tuning (circle symbols), at 6 dB OBO without tuning efficiency (square symbols) and the improvement value (diamond symbols).
Drain efficiency performance comparison of both designs CAP-PA and de-embedded BST-PA. (a) At maximum output power level. (b) At 6 dB OBO level with tuning the load impedances.
The OMNs in both designs were adjusted for maximum output power setup to ensure a maximum drain efficiency, where in CAP-PA, the capacitance values were chosen based on Table 1, and in BST-PA, the control voltages were adjusted to 450 V.
The maximum efficiency of the CAP-PA was constant and higher than 62%, whereas the efficiency of the BST-PA ranged between 48 and 69% across the bandwidth. The significant degradation of efficiency at 2.1 to 2.2 GHz was caused by the increase of the insertion loss of the BST structure and the additional bondwire inductances as mentioned previously. The OMNs of both designs were tuned to achieve maximum drain efficiency at 6 dB OBO level based on analyses in Sections II and III. Figure 14(b) heeds the efficiency at 6 dB OBO of both designs. It is deployed that there was a good agreement between the two PAs regarding the efficiency enhancement. The fixed CAP-PA had a back-off efficiency ranging between 45 and 60%, and the BST-PA efficiency ranged from 38 to 62.5% across the desired band.
At the center frequency 2.0 GHz, the drain efficiency performance of both designs versus the output power sweep is presented in Fig. 15. As introduced before, there was an enhancement in drain efficiency performance by accommodating the OMN based on the required output power level. In the BST-PA, an enhancement of 12.5% was achieved by re-adjusting the control voltages of the BST structure at 6 dB OBO power level, whereas in the CAP-PA design, the efficiency performance was enhanced by 19% through adjusting the capacitance values based on Table 1. Moreover, at 9 dB OBO, a clear efficiency enhancement was achieved in both designs. The BST-PA had an efficiency of 40% at maximum setup (V C1 = V C2 = 450 V) of the control voltage, where it was enhanced to 50% by changing the control voltage to minimum setup V C1 = V C2 = 0 V.
Drain efficiency performance at (2.0 GHz) of CAP-PA and de-embedded BST-PA versus the output power sweep at maximum setup and 6 dB OBO setup.
Figure 15 also illustrates that the BST-PA had also relatively better efficiency performance at OBO levels without re-tuning the control voltage compared to the CAP-PA which had a dramatically degradation. This effect is most likely related to the effect of self-heating described in [Reference Wiens, Bengtsson, Maune, Sazegar, Heinrich and Jakoby22]. Precisely, at power back-off the dissipated power is smaller, such that equilibrium of heating and cooling is found at a lower temperature. The decrease in RF-induced temperature has the same effect on the permittivity as the reduction external electrical field. However, this thermal tuning of the varactor is slow compared to the electrical tuning and therefore further investigations are directed toward reduction of RF against thermal coupling.
V. CONCLUSION
In this paper, two PA designs, a CAP-PA and a BST-PA, with different tuning techniques were implemented to evaluate the efficiency enhancement at back-off operation across 1.8–2.2 GHz. The tunable OMN for the CAP-PA design, two stages of the OMN were tuned by changing the shunt capacitance values according to the output power level. The BST-PA design contained a pre-matching network as well as tunable BST-based TMN that provides variable capacitance based on the applied biasing voltage at the BST control terminations according to the output power level in order to obtain the maximum efficiency at various output power levels. This latter technique is used for the first time as main part of the OMN to improve the efficiency of the PAs at back-off level. The maximum measured output power was higher than 44 dBm for both designs with 65% drain efficiency for the CAP-PA design and around 60% of the BST-PA across the bandwidth. The efficiency enhancement at 6 dB OBO in the CAP-PA design across the bandwidth was between 8 and 20%, whereas the enhancement in the BST-PA was between 2 and 9% across the same bandwidth. From the efficiency point of view, the CAP-PA design had nearly constant maximum efficiency performance and better efficiency enhancement compared to the BST-PA across the bandwidth, due to the tuning limitation problem as well as the higher insertion losses at higher frequencies of the BST and the additional bondwire inductance. Nonetheless, the BST-PA efficiency performance was clearly better than the CAP-PA without tuning the control voltage due to the self-heating impact. The regulation of the control voltage of the BST structure was manually performed to evaluate the BST-PA performance. Further work is ongoing to design a dynamic control system based on envelope tracking technique at input side. Nevertheless, the BST-PA design is a promising technique, which can be developed to be used in the future RBSs. Therefore, a big challenge prevails to improve the tunability range, and reduce the switching time, insertion loss, and control voltage of the BST in order to use the BST in dynamic load modulation PA. The selective inkjet printing of the BST is ongoing to minimize the losses and hence to further improve the performance of the PA.
ACKNOWLEDGEMENTS
The authors would like to gratefully acknowledge Cree Inc. for providing the large-signal model of the transistor, Modelithics Inc. for providing the whole library of their ATC capacitors, Karlsruhe Institute of Technology (KIT) for BST substrate preparation. Also, we thank GloMic GmbH for their continuous interest and support during the project. This project is financially supported by German Research Foundation (DFG) under project number JA 921/22-1 / BO 1520/4-1.
 MHD. Tareq Arnous was born in 1984 in Damascus, Syria. He received his B.Sc. degree in Telecommunication and Electrical Engineering from Damascus University, Damascus, Syria, in 2009; M.Sc. degree in high-frequency technique from the Berlin Institute of Technology, Berlin, Germany in 2012. Currently, he is working toward the Ph.D. degree with Microwave Engineering Laboratory at Berlin Institute of Technology. His main research interests include efficiency and bandwidth enhancement techniques GaN-based power amplifiers using dynamic load modulation. Mr. Arnous received a scholarship from Erasmus mundus during his bachelor study in 2008.
 Alex Wien, born in 1984, received the Dipl.-Phys. degree in Experimental Physics from the University of Mainz, Germany, in 2011. Since 2012, he is working toward his Ph.D. with the Microwave Engineering Group at Technische Universität Darmstadt in Germany. His research is currently focused on advanced RF devices employing tunable dielectrics on component and system level for high-power applications.
 Paul Saad received his B.Sc. degree in Electrical Engineering from Lebanese University, Beirut, Lebanon, in 2005; M.Sc. degree in RF and Microwave Engineering from the University of Gävle, Sweden, in 2007; and Ph.D. degree in microwave electronics from Chalmers University of Technology, Sweden, in 2012. Currently, he is a Postdoctoral researcher at Berlin Institute of Technology, Germany. His research concerns the design of high-efficiency multi-band and wide-band power amplifiers. Dr. Saad was the recipient of the 2010 First Place Award of the Student High Efficiency Power Amplifier Design Competition of the IEEE Microwave Theory and Techniques Society (IEEEMTT-S) International Microwave Symposium (IMS).
 Sebastian Preis was born in 1985 in Berlin, Germany. He received the B. Eng. degree in Communication Systems from the University of Applied Science, Berlin, Germany in 2009 and M.Sc. degree in Computer Engineering from the Berlin Institute of Technology, Germany in 2011. Currently, he is working toward his Ph.D. degree with the Berlin Institute of Technology. His main research interests are efficiency and bandwidth enhancement techniques as well as characterization of GaN-based PAs.
Zihui Zhang received his Dipl.-Ing. degree in Electrical Engineering from the Berlin Institute of Technology, Germany in 2009. Currently, he is working towards his Ph.D. degree with the Microwave Engineering Laboratory at Berlin Institute of Technology. His main research areas are high-efficiency power amplifier design for arbitrary load impedances as well as power combining based power amplifiers. He is the founder and CEO of Smart Devices GmbH.
 Rolf Jacoby was born in Kinheim, Germany, in 1958. He received the Dipl.-Ing. and Dr.-Ing. degrees in Electrical Engineering from the University of Siegen, Germany, in 1985 and 1990, respectively. In January 1991, he joined the Research Center of Deutsche Telekom in Darmstadt, Germany. Since April 1997 he has a full professorship in “Microwave Engineering” at TU Darmstadt, Germany. His research focuses on ferroelectric thick film and liquid crystal technologies, bulk glass ceramics, and metamaterial structures. It addresses electronically tunable passive devices for frequency-agile radio frontends and beam-steering antenna arrays as well as chipless RFID, sensors, and detectors, e.g. for biomedical sensing, beam diagnostics in accelerators, and wireless process monitoring. Rolf Jakoby is editor-in-chief of the Journal “FREQUENZ”, De Gruyter, ISSN 0016-1136, a member of the VDE ITG, IEEE MTT and AP. He was chairman of the EuMC2007 and GeMiC2011, and treasurer of the EuMW2013. He is involved in 15 patents and more than 225 publications. In 1992, he received an award from the CCI Siegen for his excellent Ph.D. and in 1997, the ITG-Prize for an excellent publication in the IEEE AP Transactions. Since 2005, his group received 17 awards and prizes for best papers and doctoral dissertations.
 Georg Boeck received the doctoral degree from Berlin University of Technology, Berlin, Germany, in 1984. In the same year, he joined Siemens Research Laboratories in Munich, Germany, where his research areas were on fiber optics and GaAs electronics. Since 1991, he has been the head of the Microwave Engineering Research Laboratory at Berlin University of Technology. Since 2008, he has been with the Ferdinand-Braun-Institut (FBH) in Berlin, Germany, where he is head of the business area microwave power modules. In 2009 he was a co-founder of GloMic GmbH. His main areas of research are power amplifiers, microwave devices, circuits and systems up to and beyond the 100 GHz range. Prof. Boeck has authored or co-authored more than 270 technical papers and one book. He served as IEEE Distinguished Microwave Lecturer during the years 2006–2008, as Associate Editor of the Journal “IEEE Microwave and Wireless Components Letters” in 2008 and 2009 and as Guest Editor of the “IEEE Journal of Solid State Circuits” in 2012. He is a member of several technical program committees, a member of the editorial board of the Journal “Frequenz” and a Steering Committee member of the IEEE Radio Frequency Integrated Circuit Symposium. He was the Chairman of the IEEE-conferences “GeMIC 2010” and “PRIME 2010”. He is a member of the Informationstechnische Gesellschaft (ITG) in the Verband Deutscher Elektrotechniker (VDE), Germany, the chairman of the German IEEE MTT/AP Joint Chapter since 2010 and a member of the IEEE SSCS-, MTT- and COM-Societies. In 2006, Prof. Boeck was appointed as a Guest Professor of the Southeast University Nanjing, Nanjing, China.