INTRODUCTION
Africa contributes about 4% of the annual global carbon dioxide (CO2) emissions, so far the largest contributor to the anthropogenically enhanced greenhouse effect (IPCC 2007). Africa's carbon stock stands at 30 to 255 Mg C ha−1 in the forests (Houghton & Hackler Reference HOUGHTON and HACKLER2006, Palm et al. Reference PALM, WOOMER, ALEGRE, AREVALO, CASTILLA, CORDEIRO, FEIGL, HAIRIAH, KOTTO-SAME, MENDES, MOUKAM, MURDIYARSO, NJOMGANG, PARTON, RICSE, RODRIGUES, SITOMPUL, VAN NOORDWIJK and Palm1999) and −0.25 to 4.53 Mg C ha−1 y−1 in the savanna (Archibald et al. Reference ARCHIBALD, KIRTON, VAN DER MERWE, SCHOLES, WILLIAMS and HANAN2009, Brümmer et al. Reference BRÜMMER, FALK, PAPEN, SZARZYNSKI, WASSMANN and BRUGGEMANN2008), the two key vegetation types on the continent. These estimates are however full of uncertainties since they are largely based on models that have been parameterized with extra-African observations due to lack of locally generated data (Ciais et al. Reference CIAIS, PIAO, CADULE, FRIEDLINGSTEIN and CHÉDIN2009, Weber et al. Reference WEBER, JUNG, REICHSTEIN, BEER, BRAAKHEKKE, LEHSTEN, GHENT, KADUK, VIOVY, CIAIS, GOBRON and RÖDENBECK2009, Williams et al. Reference WILLIAMS, HANAN, NEFF, SCHOLES, BERRY, DENNING and BAKER2007). Forests have a higher productivity and carbon (C) turnover per unit land area compared to savanna (DeFries et al. Reference DEFRIES, HOUGHTON, HANSEN, FIELD, SKOLE and TOWNSHEND2002, Houghton Reference HOUGHTON2003), but the savannas cover a much larger area, approximately 40% of the continent landmass, and thus determine significantly the C budget of the region (Bombelli et al. Reference BOMBELLI, HENRY, CASTALDI, ADU-BREDU, ARNETH, DE GRANDCOURT, GRIECO, KUTSCH, LEHSTEN, RASILE, REICHSTEIN, TANSEY, WEBER and VALENTINI2009, Williams et al. Reference WILLIAMS, HANAN, NEFF, SCHOLES, BERRY, DENNING and BAKER2007). Contribution of the savanna is also significant due to its fire regime, the seasonality of plant productivity, and the large forest losses through deforestation (DeFries et al. Reference DEFRIES, HOUGHTON, HANSEN, FIELD, SKOLE and TOWNSHEND2002, Grace et al. Reference GRACE, SAN JOSE, MEIR, MIRANDA and MONTES2006, Houghton Reference HOUGHTON2003, Roberts et al. Reference ROBERTS, WOOSTER and LAGOUDAKIS2008).
African savannas are characterized by distinct seasonality of rainfall and soil moisture availability (Williams & Albertson Reference WILLIAMS and ALBERTSON2004). Soil moisture is an important driver for ecosystem processes such as photosynthesis, C translocation and soil organic matter decomposition (Rodriguez-Iturbe et al. Reference RODRIGUEZ-ITURBE, D'ODORICO, PORPORATO and RIDOLFI1999a, Reference RODRIGUEZ-ITURBE, D'ODORICO, PORPORATO and RIDOLFI1999b), which are key to atmospheric C inputs and outputs. Increased soil moisture stimulates ecosystem C uptake through photosynthesis (Merbold et al. Reference MERBOLD, ARDÖ, ARNETH, SCHOLES, NOUVELLON, DE GRANDCOURT, ARCHIBALD, BONNEFOND, BOULAIN, BRUEMMER, BRUEGGEMANN, CAPPELAERE, CESCHIA, EL-KHIDIR, EL-TAHIR, FALK, LLOYD, KERGOAT, LE DANTEC, MOUGIN, MUCHINDA, MUKELABAI, RAMIER, ROUPSARD, TIMOUK, VEENENDAAL and KUTSCH2008, Patrick et al. Reference PATRICK, CABLE, POTTS, IGNACE, BARRON-GAFFORD, GRIFFITH, ALPERT, VAN GESTEL, ROBERTSON, HUXMAN, ZAK, LOIK and TISSUE2007) and may increase (Kutsch et al. Reference KUTSCH, HANAN, SCHOLES, MCHUGH, KUBHEKA, ECKHARDT and WILLIAMS2008) or decrease (Yang et al. Reference YANG, WANG, HUANG and WANG2002) its release through respiration. Seasonality in soil moisture availability that characterizes African savannas may therefore result in a complex system of feedback between nutrients, fire occurrence, decomposition and competing vegetation (Rodriguez-Iturbe et al. Reference RODRIGUEZ-ITURBE, D'ODORICO, PORPORATO and RIDOLFI1999b, Scholes & Walker Reference SCHOLES and WALKER1993, Williams & Albertson Reference WILLIAMS and ALBERTSON2004), with significant influence on key ecosystem processes such as phenology, net ecosystem exchange (NEE) and ecosystem respiration (Reco).
Grasslands are more sensitive to changes in soil moisture (Ojima et al. Reference OJIMA, PARTON, COUGHENOUR, SCURLOCK, Breymeyer, Hall, Mellilo and Agren1996, Parton et al. Reference PARTON, COUGHENOUR, SCURLOCK, OJIMA, Breymeyer, Hall, Mellilo and Agren1996, Weltzin et al. Reference WELTZIN, LOIK, SCHWINNING, WILLIAMS, FAY, HADDAD, HARTE, HUXMAN, KNAPP, LIN, POCKMAN, SHAW, SMALL, SMITH, SMITH, TISSUE and ZAK2003). Savanna grasses are, therefore, likely to respond more strongly to seasonal changes in precipitation than the tree component (Merbold et al. Reference MERBOLD, ARDÖ, ARNETH, SCHOLES, NOUVELLON, DE GRANDCOURT, ARCHIBALD, BONNEFOND, BOULAIN, BRUEMMER, BRUEGGEMANN, CAPPELAERE, CESCHIA, EL-KHIDIR, EL-TAHIR, FALK, LLOYD, KERGOAT, LE DANTEC, MOUGIN, MUCHINDA, MUKELABAI, RAMIER, ROUPSARD, TIMOUK, VEENENDAAL and KUTSCH2008, Scholes & Walker Reference SCHOLES and WALKER1993) and could be a major source of seasonal variability in CO2 fluxes that is better defined by rainfall than any other factor. The use of ecosystem chambers allows for independent assessment of CO2 fluxes in the herbaceous vegetation and how it is influenced by its immediate physical environment.
In this study, ecosystem CO2 measurement chambers were used to monitor CO2 fluxes in a Themeda triandra-dominated grassland of a Kenyan humid savanna. We hypothesized that ecosystem CO2 fluxes and productivity of the savanna grassland are dependent on soil moisture. We responded to the following questions: (1) How do changes in precipitation affect soil moisture, soil temperature and soil nutrients? (2) How do these changes impact ecosystem CO2 fluxes and productivity of the grassland?
MATERIALS AND METHODS
Study site
Measurements were conducted between February 2008 and July 2009 in Ruma National Park (00°35′27.72″S, 34°18′81.64″E) in Suba District, Nyanza Province, Kenya. The park is situated in Lambwe Valley 10 km east of Lake Victoria and 140 km from Kisumu City. The park's surroundings are settled with a mix of small-scale cultivation and grassy pastureland. Main grazing and browsing animal populations in the park consist of roan antelope (Hippotragus equinus), Jackson's hartebeest (Alcelaphus buselaphus), Oribi (Ourebia ourebi) and Rothschild's giraffe (Giraffa camelopardalis rothschildi). Included within the park's enclosure, but separated from the game park by a perimeter fence is a section owned by the Kenya National Youth Services (NYS), which acts as a youth training camp. Our study site was located within the NYS section of the park on the flat floor of the valley bordered by escarpments, at an altitude of approximately 1400 m asl. The soils are largely black cotton clays corresponding to Vertisols according to WRB soil classification. The climate is hot and humid with a mean annual air temperature of 25 °C. Mean annual rainfall is approximately 1200–1400 mm with a bimodal distribution pattern between April–June and September–November. The terrain is mainly tall-grassland, with tracts of open woodland and thickets dominated by Acacia trees and a thick layer of the grass Themeda triandra Forssk.
Experimental design
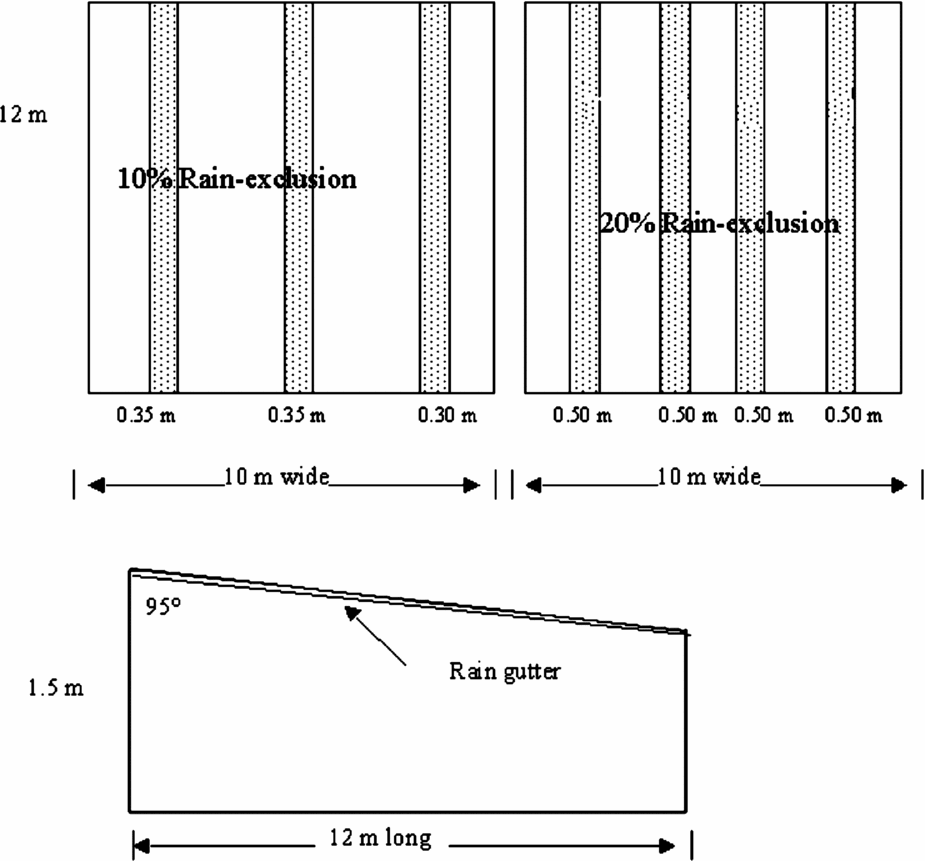
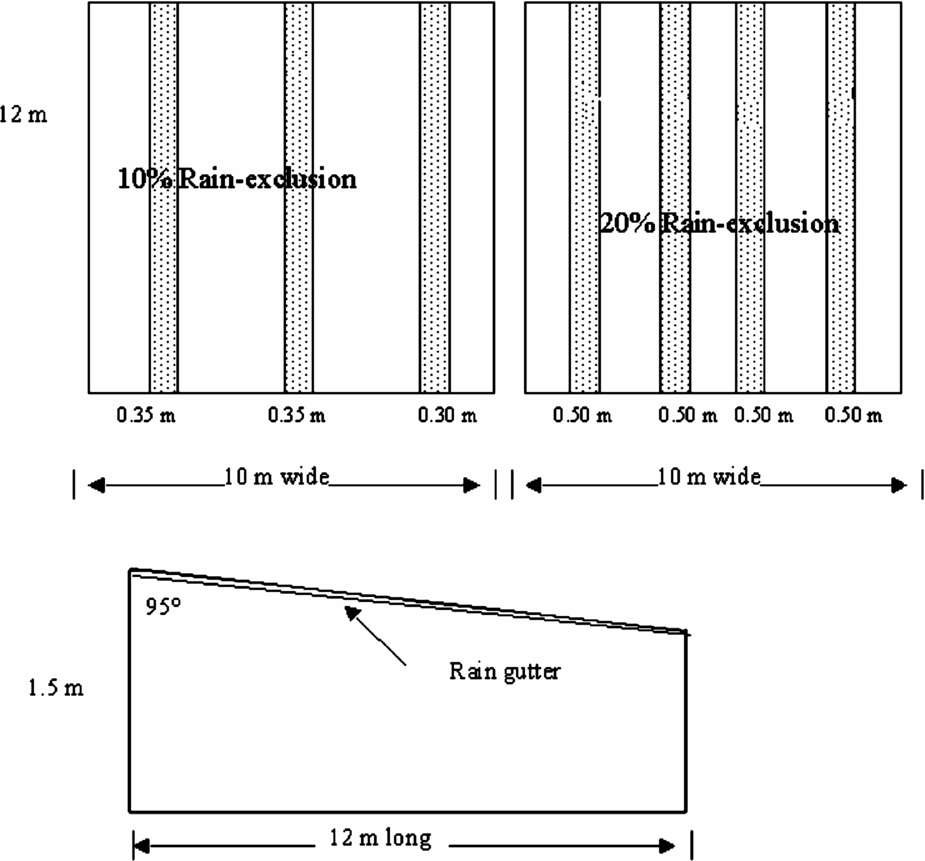
Measurements were conducted within a 70 × 50-m fenced enclosure established in 2006 in a T. triandra grass stand. Measurements were carried out in the open locations without tree influence. Treatments comprised three different soil moisture levels attained through reducing the amount of rainwater reaching the plots. Rain was excluded using rainout shelters constructed on the plots so as to achieve 0%, 10% and 20% reduction of the ambient rainfall respectively. Each treatment was replicated three times in a randomized block design. Rainout shelters were constructed from transparent plastic gutters raised at 1.5 m above the ground and inclined at 5° down slope to allow rapid runoff of the collected water (Figure 1). Each replicate plot measured 10 m wide and 12 m long (lengthwise downslope). Rainout shelters were constructed such that they covered the entire 12 m plot length. The breadth was however determined by the amount of rain to be excluded/allowed onto the plot. For example, on the 10% rain-exclusion plots, only 1 m breadth had to be covered by the plastic but this was distributed over the entire 10 m width so that three plastic gutters were used, two measuring 0.35 m and one measuring 0.30 m wide when stretched lengthwise over the plot. Similar construction was done on the 20% rainout plots but with wider area coverage to achieve 20% rain exclusion. There were no gutters on the ambient plots. Gutter orientation was in an E–W direction. This was also the common wind direction, hence they had minimal impact on wind and air current movements over the plots. The gutters were replaced every 6 mo.
A sketch of gutter construction on the 10% and 20% rain-exclusion plots.
Microclimate
Microclimatic data were collected continuously from a climate station set up on the study site. Precipitation (RG3 HOBO pedant rain gauge, HOBOware, Eichstetten, Germany), global radiation (HOBO pedant, HOBOware, Eichstetten, Germany), air humidity and temperature at 2 m high (FUNKY-Clima, ESYS, Berlin, Germany), and soil temperature at −10 and −30 cm (HOBO pedant, SynoTech, Linnich, Germany) were measured every minute, data averaged and logged every 30 min. Additional, discontinuous recording of microclimate within and outside the CO2 flux chambers during gas exchange measurements were conducted. Recorded data included photosynthetic photon flux density (PPFD, LI-190, LI-COR, USA) within the transparent chambers, just above the herbaceous vegetation, Tair at 20 cm height inside and outside the chambers (Digital thermometer, Conrad, Hirschau, Germany) and soil temperature (Tsoil) at 10 cm soil depth (Einstichthermometer, Conrad, Hirschau, Germany) inside the soil frames/chambers. Data were recorded every 15 s alongside CO2 fluxes. This allowed closer monitoring of the microclimate within plots and to relate the fluxes to actual conditions within the chambers during measurements.
Ecosystem CO2-flux measurements with chambers
Net ecosystem CO2 exchange (NEE) and ecosystem respiration (Reco) were measured monthly using chambers. A set of nine soil frames/collars measuring 39.5 × 39.5 cm were inserted 4 cm into the soil, at least 2 d before the measurements were conducted. Three soil frames were established in each of the treatment plots (one in each replicate plot). These provided a base onto which the chambers were placed to ensure airtight conditions between the chamber and the soil. During any single measurement day, NEE and Reco were sequentially measured in a systematic rotation over all plots using manually operated, closed gas-exchange chambers. The 40 × 40 × 54-cm chambers of our system were constructed from transparent plexiglass (3 mm XT type 20070; light transmission 95%). Dark chambers, for measuring ecosystem respiration were constructed from opaque PVC, and covered with an opaque insulation layer and reflective aluminium foil. Using extension bases, chamber height was adjusted to the canopy height. Chambers were sealed to the plastic frames/collars with a flexible rubber gasket and the chamber firmly secured using elastic straps fastened onto the ground from two sides. Tests indicated that leakage did not occur, however, this could not be examined regularly in the case of systematic field measurements and required that each set of data be scrutinized for abnormalities.
Increased air pressure in the chamber, within the headspace, was avoided by a 12-mm opening at the top of the chamber, which was closed after the chamber had been placed onto the frame and before any records were taken. Circulation of air within the chamber was provided by three fans yielding a wind speed of 1.5 m s−1. Changes in chamber CO2 concentration over time were assessed with a portable IRGA (LI-COR 820, USA). Measurements were carried out within 3–5 min of placing the chamber on the frames. Once steady state was attained, data were logged every 15 s for 2 min. CO2 fluxes were calculated from a linear regression describing the time-dependent change in CO2 concentration within the chamber. By mounting frozen ice packs inside and at the back of the chamber in the airflow, temperature during measurements was maintained within 2 ° C relative to ambient. Air (at 20 cm above the ground surface) and soil (at 10 cm depth) temperatures inside and outside of the chambers were monitored during measurement and data logged at the onset and end of every round of NEE measurement on each plot. Similarly, light intensity within the chamber, and above the vegetation (canopy) was monitored using a quantum sensor (LI-190, LI-COR, USA) and data logged every 15 s. Tests conducted in a controlled-climate chamber showed that vapor pressure deficit (VPD) changes within our CO2-measurement chambers were limited to 1 hPa during the period (~3 min) when the chambers were placed on the vegetation. We, therefore, assumed that such small VPD changes should not affect CO2 exchange via stomatal effects.
On each measurement day, hourly measurements were conducted from sunrise to sunset over the collars on individual plots (three replicates per treatments). Eight to 11 measurement cycles were accomplished on each single day. Gross Primary Production (GPP) was estimated via the general equation:

A functional relationship between PPFD and NEE, also known as the ‘light response curve’ described by a rectangular hyperbola (Gilmanov et al. Reference GILMANOV, SOUSSANA, AIRES, ALLARD, AMMAN, BALZAROLO, BARCZA, BERNHOFER, CAMPBELL, CERNUSCA, CESCATTI, CLIFTON-BROWN, DIRKS, DORE, EUGSTER, FUHRER, GIMENO, GRUENWALD, HAZSPRA, HENSEN, IBROM, JACOBS, JONES, LANIGAN, LAURILA, LOHILA, MANCA, MARCOLLA, NAGY, PILGAARD, PINTER, PIO, RASCHI, ROGIERS, SANZ, STEFANI, SUTTON, TUBA, VALENTINI, WILLIAMS and WOHLFART2007) (Eqn. 2) was employed to parameterize NEE response to light, using Sigma Plot 8.0.
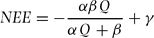
where Q is PPFD (μmol m−2 s−1), NEE (μmol CO2 m−2 s−1), α is an approximation of the canopy light utilization efficiency (μmol CO2/μmol photon), β is the maximum CO2 uptake rate of the canopy (μmol CO2 m−2 s−1) and γ is an estimate of the average ecosystem respiration (Reco, μmol CO2 m−2 s−1) occurring during the observation period.
Biomass estimation
Above-ground standing biomass was measured monthly for a period of 1 y between February 2008 and February 2009. After gas exchange measurements on each plot, all the standing above-ground biomass within the 39.5 × 39.5-cm area enclosed by the collars was harvested to ground level. The harvested biomass was sorted into green and dead material before being oven dried at 80 ° C for 48 h and weighed to obtain the live and dead dry weight. The harvested plots were clearly marked and numbered to avoid repeated harvesting.
Soil water content (SWC)
From the same plots of CO2 measurements, soil sampling was done with a 3-cm diameter core sampler at the middle of the frame down to 30 cm and the soil cores divided into three layers from 0–10, 10–20 and 20–30-cm depths. Each sample (layer) was immediately weighed to determine its fresh weight before oven drying at 105 °C for 48 h to obtain the dry weight. Gravimetric soil moisture content was determined as the relative change in weight between fresh and dry soil samples.
Soil pH, soil N and C and plant N and C determination
A second soil core was obtained from the middle of the collars for soil N, C and pH determination. The samples were divided into layers of 0–10, 10–20 and 20–30-cm depths. After root removal, the soil samples (fresh) from the respective plots and depths were divided into two equal parts. One set of samples was used for the determination of total soil N and C, while the other set was used for the determination of soil pH. Soil pH was determined by putting freshly ground 50-g homogenized soil into plastic bottles with 100 ml of distilled water and stirred for 1 h. A calibrated pH-meter was used for pH determination. The other portions were bagged and carefully labelled for further C and N analysis. A fraction from each layer was homogenized in a ball mill. Similarly, a fraction of above-ground biomass was ball-milled. The homogenized samples were re-dried in a desiccator to eliminate all the water. A portion of the dried samples, 4–5 and 15–100 mg of plant and soil respectively, were then analysed to determine their N and C concentrations (%) by means of elemental analysis (Markert Reference MARKERT1996).
Carbon assimilation and redistribution
13C pulse-labelling experiments were carried out to trace carbon (C) flux into the plant photosynthesizing tissues, into the roots and finally into the soil. Pulse labelling was carried out twice, during the rainy season and during the dry season on ambient plots. Labelling was conducted in a transparent chamber (above) with >95% transmittance of photosynthetically active radiation. Labelling was performed by releasing one pulse of 13CO2 by injecting 6 M H2SO4 to 0.5 g of Na213CO3 in a conical flask and the generated CO2 pumped (closed-air circulation) into the transparent chamber that was placed over the vegetation. The air inside the chamber was mixed by ventilators and CO2 concentration monitored with an infrared gas analyser (LI-COR 820). The labelling procedure is described in detail in Werth & Kuzyakov (Reference WERTH and KUZYAKOV2006). The chamber was then left over the vegetation until there was no further decrease in CO2 levels in the closed circulation system before being removed.
After label application, plant and soil samples were then obtained for 13C enrichment analysis. Samples were first collected before labelling and then 30 min after application. Thereafter, sampling frequency was increased from hours to days (up to 14 d when time allowed). Isotopic mass balance calculations and dynamics of 13CO2 fluxes during increase and depletion of the δ13C value with time allowed the estimation of carbon transfer/storage into the different plant parts and soil and how the processes are influenced by soil water availability.
δ13C determination
The samples were oven-dried at 80°C for 24 h before being transferred into a desiccator for 48 h. The dried samples were ball-milled before being subjected to 13C/12C isotopic ratio analysis at the isotope laboratory, University of Bayreuth, Germany. Analyses were conducted with elemental analyser (Heraeus CHN-O Rapid) for Dumas combustion of the samples, Finigan Mat trapping box HT for automatic cryo-purification of the combustion products, and a Finigan Mat Delta (δ) gas isotope mass spectrometer, with a dual inlet system (Gebauer & Schulze Reference GEBAUER and SCHULZE1991). Standard CO2 gas was calibrated with respect to international standard (CO2 in Pee Dee Belemnite) by use of the reference substance NBS 16 to 20 for carbon isotopic ratio provided by the international Atomic Energy Agency IAEA, Vienna, Austria. The 13C/12C isotopic ratios, denoted as delta values were calculated according to the equation

where δx is the isotope ratio, of carbon in delta units relative to the PDB standard. Rsample and Rstd are the 13C/12C of the samples and the PDB standard, respectively.
Statistical analysis
Group means from the three different treatments (measurement plots) were compared using ANOVA, with treatments as the fixed effects using statistical software SPSS (SPSS 15.0 for Windows, SPSS Inc., Chicago, USA). Significance level was set at P ≤ 0.05. We applied multivariate linear mixed-effects models (LMMs) using the package lme4 (Bates Reference BATES2005) of the statistic software R version 2.9.2 (R Development Core Team, Vienna, Austria) in order to correct for the repeated measures in the different plots. P-values were calculated using likelihood ratio tests based on changes in deviance when each term was dropped from the full model. We checked the normality of the model residuals visually by normal probability plots, and we assured the homogeneity of variances and goodness of fit of the models by plotting residuals versus fitted values. Pairwise tests of the means were conducted using Tukey-LSD. In all cases, our data passed the normality test hence there was no need for any further data transformation.
RESULTS
Microclimate and soil water content
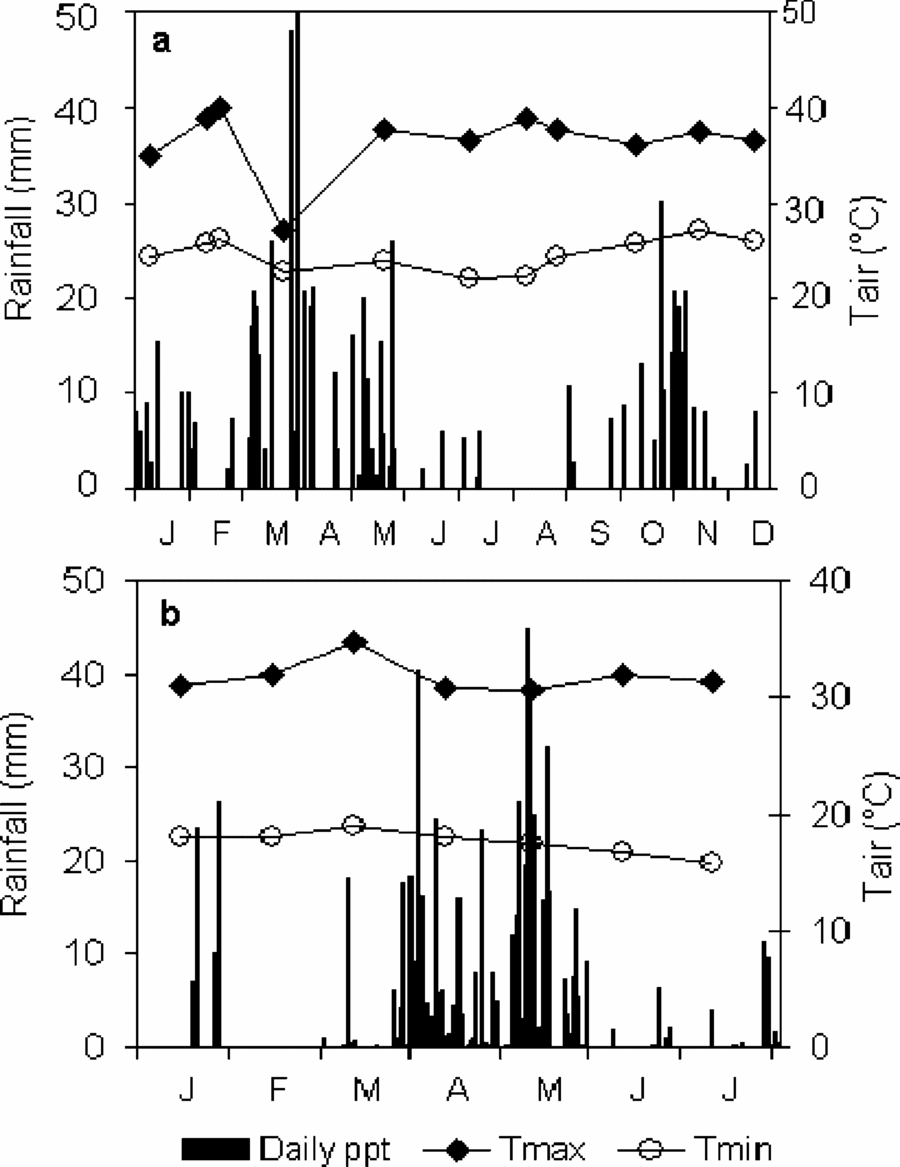
Mean daily air temperature during the study period was 25 °C, with minor variations (± 4 °C) during the year. Daily temperature fluctuations were large, with significant differences between the daily minimum (night) and maximum (day) temperatures (Figure 2). Photosynthetic active radiation (PAR) was above 1000 μmol m−2 s−1 during most part of the day and PAR rose steadily from morning, attaining maximum around 10h00.
Daily rainfall amounts and mean monthly maximum and minimum air temperatures at Ruma National Park during 2008 (a) and 2009 (b) when field measurements were conducted.
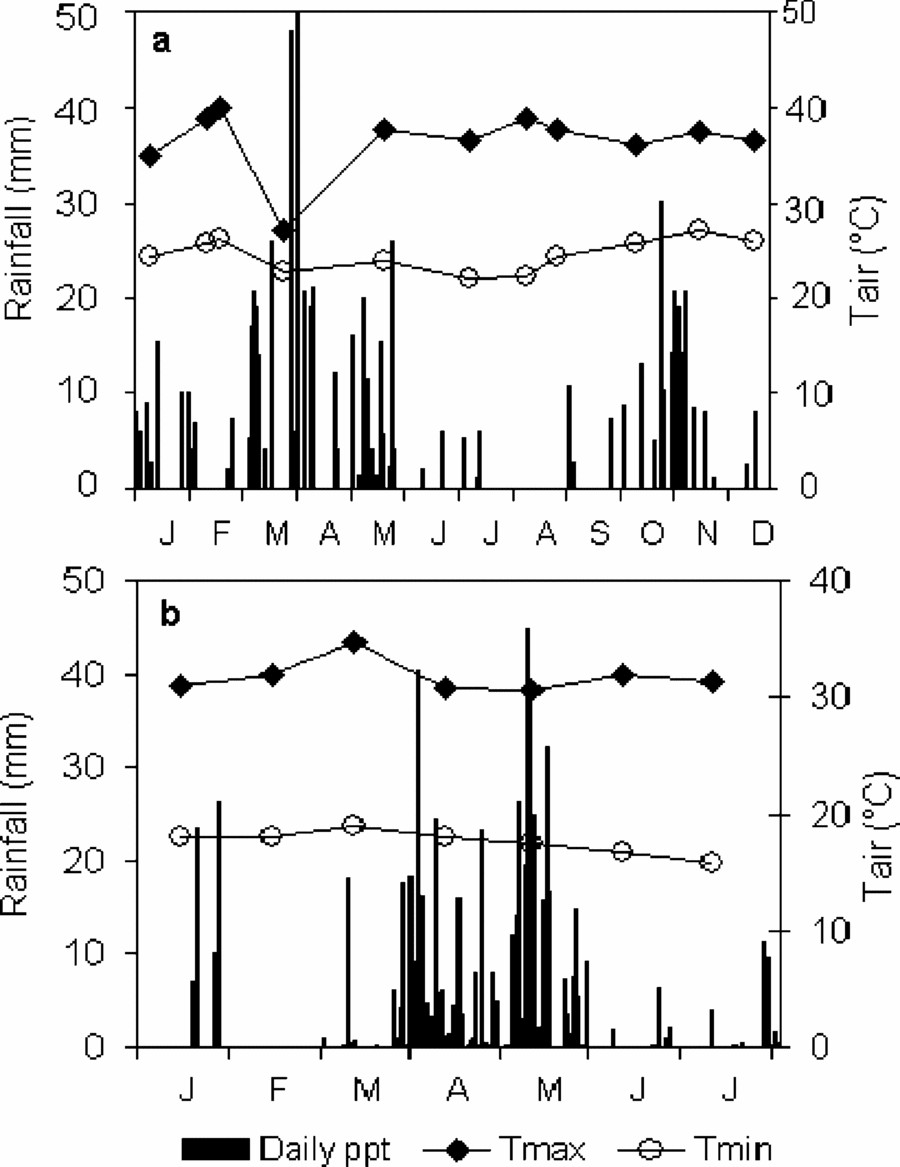
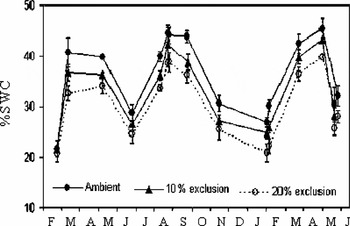
The total precipitation recorded during 2008 was 810 mm while the amount recorded during the first half of 2009 was 600 mm. The measurement period, therefore, was drier compared with the long-term records. There was distinct seasonality in rainfall pattern, with rains occurring between April and May and also between September and November, leaving January to March and June to August dry (Figure 2). Soil water content (SWC) increased during the rainy periods and declined during drought (Figure 3). SWC differed significantly among the different months (χ 2 = 124, df = 10, P < 0.001) and also among treatments (χ 2 = 21.8, df = 2, P < 0.001). There was no significant interaction between the two factors (P > 0.10). Post hoc comparisons revealed significant differences between the control and 20% (χ 2 = 21.1, P < 0.001) and also between the 20% and 10% (χ 2 = 10.7, P = 0.001) rain-exclusion treatments, but not between control and 10% (χ 2 = 3.0, P = 0.08) rain-exclusion treatment.
Soil water content (%) integrated over the top 30-cm soil layer in the ambient, 10% and 20% rain-exclusion treatment plots between February 2008 and June 2009 during the periods when CO2 fluxes were measured. Bars are ± SE.

Soil pH and bulk density were 6.4 ± 0.7 (SE) and 1.1 ± 0.4 (SE) g cm−3 respectively.
Soil nitrogen concentration and above-ground biomass
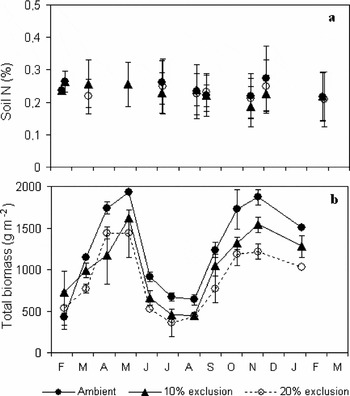
There were no significant changes in soil N concentration over the measurement period and no significant differences in soil N concentration occurred between the treatments (Figure 4a). Soil N and C concentration were positively correlated (r2 = 0.92, P < 0.001). Highest soil N (~0.28%) occurred within the top 10-cm soil layer, and soil N concentration declined with increasing depth down to 30 cm (data not shown).
Seasonal trends of soil nitrogen concentration within the top 30 cm soil layers (a) and total above-ground biomass (b) in the rain treatment plots between 2008 and 2009. Bars are ± SE.

Above-ground biomass increased during the rainy season (Figure 4b). Peak above-ground biomass occurred in June after the long rains and also in December, coinciding with the end of the short rains. Peak above-ground biomass in June 2008, the first rainy season after commencement of treatments, was not significantly different among the treatments. Peak biomass in the 20% treatment plots however, differed significantly from the ambient and 10% rain-exclusion plots after the second rainy period (December). Peak biomass during this period was 1820 ± 110 and 1120 ± 138 g m−2) in the ambient and 20% rain-exclusion plots respectively (Figure 4b), representing a reduction in peak biomass of about 17%. Biomass significantly declined during the dry periods and a large amount of biomass (~500 g m−2) was carried over into the next growing season.
Ecosystem CO2 fluxes
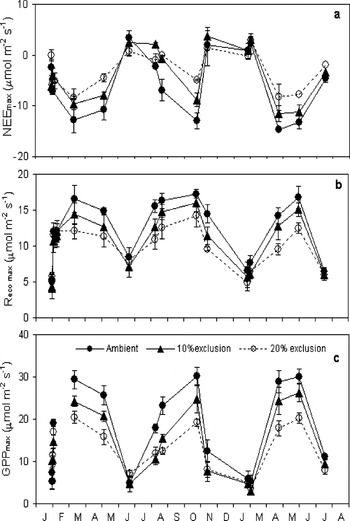
Changes in NEE, Reco and GPP during the season reflected seasonal patterns of rainfall and SWC (Figure 5). NEE increased (more negative values) between March and May and also between August and November (Figure 5a), coinciding with the periods with high SWC (Figure 3). Rapid decline in NEE after June and also after December coincided with the dry periods. Mean maximum NEE were −12.9 ± 1.4 μmol m−2 s−1 and −8.7 ± 0.3 μmol m−2 s−1 in the ambient and 20% rain-exclusion plots respectively. This amounted to a reduction of approximately 30% at peak flux rates arising from the low SWC in the 20% rain-exclusion plots. Intermediate values were recorded in the 10% rain-exclusion plots.
Seasonal trends of maximum net ecosystem CO2 exchange (NEEmax) (a), maximum ecosystem respiration (Reco max) (b) and maximum gross primary production (GPPmax) (c) in the Ambient, 10% and 20% rain-exclusion treatment plots between February 2008 and July 2009. Bars are ± SE. Negative NEE values represent net CO2 uptake while positive values represent net CO2 release into the atmosphere by the ecosystem.

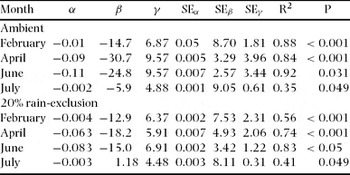
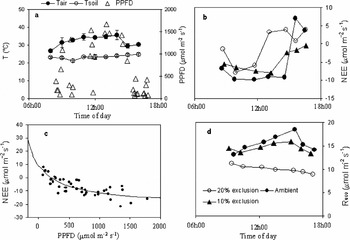
On clear sunny days (Figure 6a), when SWC was high, NEE increased (more negative) with increasing photosynthetic photon flux density (PPFD), reaching maximum at around midday and declined later in the day when light levels were low (Figure 6b). Peak NEE however, declined and also occurred earlier during the day, with decreasing SWC. Parameter fits derived from linear regression between NEE and PPFD (Figure 6c) showed that light utilization efficiency (α) and maximum CO2 assimilation rate of the canopy (β) declined with decreasing SWC (Table 1). Maximum α values of −0.11 ± 0.007 and −0.083 ± 0.002 μmol CO2 μmol−1 photon, in the ambient and 20% rain-exclusion plots respectively, were observed during the periods when SWC was highest. The relationship between NEE and PPFD was weak (r2 = 0.36) when SWC was low.
Best-fit parameters of the empirical hyperbolic light-response model (Eqn 2) derived from NEE flux results from the ambient and 20% rain-exclusion plots respectively during the season and their statistics.

Microclimatic conditions prevailing on a typical CO2 flux measurement day with clear sky conditions (a), Net ecosystem CO2 exchange (NEE) (b), relationship between NEE and photosynthetic photon flux density (PPFD) (c) and daytime ecosystem respiration (Reco) (d) under favourable soil moisture conditions.

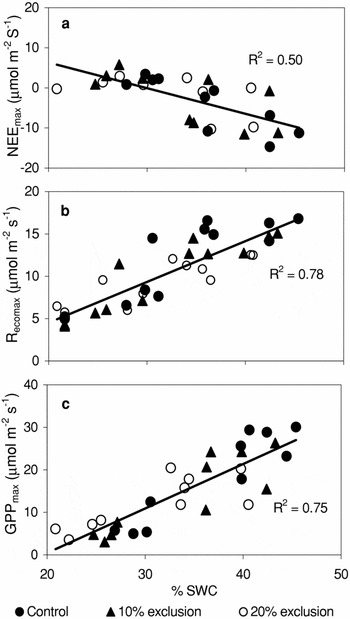
Highest Reco of 16.8 ± 1.1 and 12.5 ± 1.1 μmol m−2 s−1 in the ambient and 20% rain-exclusion plots respectively, occurred during the rainy period when SWC was high (Figure 5b). This represented a significant (P < 0.05) difference of 23% between the two treatments. The 10% rain-exclusion plots were however not significantly different from the ambient plots. A positive correlation was established between NEE, Reco and GPP and SWC within the top 0.30 m soil profile (Figure 7), while soil temperature at 0.10 m depth had no effect on NEE, Reco and GPP, even when data from drought and wet periods/plots were treated separately. On a daily basis, when SWC was high, Reco increased from morning hours and reached peak rates at around 14h30 and then declined to morning values later in the day (Figure 6d). The trend of Reco during the day resembled that of daily PPFD and NEE, but with a time lag of about 2 h.
Relationship between soil water content (SWC) and net ecosystem CO2 exchange (NEE) (a), ecosystem respiration (Reco) (b) and gross primary production (GPP) (c) in the ambient, 10% and 20% rain-exclusion treatment plots.

Seasonal trends of GPP were similar to those of NEE and Reco. Mean maximum GPP values of 29.6 ± 0.6 and 19.4 ± 1.2 μmol m−2 s−1 in ambient and 20% rain-exclusion plots respectively were recorded during the rainy season while minimum rates occurred during the dry periods (Figure 5c). GPP was significantly different between the ambient and 20% rain-exclusion plots during the rainy periods but differences were not significant during drought. GPP was also positively correlated with SWC (Figure 7c).
C allocation
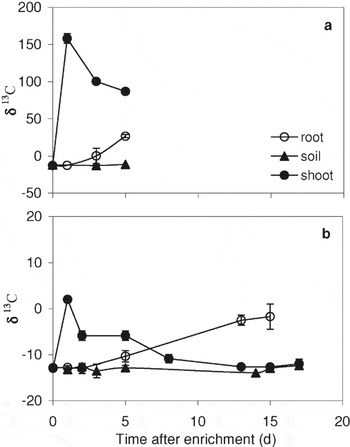
Compared to the dry periods, there was > 100-fold increase in δ13C in the above-ground biomass just a few hours after labelling during the wet period (Figure 8). Changes in δ13C in the roots were delayed but were more rapid during the rainy compared with dry periods. More than 80% of the fixed δ13C was apportioned to the roots during drought. Limited changes in soil δ13C occurred during the dry conditions. Samples for analysis in the wet conditions however, could only be obtained for a limited period of time due to heavy rains that made it difficult to access the study site.
δ13C of plant samples obtained at varying time intervals after pulse labelling during wet (a) and dry (b) seasons. Sampling during wet conditions was discontinued due to rainfall and inaccessibility to the experimental site. Y-axes in the two figures are scaled differently to accommodate the large differences in 13C signals and to improve clarity. Time zero represents unlabelled samples. Bars are ± SE.

DISCUSSION
Influence of precipitation and soil moisture on biomass development
Soil moisture was directly influenced by rainfall and SWC within the top 30-cm soil layer increased during the rain events. The 20% rain-exclusion plot was significantly drier than the other two treatment plots as a result of rain exclusion. Some amount of rainwater was lost as run-off during heavy downpours but this differed among plots, depending on the amount of rainfall received (personal observation). This likely influenced the effectiveness of our treatments and may explain the lack of difference in SWC between the ambient and 10% rain exclusion plots. There were strong seasonal fluctuations in SWC in response to the seasonality in the rain events.
High soil moisture during the rainy season stimulated growth of the grasses, leading to increased above-ground biomass. Plant growth and biomass development were strongly coupled to soil moisture availability, resulting in two biomass peaks during the year. Similar trends of biomass development have been observed elsewhere in the African savanna (Ardö et al. Reference ARDÖ, MÖLDER, EL-TAHIR and ELKHIDIR2008, Scholes & Walker Reference SCHOLES and WALKER1993). The impact of rain exclusion treatment on above-ground biomass however, was only significant in the second growing season after commencement of rain treatments. This delayed response of above-ground biomass to rain-exclusion treatments is not unusual and has been previously observed in grasslands elsewhere (Köchy & Wilson Reference KÖCHY and WILSON2004, Pelzer & Wilson Reference PELZER and WILSON2001) and is attributed to stored C from the previous growing season. Towards the end of the growing season, a proportionately large amount of fixed C is translocated to the root structures as demonstrated by the δ13C. This stored C is used by the grasses to re-sprout at the start of the next growing season (Tainton Reference TAINTON1999) by increasing the absorptive root surface area and, together with other plant adjustments (Köchy & Wilson Reference KÖCHY and WILSON2004), may dampen the effect of the current season's precipitation on biomass development. Thus, the influence of soil moisture treatments may only be evident after some time, and even then the relationship may be weak (Köchy & Wilson Reference KÖCHY and WILSON2004). The observed peak above-ground biomass in our study is within the range reported for T. triandra in other regions receiving similar rainfall amounts (Saleem et al. Reference SALEEM, MIRZA, KHAN and FRANKLIN2009).
Influence of soil moisture on ecosystem CO2 fluxes
In most grasslands, green biomass development is correlated with gross photosynthesis and NEE (Hodgkinson et al. Reference HODGKINSON, LUDLOW, MOTT and BARUCH1989, Otieno et al. Reference OTIENO, WARTINGER, NISHIWAKI, HUSSAIN, MUHR, BORKEN and LISHAID2009). In our study, both the above-ground biomass, NEE and light-use efficiency increased simultaneously with increasing SWC. Grasses use most of the carbon resources fixed early in the season for leaf area development and to improve their photosynthetic capacity (Rodriguez-Iturbe et al. Reference RODRIGUEZ-ITURBE, D'ODORICO, PORPORATO and RIDOLFI1999b, Tainton Reference TAINTON1999). This was demonstrated by the high proportion of δ13C allocated to the shoot early in the season during the growing period. In addition, there was an elevated light use efficiency (α) during this period. The combined increase in green biomass (photosynthetic surface area) and light utilization efficiency facilitate rapid CO2 uptake and an increase in NEE. Since soil and leaf N concentrations did not differ among plots, differences in NEE between treatments was likely due to differences in green biomass (photosynthetic surface area) and light utilization efficiency resulting from soil moisture differences.
Availability of soil moisture enhances CO2 exchange by the ecosystem through increased photosynthesis and respiration (Michelsen et al. Reference MICHELSEN, ANDERSON, JENSEN, KYOLLER and GASHEW2004, Reis & Shugart Reference REIS and SHUGART2008, Xu et al. Reference XU, BALDOCCHI and TANG2005). Soil moisture explained most of seasonal changes in NEE, Reco and GPP in our study. Peak NEE in the ambient plot during the growing season was −12.9 ± 1.4 μmol m−2 s−1. These rates are lower than the range of −15 to −40 μmol m−2 s−1 reported for a humid Brazilian cerrado, with higher rainfall amounts compared to our study site (Santos et al. Reference SANTOS, QUESADA, DA SILVA, JAIR, MIRANDA, MIRANDA and LLOYD2004), but are higher than −4 μmol m−2 s−1 reported for a semi-arid Californian oak/grass savanna (Ma et al. Reference MA, BALDOCCHI, XU and HEHN2007). Ardö et al. (Reference ARDÖ, MÖLDER, EL-TAHIR and ELKHIDIR2008) reported maximum NEE rates of −14 and −2 μmol m−2 s−1 during wet and dry seasons respectively for a semi-arid savanna in Sudan with mean annual rainfall of 320 mm. Their values however, include both Acacia trees and the understorey. On a daily basis, NEE increased from morning and attained maximum at around midday, when light intensity was maximum. NEE response to light was however, regulated by soil moisture availability such that during the dry periods, daily NEE was less responsive to changes in light intensity. NEE increased rapidly to a maximum early in the day, but declined after 10h00 as radiation increased to a maximum around midday. Such responses were likely aimed at minimizing water loss during the period when soil water was limiting. There was no evidence of direct NEE response to ambient temperature. Instead, mean daily temperatures were lowest during the rainy seasons, when NEE was highest, and highest during drought when lowest NEE rates were recorded, with no indication of temperature influence on NEE during the season. These observations strongly indicate that precipitation, which determines soil water availability, is the primary limiting factor for net ecosystem CO2 exchange in this savanna understorey. The lag between biomass (green) development, which has a direct influence on NEE, and changes in soil moisture, however, may dampen this relationship.
The observed peak Reco rates of 16.8 ± 1.1 μmol m−2 s−1 in the ambient plots are higher compared with those reported for semi-arid Californian oak/grass savanna (Ma et al. Reference MA, BALDOCCHI, XU and HEHN2007, Xu et al. Reference XU, BALDOCCHI and TANG2005) and South African savanna (Michelsen et al. Reference MICHELSEN, ANDERSON, JENSEN, KYOLLER and GASHEW2004, Williams et al. Reference WILLIAMS, HANAN, SCHOLES and KUTSCH2009) receiving less rainfall amounts in comparison. We attributed the high respiration rates observed in our study to the large C pool size as a result of the high amount of rainfall. According to Sandarman et al. (Reference SANDARMAN, AMUNDSON and BALDOCCHI2003), differences in C pool sizes alter the magnitude of peak rate of respiration. Since soil moisture is the direct link between precipitation and ecological systems, we anticipated that respiratory processes are directly linked to soil moisture status. This hypothesis was supported by the correlation between Reco and soil moisture observed at our site, in which soil moisture explained > 70% of the seasonal variations in ecosystem respiration and accounted for the differences in Reco observed between the treatments.
Temperature dependence of soil moisture influence on ecosystem respiration has been demonstrated in a number of studies (Gifford Reference GIFFORD2003, Lloyd & Taylor Reference LLOYD and TAYLOR1994, Raich & Schlassinger Reference RAICH and SCHLASSINGER1992, Williams et al. Reference WILLIAMS, HANAN, SCHOLES and KUTSCH2009, Xu et al. Reference XU, BALDOCCHI and TANG2005). The fact that daily Reco rates during favourable soil moisture conditions peaked at 14h30 suggested a strong link of Reco to biotic processes that are sensitive either to ambient temperature or light intensity. Instead, the behavioural response of Reco varied from day to day and was decoupled from temperature (air and soil) in the long term. Seasonally, increasing temperatures were associated with drying soils and reduced Reco. The observed changes in Reco during the day, when soil moisture was high, were more coupled to light intensity and photosynthesis than to ambient temperature, but with a time lag. Similar results have been reported for other tropical savanna grasslands (McCulley et al. Reference McCULLEY, BOUTTON and ARCHER2007) and in agricultural plants (Kuzyakov & Cheng Reference KUZYAKOV and CHENG2004). Tang et al. (Reference TANG, BALDOCCHI and XU2005) observed that respiration of the understorey was decoupled from soil temperature but was linked to the production and transportation of photosynthates from the leaves to the roots by the overstorey. As reviewed recently (Kuzyakov & Gavrichkova Reference KUZYAKOV and GAVRICHKOVA2010), translocation of assimilates from leaves to soil and the release back into the atmosphere as CO2 strongly depend on photosynthesis intensity, and is decoupled from soil or air temperature. It is likely that low soil moisture limited Reco directly through its inhibition of soil microbial activity (Hanson et al. Reference HANSON, EDWARDS, GARTEN and ANDREWS2000) and indirectly through reduced assimilation and transport of assimilates to the respiring surfaces and also into the soil (Kuzyakov & Cheng Reference KUZYAKOV and CHENG2004) as demonstrated by the reduction in carbon fixation (δ13C results) and transport of assimilates during drought.
Seasonal changes in GPP as well as variation among the plots were associated with changes in SWC. Higher GPP when SWC was high was linked to increased light use efficiency, increased green biomass (high photosynthetic leaf surface area) and higher photosynthetic rate. Enhanced plant photosynthetic capacity and above-ground activity (increased assimilate transport) due to high soil water availability resulted in stimulation of below-ground C-input and likely root and microbial activity contributing to greater Reco (McCulley et al. Reference McCULLEY, BOUTTON and ARCHER2007). The combined increase in both NEE and Reco, therefore, resulted in higher GPP. These observations strongly indicate the predominant role played by SWC in regulating seasonal ecosystem C exchange and productivity in this savanna. Generally, the ecosystem was a net CO2 sink during most of the year except for the short periods when SWC fell below 25%. These results portray the response of the understorey in the absence of grazing and fire, which are likely to alter the quantities of CO2 fluxes and C stocks (Hodgkinson et al. Reference HODGKINSON, LUDLOW, MOTT and BARUCH1989, Roberts et al. Reference ROBERTS, WOOSTER and LAGOUDAKIS2008). We, however, provide the first estimates of understorey ecosystem CO2 fluxes from this region of Africa, particularly from this wet savanna ecosystem that is located close to the equator. The study is a contribution to the existing and continuously growing CO2 database for the African continent.
Conclusions
Decline in SWC resulted in low biomass production, reduced light-use efficiency and reduced ecosystem CO2 exchange. Contrary to the common expectations of stimulation of ecosystem respiration by increasing temperatures, we found no relationship between temperature and ecosystem respiration. Instead, ecosystem CO2 fluxes were strongly regulated by soil water availability, which was under direct influence of precipitation. Savanna grasslands due to their considerably large photosynthetic surface area for CO2 uptake play a significant role in CO2 sequestration and regional C balance. They are however sensitive to changes in SWC as demonstrated in this study and shifts in precipitation regimes could have significant influence on CO2 exchange in these grasslands, turning them into net CO2 sources during the prolonged drought. This may impact ecosystem productivity and the regional climate. The strong dependence of CO2 exchange on soil moisture in the herbaceous layer of the savanna may also account for the strong seasonal fluctuations of C signals from the African continent that have been observed previously.
ACKNOWLEDGEMENTS
We acknowledge the Kenya National Youth Service (NYS), Lambwe station for hosting the research, Prof. Heiko Rödel for his support with statistics and Prof. J. Tenhunen for his support during our field activities and with ideas during the project design. This study was supported by grants from the British Ecological Society (BES).