I. INTRODUCTION
Over recent years, amorphous silicon (a-Si) has found widespread use in large area electronics. Two particular examples are thin-film transistorsReference Powell1 and second generation photovoltaic cells.Reference Carlson and Wronski2 Despite its use in such mature application areas, much research continues into its structure and properties as a result of a lack of detailed understanding of these areas.
Studies of a-Si indicate that many of its properties are dependent on the preparation technique and thermal history.Reference Roorda, Sinke, Poate, Jacobson, Dierker, Dennis, Eaglesham, Spaepen and Fuoss3 For example, when a-Si obtained by Si ion implantation into crystalline silicon (c-Si) is thermally annealed, the Si-Si network undergoes extensive restructuring or structural relaxation toward a state of lowest free energy. This relaxation leads to changes in its vibrational,Reference Tsu, Hernandez, Doehler and Ovshinsky4–Reference Sinke, Warabisako, Miyao, Tokuyama, Roorda and Saris6 structural,Reference Moss and Graczyk7 mechanical,Reference Haberl, Bradby, Swain, Williams and Munroe8 and electricalReference Roorda, Hakvoort, Vanveen, Stolk and Saris9 properties. Property variations are also observed to be influenced by its microstructure and impurity content. It is also known that hydrogen interacts with defects in the a-Si matrix, thus reducing the number of band gap states,Reference Lewis, Connell, Paul, Pawlik, Temkin, Brodsky, Kirkpatrick and Weaire10 which results in improvement in the electrical (transport) properties of a-Si. In addition, a-Si prepared by vacuum evaporation is known to produce a-Si layers that contain voids, and such layers may take up impurities such as hydrogen, oxygen, and carbon upon exposure to air.Reference Saitoh, Sugii, Ishiwara and Furukawa11 Especially, atomic hydrogen is known to be a successful passivator of dangling bonds, can thus also reduce the Si-Si network strainReference Smith and Wagner12 and hence also contributes to changes in the network as observed by Raman microspectroscopy.Reference Maley and Lannin13 However, a-Si prepared by ion implantation is widely reported to be pure and voidless.Reference Williamson, Roorda, Chicoine, Tabti, Stolk, Acco and Saris14 Thus, ion-implanted a-Si, where variation in microstructure and impurities can be eliminated, is an ideal amorphous material for studying the effect of thermal annealing on its structure. As ion-implanted a-Si is formed via highly nonequilibrium processes, it is to be expected that its structure contains a high concentration of defects, e.g., dangling bonds, floating bonds, and vacancy type defects. Despite the lack of voids, upon annealing, hydrogen diffuses into a-Si from the environment, and thus could potentially affect the apparent structural order in the atomic network of a-Si, its mechanical properties and its ability to phase transform.Reference Ruffell, Vedi, Bradby and Williams15 The measurement of the structural relaxation of a-Si has been reported to be a function of several physical parameters including the average bond-angle distortion (Δθ b). Indeed, Roorda et al.Reference Roorda, Sinke, Poate, Jacobson, Dierker, Dennis, Eaglesham, Spaepen and Fuoss3 showed that the structural relaxation of a-Si during thermal annealing is attributed to defect annihilation, which is associated with a reduction of bond-angle strain, i.e., a reduction in the value of Δθ b. Δθ b can be measured relatively easily using optical Raman microspectroscopy and hence is a powerful and convenient method to describe the state (relaxed or unrelaxed) and the degree of relaxation of the a-Si network.
The mechanical properties of a-Si, as probed by indentation, are also sensitive to whether the a-Si structure is relaxed or unrelaxed. For example, as-implanted (unrelaxed) a-Si has a lower hardness as compared with relaxed a-Si and deforms via plastic flow rather than phase transformation under low-load conditions.Reference Follstaedt, Knapp and Myers16 In contrast, a-Si which has been relaxed through thermal annealing at 450 °C readily deforms under indentation via phase transformation to a metallic, β-Sn phase (Si-II) during loading, with further transformations occurring on pressure release to either a-Si and/or to a mixture of metastable high pressure crystalline phases Si-III (bc8) and Si-XII (r8), depending on the unloading rate. Notably, Haberl et al.,Reference Haberl, Bradby, Ruffell, Williams and Munroe17 have reported that under a sufficiently slow unloading rate, relaxed a-Si (which has transformed to Si-II on loading) always undergoes phase transformation to the crystalline phases Si-III/Si-XII on unloading. In contrast, under the same indentation conditions, unrelaxed a-Si does not phase transform but deforms via plastic flow. Hence, the results of indentation testing are very sensitive to the state of a-Si.
In this article, we have measured the probability of an indentation-induced phase transformation in ion-implanted a-Si following isochronal annealing at temperatures up to 550 °C. This deformation behavior has been correlated with changes in the value of Δθ b of a-Si as a function of annealing to understand how phase transformation behavior can be correlated with structural relaxation.
II. EXPERIMENTAL PROCEDURE
Continuous a-Si films, of 2-μm thickness, were formed by Si ion implantation into a Czochralski-grown Si (100) wafer p-doped with boron to a resistivity of 10–20 Ω-cm. Implantation was performed at liquid nitrogen temperature with wafer surfaces tilted 7° to the beam direction to minimize ion channeling. A fluence of 1015 ions/cm2 was used for each of the multiple energies of 0.08, 0.5, 1.0, 1.5, and 2.0 MeV. Samples were probed for their composition and film thickness using Rutherford backscattering spectrometry under channeling conditions, and for microstructure by cross-sectional transmission electron microscopy. Results confirmed that pure, continuous amorphous Si films of 2-μm thickness were achieved. These samples will be referred to as the as-implanted samples.
Isochronal annealing at 30 min was performed using an AET THERMAL RX rapid thermal annealer under atmospheric pressure in a nitrogen environment at temperatures ranging from 150 to 550 °C.
An Ultra Micro Indentation System 2000 (CSIRO, Melbourne, Australia) with a 4.3-μm spherical diamond tip was used under loading conditions that always induce phase transformation to the Si-II phase for fully relaxed a-Si (annealed at 450 °C for 30 min). An occurrence of a pop-out event in unloading curves is a clear indicator that an a-Si to metallic phase transformation has occurred on loading and subsequent transformations have been induced during unloading from the metallic phase to high-pressure Si-III and Si-XII phases.Reference Bradby, Williams, Wong-Leung, Swain and Munroe18 Although indentation is an indirect probe for investigating thermal relaxation, the phase transformation, as determined by the pop-out behavior, is a stochastic event. Thus, analysis of multiple indents (49 indents) in different locations on each of the annealed samples is required to assess the probability for a pop-out and hence for a phase transformation. Loading was performed to a maximum load of 80 mN using a constant rate of 0.9 mN/s.
The effect of in-diffusion of hydrogen on the structural evolution and subsequent phase transformation behavior was investigated by chemically removing the hydrogen-rich region from the top surface of a-Si using a chemical etch (HNO3 + HF + H2O) solution prior to performing both indentation tests and Raman microspectroscopy.
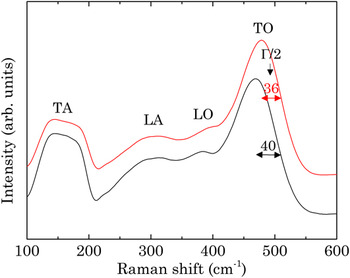
To analyze the changes in the Si-Si covalent network induced by annealing, the Raman spectra of the samples in their as-implanted state and after the various isochronal annealing treatments were measured. A typical Raman spectrum from a-Si contains four broad peaks in the low-frequency spectrum, the TA (transverse acoustic), the LA (longitudinal acoustic), the LO (longitudinal optic) and the TO (transverse optic) peaks. The peaks are indicated in Fig. 1. The effect of annealing (i.e., structural relaxation) on a-Si is shown in Fig. 1. It can be seen that the half-width (Γ/2) of the TO-like peak decreases as result of thermal treatments. Γ/2 on the high wave number side rather than the full width is used because the TO-like peak overlaps with LO and LA-like features on the low wave number side of the spectrum. A decrease in the Γ/2 is related to a decrease in the Δθ bReference Tsu, Hemindez and Pollak19–Reference Beeman, Tsu and Thorpe21 and Γ/2 can be converted to Δθ b using the empirical relationship derived by BeemanReference Beeman, Tsu and Thorpe21:
 $$\Gamma {\rm{/2 (}}cm^{ {\it{- 1}}} {\rm{) = 7}}{\rm{.5 + 3}}\Delta \theta _b (degree)\quad.$$
Two typical Raman spectra for a-Si. The top one has been annealed at 450 °C and the lower one is from an as-implanted (unannealed) sample. The upper one shows Γ/2 = 36 cm−1 and the lower one Γ/2 = 40 cm−1. (color online)

Raman microspectroscopy was performed on both the a-Si films following various annealing treatments to measure Δθ b and following indentation, to detect end phases within the volume of the residual indents. A Renishaw 2000 (Gloucestershire, UK) fitted with a 633-nm wave length laser was used for such measurements. The recording time of a single Raman spectrum was 30 s. Analyses of five spectra from each sample were performed to both measure Δθ b in a-Si and to monitor phase transformation within the indented regions, the latter to confirm a one-to-one correspondence between phase transformation and pop-out behavior in indentation load-displacement curves. Repeated tests on the same area showed that the a-Si was not altered by the measurement. Γ/2 was determined directly from the spectrum by a simple background subtraction to stay consistent with previous work.Reference Roorda, Sinke, Poate, Jacobson, Dierker, Dennis, Eaglesham, Spaepen and Fuoss3
III. RESULTS
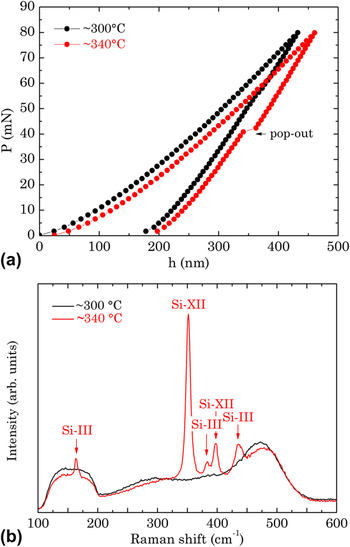
Typical examples of the load-displacement (P-h) curves from the indentation tests for particular samples annealed at 300 and 340 °C are shown in Fig. 2(a). The sample annealed at 340 °C shows a pop-out event on the unloading curve, whereas the sample annealed at 300 °C does not show a pop-out. Indeed, the shape of the load-unload curve in this latter case strongly suggests deformation via plastic flow.Reference Haberl, Bradby, Ruffell, Williams and Munroe17 The pop-out event is known to correspond to the formation of Si-III/XII phases during unloading. Indeed subsequent Raman microspectroscopy analysis of the residual indent impressions as shown in Fig. 2(b), shows Raman peaks at 163, 350, 382, 395, and 434 cm−1 which correspond to the crystalline phases Si-III and Si-XII.Reference Kailer, Gogotsi and Nickel22 In all cases where Raman microspectroscopy was used to identify the end phases following indentation, there was a perfect correlation between the observance of a pop-out event on the unloading curve and the presence of the Si-III/Si-XII phases in the residual indents. Furthermore, if a pop-out is not observed, the indentation did not cause phase transformation and deformation occurred via plastic flow.
(a) The P-h curves of a-Si samples annealed at 300 and 340 °C (shifted 25 nm along the h axis for clarity) and (b) Raman spectra of the residual indent impressions. (color online)

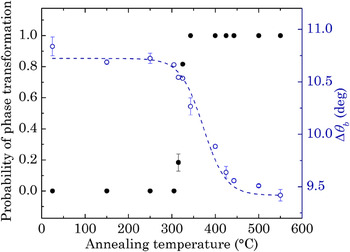
The probability of phase transformation (i.e., the presence of a pop-out event) can be monitored as a function of the annealing temperature. This is shown in Fig. 3 (solid circles).
The probability of phase transformation (solid circles) and Δθ b (open circles) as a function of annealing temperature. The dashed line is to guide the eye. (color online)

Two regimes are observed. (i) At temperatures up to 300 °C, the probability for a pop-out event and hence phase transformation is 0. Thus, up to 300 °C the a-Si “always” deforms via plastic flow under the indentation conditions used in this study. (ii) From 340 °C, indentation of the a-Si “always” induces a pop-out event. Hence the probability of phase transformation is 1 in this case. At annealing temperatures between 300 and 340 °C, the probability of phase transformation is between 0 and 1. For example, at 315 °C a probability (over the 49 indents examined) of phase transformation is 0.2 and this probability increases with annealing temperature to 1 at 340 °C.
The Δθ b values of a-Si samples annealed at various temperatures are also shown in Fig. 3. It is clear from Fig. 3 that Δθ b decreases from 10.8 to 9.4°over a temperature range centered at ∼370 °C. We note that preliminary results from experiments where the loading rate was altered by two orders of magnitude for a sample annealed at 325 °C (from 0.09 to 9.0 mN/s) indicated that the highest loading rate favored plastic flow and the slowest unloading rate favored phase transformation of the annealed a-Si. This behavior is to be expected, as at fast unloading rates for partially relaxed a-Si, plastic flow may not occur fast enough to prohibit the applied pressure exceeding the transformation pressure. However, it is clear that, for annealing temperatures where considerable bond-angle distortion remains in the sample according to Fig. 3, the a-Si is still able to phase transform over a range of loading rates.
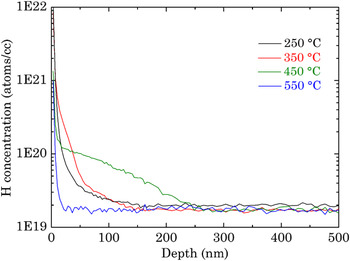
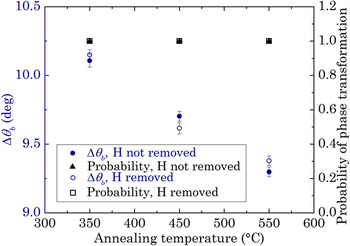
Figure 4 shows the secondary ion-mass spectroscopy (SIMS) spectra of hydrogen concentration in a-Si structures annealed to 550 °C.23 This shows that, upon annealing at 250 °C, hydrogen diffuses into a-Si from the environment and reaches concentrations of the order of 1020/cm3 at the top surface and decreases to 1019/cm3 at depths of 250 nm (the sensitivity limit of the SIMS). Upon annealing at 550 °C, hydrogen diffuses out from the a-Si, as shown in Fig. 4. The role of hydrogen on the structural relaxation of ion-implanted a-Si was investigated by removing the hydrogen-rich region, i.e., 250 nm from the top surface and remeasuring the Δθ b and deformation behavior under indentation. The results are shown in Fig. 5 and indicate that removal of the hydrogen-rich regions from the samples has no effect on either the phase transformation behavior or the measured Δθ b of ion-implanted and annealed a-Si. We have not measured the effect of hydrogen at temperatures below 350 °C as only a small amount of hydrogen indiffuses at such annealing temperatures (see Fig. 4) and, in any case, we do not observe any phase transformation or recovery of bond angle distortion in this temperature regime.
Hydrogen concentration measured by SIMS versus depth of a-Si annealed at 250, 350, 450, and 550 °C. (color online)

The probability of phase transformation (right axis) and Δθ b (left axis) before and after removing the hydrogen-rich region, as a function of annealing temperature. (color online)

IV. DISCUSSION
This study clearly shows that the mechanical deformation of a-Si is sensitive to the state (relaxed or unrelaxed) of the amorphous network, whereby unrelaxed a-Si deforms plastically and relaxed a-Si undergoes a pressure-induced phase transformation. Furthermore, both the probability of phase transformation and Δθ b are found to change significantly in a very narrow temperature range during thermal annealing. In particular, a reduction in the Δθ b with increasing annealing temperature is observed, accompanied by an increase in the probability of phase transformation under indentation, with both changes occurring predominantly over a temperature range from 300 to 450 °C.
The Δθ b decreases from an as-implanted value of 10.8 to 9.4° by 550 °C. The minimum Δθ b of 9.4° appears to signify the maximum network relaxation which can be experimentally obtained before epitaxial crystallization occurs at higher temperatures. Laaziri et al.,Reference Laaziri, Kycia, Roorda, Chicoine, Robertson, Wang and Moss24 previously measured Δθ b values of 10.4 and 9.6° for as-implanted and fully relaxed a-Si (annealed at 600 °C for 1 h), respectively, which are close to the values measured in the current study.
Although hydrogen indiffuses during annealing and will most certainly be responsible for passivating dangling bonds by the formation of hydrogenated amorphous silicon (a-Si:H), both indentation-induced deformation and Raman microspectroscopy show no significant contribution of hydrogen to the phase transformation and structural relaxation processes.
The mechanical deformation behavior during indentation tests suggests that the Δθ b does not need to be at its minimum value for the a-Si to have a high probability of phase transformation. Thus, phase transformation can occur in a-Si that is not fully relaxed according to minimum Δθ b. What does this mean? Previously, Roorda et al.Reference Roorda, Sinke, Poate, Jacobson, Dierker, Dennis, Eaglesham, Spaepen and Fuoss3 suggested that the structure of unrelaxed a-Si contains a large population of dangling bonds and other defects whereas relaxed a-Si is close to an ideal covalently bonded continuous random network (CRN). Plastic flow in unrelaxed a-Si under applied stress is considered to be associated with the presence of a high density of defects and broken bonds in the a-Si network.Reference Haberl, Bradby, Swain, Williams and Munroe8 When such defects are removed and dangling bonds repaired during a relaxation annealing, phase transformation is the preferred mode of deformation in this more ordered network.Reference Haberl, Bradby, Ruffell, Williams and Munroe17, Reference Ruffell, Bradby, Williams, Munoz-Paniagua, Tadayyon, Coatsworth and Norton25 The fact that the probability of phase transformation increases at temperatures before the Δθ b is fully minimized (see Fig. 3), leads us to speculate that, at intermediate states of relaxation, a substantial reduction in the dangling bond density occurs with the formation of a more rigid (4-fold-coordinated, covalently bonded) network. This bond repair would appear to precede minimization of Δθ b. Thus, we suggest that a near-fully coordinated structure that is only partially relaxed may increase its ability to inhibit plastic flow under an applied stress, allowing the local pressure to increase sufficiently under the indenter tip to cause the a-Si to transform to a metallic phase at a pressure around 11 GPa.Reference Barkema and Mousseau26 Therefore, relaxation appears to be a multistage process involving, among other processes, a reduction in defects and dangling bond density prior to a reduction in Δθ b. Indeed, previous studies have shown a wide range of activation energies associated with structural relaxation of a-Si, consistent with such a multistage process.Reference Roorda, Sinke, Poate, Jacobson, Dierker, Dennis, Eaglesham, Spaepen and Fuoss3, Reference Coffa, Priolo and Battaglia27, Reference Shin and Atwater28 Regardless of the exact order of processes contributing to the structural relaxation, our current work clearly indicates that determining the probability of a phase transformation upon indentation testing is sensitive to other processes of the structural relaxation rather than solely monitoring the bond-angle distortion. However, for confirming whether these processes are indeed solely correlated to the dangling bond density, more experiments are currently underway using a technique that is more directly sensitive to the dangling bond density, namely electrical conductivity measurement.
V. CONCLUSION
In this study, the indentation-induced deformation behavior is shown to be sensitive to the degree of relaxation of ion-implanted a-Si induced during thermal annealing. This deformation behavior has been correlated with Δθ b as measured by Raman microspectroscopy. The sudden changes observed in the probability of phase transformation that occur prior to minimization to Δθ b suggest that multiple processes occur during full relaxation. Our results strongly suggest that indentation is sensitive to the density of defects (presumably dangling bond density) in the a-Si network, whereas full relaxation of a-Si also requires minimization of Δθ b.
ACKNOWLEDGMENTS
The authors wish to acknowledge the ANFF for the ion implantation facilities and the Australian Research Council for financial support. JEB gratefully acknowledges the ARC for a QEII fellowship.