Introduction
Surgery, by lobectomy and lymph node dissection, is the gold standard treatment in the management of stage I non-small cell lung carcinoma (NSCLC). The median age of patients presenting a stage I NSCLC is about 70 years. Thus, age and cardiopulmonary comorbidities may often contraindicate any surgical management. In this case or if the patient refuses surgery, the alternative is stereotactic body radiation therapy (SBRT), which its effectiveness is comparable to surgery according to the pooled analysis of the STARS and ROSEL studies. Reference Chang, Senan and Paul1
Its superiority over 3D radiotherapy, in terms of efficacy and tolerance, is widely observed in many retrospective studies, and in CHISEL, a phase III trial. Reference Ball, Mai and Vinod2 The main complication of treatment is radiation-induced lung toxicity (RILT), divided into radiation pneumonitis (RP) and lung fibrosis (LF). RP is an acute toxicity of late onset, occurring within the first 6 months, whereas LF is a late toxicity, developing between 6 and 24 months, which usually remains stable after 2 years following radiation exposure. Reference Wall and Schnapp3,Reference Ghafoori, Marks, Vujaskovic and Kelsey4 The physiopathological mechanism results from the radiosensitivity of the functional subunit of the lung, the alveolo-capillary complex. Reference Ghafoori, Marks, Vujaskovic and Kelsey4 A loss of type I pneumocytes is observed, as well as an alteration of endothelial cells, which leads to a vascular permeability increase, responsible for interalveolar septas oedema, and microthrombosis. Pneumocytes II are destroyed and the surfactant thus released fills the alveolar spaces. These spaces are colonised by macrophages and fibroblasts, responsible for fibrous thickening of the alveolar walls by collagen secretion and a collapse of the air spaces, associated with an obliteration of the capillaries by fibrosis. Reference Wall and Schnapp3–Reference Shapiro, Finkelstein, Rubin, Penney and Siemann6 Changes in the contralateral lung can be observed, related to a lymphocyte-mediated immune response. Reference Hassaballa, Cohen, Khan, Ali, Bonomi and Rubin7–Reference Ikezoe, Takashima and Morimoto9 Radiologically, modifications are visible earlier on a chest computed tomography (CT) than on a standard chest X-ray (6 weeks versus 8 weeks). Reference Libshitz and Shuman10 Parenchymal consolidations and ground-glass opacities (GGOs) may occur, or more rarely pleural effusion or atelectasis. Reference Choi, Munden and Erasmus8,Reference Ikezoe, Takashima and Morimoto9,Reference Waissi, Noël and Giraud11 The form that is viewed as RP after three-dimensional radiotherapy (3D-RT), intensity-modulated radiation therapy (IMRT) and SBRT seems to differ. The discrepancy between 3D-RT and IMRT is probably the consequence of the concentration of the high isodoses around the tumour, while the low isodoses are more spread out with IMRT. Reference Linda, Trovo and Bradley12,Reference Larici, del Ciello and Maggi13 The difference between 3D-RT and SBRT seems to be more related to the dose per fraction. Reference Knoll, Salvatore and Sheu14 In addition, radiological changes appear later after SBRT (often after 3 months) than after 3D-RT (from the first week after the start of irradiation). Reference Linda, Trovo and Bradley12,Reference Bibault, Ceugnart, Prevost, Mirabel and Lartigau15,Reference Guckenberger, Heilman, Wulf, Mueller, Beckmann and Flentje16 In most cases, RP is asymptomatic and only results in radiological changes. Reference Ricardi, Filippi and Guarneri17–Reference Turzer, Brustugun, Waldeland and Helland20 CT scan aspects should be analysed attentively in order not to ignore a tumour progression. Radiological changes of the lung parenchyma are common after stereotactic irradiation and are often wrongly interpreted as tumour recurrences by our fellow radiologists. It is important for radiation oncologists to master these radiological appearances, so that new unnecessary treatments are not introduced, and to warn patients before treatment to limit the anxiety generated by reading the radiological report.
This retrospective series describes and analyses the CT scan changes observed after SBRT for stage I NSCLC in 90 patients all along the follow-up, that is, to say at 1 month and then every 3–4 months during at least 2 years.
Patients and Methods
Patients characteristics and radiation preparation
This study is a monocentric retrospective analysis of patients treated in a comprehensive cancer centre, approved by the Ethics Committee. The inclusion criteria were (1) stage I NSCLC, (2) SBRT delivered between 2010 and 2015 and (3) at least 2 years of follow-up. Exclusion criteria were (1) tumours > T2a and (2) lung metastases. Patient’s and radiation’s characteristics were detailed in a previously published article. Reference Menoux, Antoni, Truntzer, Keller, Massard and Noël21 The median prescribed dose was 60 Gy (30–62.5) delivered in a median of eight fractions (3–8). Seventy-seven patients (87%) received 60 Gy delivered in eight fractions of 7.5 Gy. The internal target volume (ITV) was defined on the maximum intensity projection sequence of the 4D CT scan completed by the volume visualised on the injected CT scan and biological target volume specified on positron emission tomography (PET)/CT scan. The margin between the ITV and the clinical target volume (CTV) was 2–8 mm, depending on the histological type. In almost all cases, the isotropic margin between the CTV and the planning target volume was 2 mm. SBRT was performed on a Novalis Tx® (BrainLAB, Feldkirchen, Germany and Varian Medical System, CA, USA). Set-up was controlled in all cases by cone beam computed tomography (Varian Medical System, CA, USA; Elekta Oncology System, Crawley, UK) and combined with Exac Trac (BrainLAB, Feldkirchen, Germany) in 16% of the cases. Dynamic arc therapy plans calculated by Monte Carlo algorithm (BrainLAB, Feldkirchen, Germany) were used in 91% of the cases.
Follow-up
After treatment completion, patients have been seen at 1 month and then every 3–4 months with CT or a PET/CT scan.
Tumour response
Tumour response evaluation was studied according to response evaluation criteria in solid tumours (RECIST): maximal diameter on axial CT slice on a lung window. Reference Eisenhauer, Therasse and Bogaerts22 SUVmax (maximal standardised uptake value) was collected to determine its relevance in the context of an inflammatory complication.
Radiological RP evaluation
Radiological RP was analysed on follow-up CT scan or, in default, on PET/CT scan, in a lung window (W = 1,600, L = −400). The statistical analysis was essentially descriptive and was realised by R software.
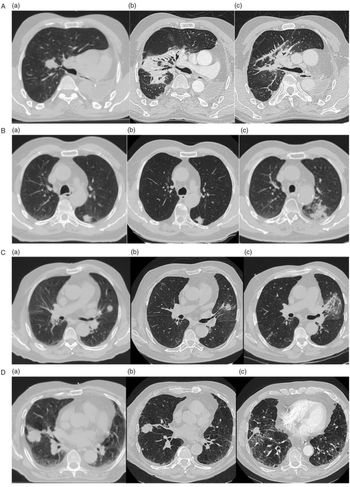
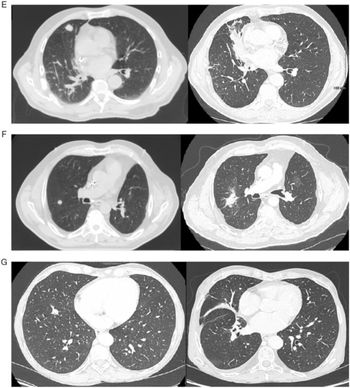
A double-blind reading of the CT scans was carried out to reduce inter-observer variability. Modified Kimura scoring system was used to describe RP: (1) Diffuse consolidation (>5 cm); (2) Patchy consolidation (≤5 cm); (3) Diffuse GGOs (>5 cm) and (4) Patchy GGO (≤5 cm). Reference Palma, van Sörnsen de Koste, Verbakel, Vincent and Senan23,Reference Dahele, Palma, Lagerwaard, Slotman and Senan24 Since RP is an acute toxicity that has a late occurrence, and to comply with the follow-up schedule (no CT or PET/CT scan planned at 6 months), RP was classified according to modified Kimura score until 8 months following SBRT. Koenig’s classification describes the radiological findings in case of LF: (1) modified conventional pattern (consolidation, volume loss and bronchiectasis); (2) mass-like pattern; (3) scar-like pattern. Reference Koenig, Munden and Erasmus25 An illustration of modified Kimura and Koenig score is given in Figure 1. Kimura score ranks RP in diffuse consolidation when it exceeds 5 cm (Figure 1, A), patchy consolidation until 5 cm (Figure 1, B), diffuse GGO (Figure 1, C) and patchy GGO (Figure 1, D). Figure 1 shows the baseline CT scan (Figure 1, A–D, a), the evaluation at 3–4 weeks (Figure 1, A–D, b) and the evaluation at 4–5 months (Figure 1, A–D, c). Type 1 fibrosis (Figure 1, E), mass-like fibrosis (Figure 1, F) and scar-like fibrosis (Figure 1, G) can also be seen several years after SBRT.
Continued.

(A) Illustration of a diffuse consolidation on thoracic CT: (a) before SBRT: upper right lobar lesion; (b) at 1 month: appearance of a diffuse consolidation and (c) at 4 months: persistence of a diffuse consolidation. (B) Illustration of a patchy consolidation on a thoracic CT: (a) before SBRT: left lower lobar lesion; (b) at 3 weeks: no radiation pneumonitis (RP) and (c) at 4 months: appearance of a localised condensation (≤5 cm) in place of the irradiated lesion. (C) Illustration of a diffuse ground-glass opacity: (a) before SBRT: left upper lobar lesion; (b) at 1 month: no peri-tumoral anomaly and (c) at 5 months: appearance of a diffuse GGO (>5 cm). (D) Illustration of a patchy GGO: (a) before SBRT: mean lobar lesion; (b) at 1 month: no peri-tumoral anomaly and (c) at 4 months: patchy GGO (≤5 cm). (E) Illustration of a type 1 fibrosis according to Koenig’s classification. On the left, dosimetric CT. On the right, chest CT 2 years after SBRT: modification of the conventional pattern (consolidation). (F) Illustration of mass-like fibrosis. On the left, dosimetric CT. On the right, chest CT 1 year after SBRT: mass-like fibrosis. (G) Illustration of a scar-like fibrosis. On the left, dosimetric CT. On the right, chest CT 3 years after SBRT: scar-like fibrosis.

RILT localisation
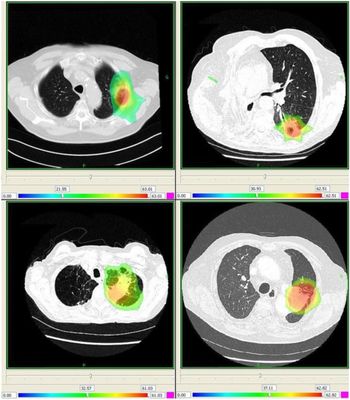
The CT scan on which the RILT was the most extensive was fused with the dosimetric CT scan via Artiview® software (Aquilab, Lille, France) to determine the isodose encompassing the parenchymal changes.
Results
According to the inclusion criteria, 90 patients were included. For all patients, 512 images (399 CT and 113 PET/CT scans) were read. Only 3% of the scans had to be interpreted on X-ray films because the digital images had not been stored.
RILT evolution
Seven patients have not been evaluated for RP because of an early death or an unsuitable follow-up period. Among the remaining 83 patients, 51 (61·5%) developed RP. Among the 70 patients who had available long-term data (at least 2 years after SBRT), 50 cases (71%) of radiologic LF have been diagnosed.
The mean time of RILT appearance after SBRT completion was 4 months (median time: 4 months), it reached its maximum extension at a mean time of 9 months (median time: 5 months) and the appearance of fibrosis occurred at a mean time of 11 months (median time: 9 months).
Progression from RP to LF has been observed in 37 patients of 51 (73%). RP complete resolution was observed in 7 patients of 51 (14%). However, 13 patients developed fibrosis without a previewed RP.
RILT radiological findings
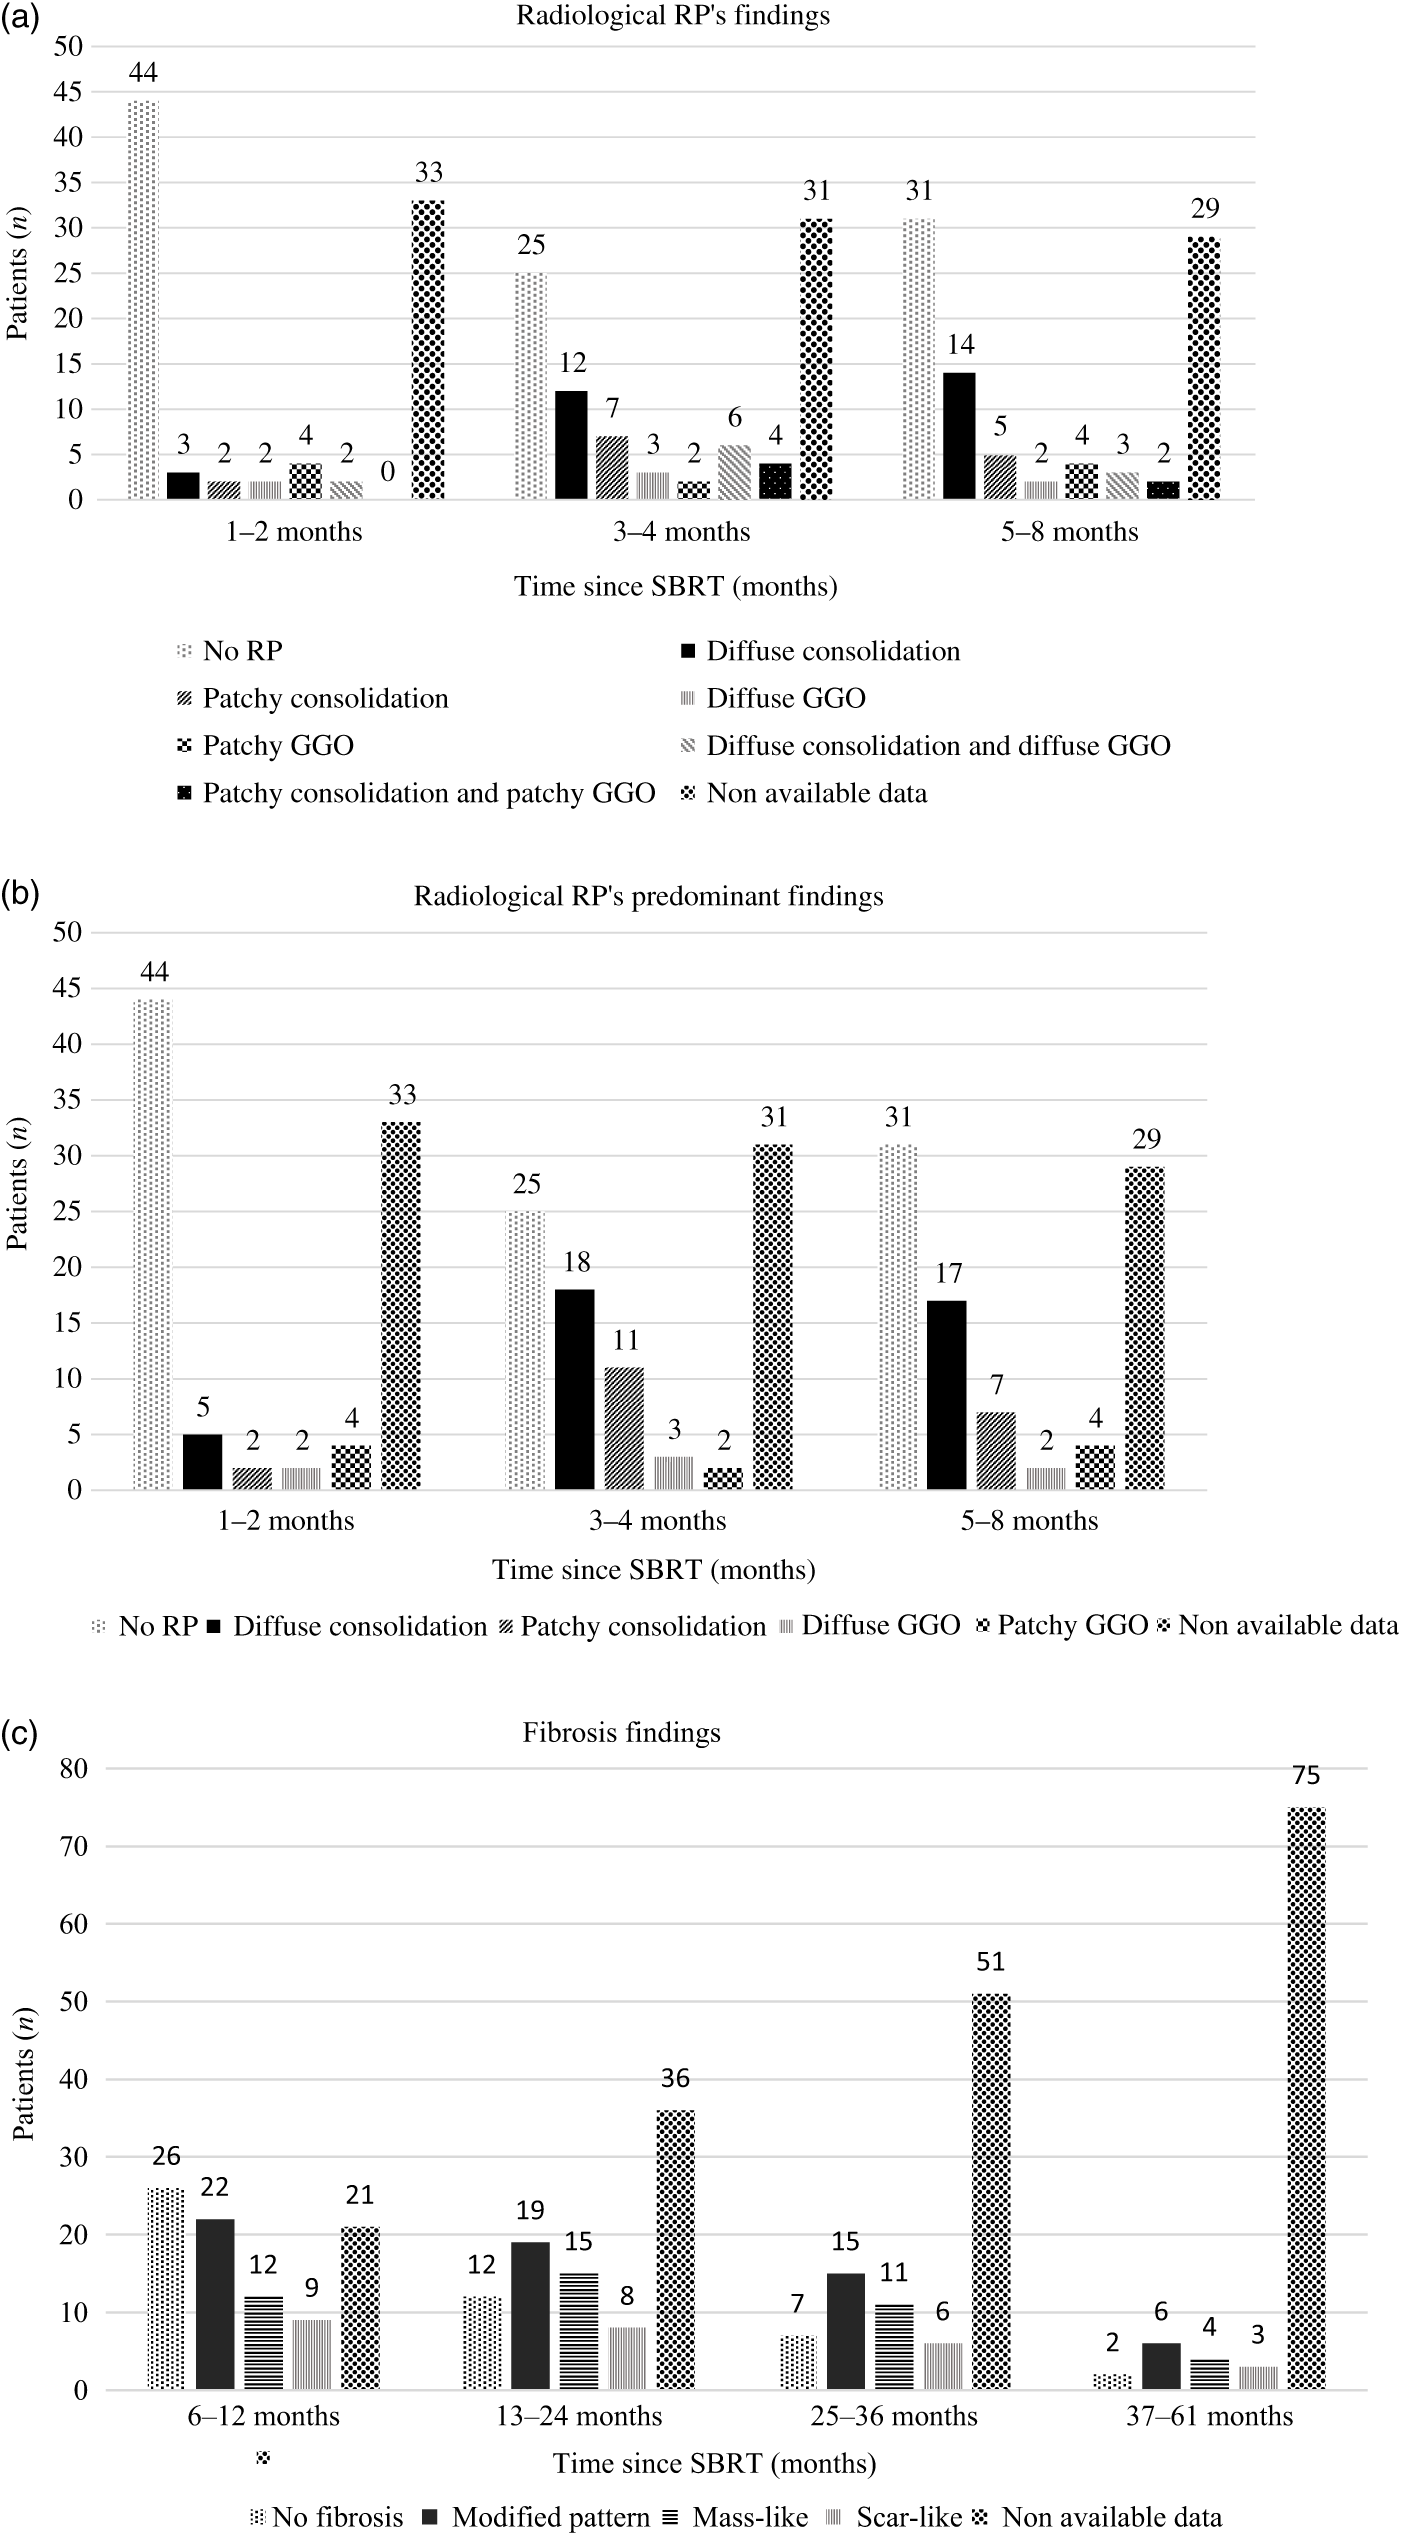
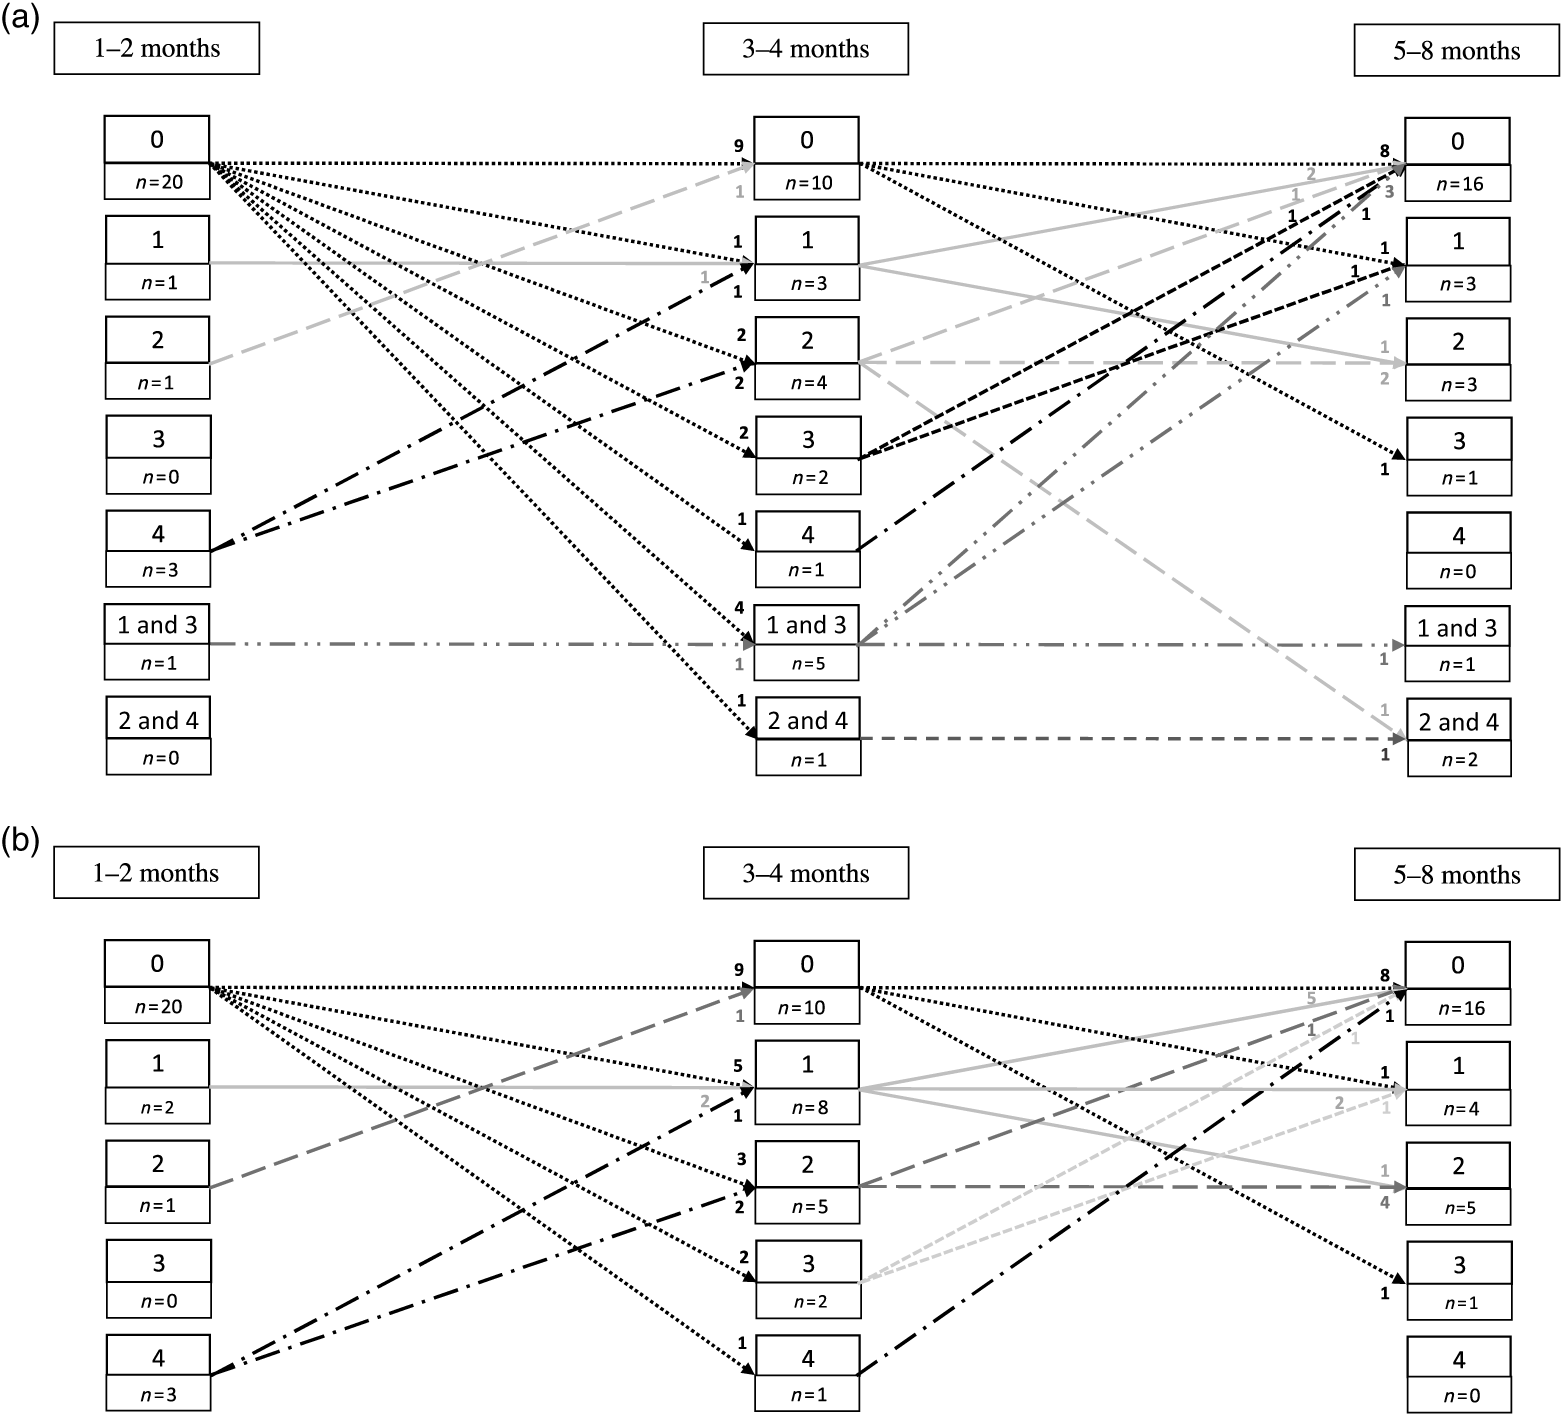
The most common aspect was the diffuse consolidation, regardless of the timing from irradiation completion: it represented 35% of the abnormalities seen at 3–4 months and 47% at 5–8 months (Figure 2a). Consolidation and GGO coexisted in 29% of cases at 3–4 months and 17% of cases at 5–8 months, which does not correspond to a scenario in the modified Kimura score. When only the predominant aspect was analysed, diffuse consolidation remained the most frequently observed abnormality (Figure 2b). The evolution from a pattern to another was studied in the subgroup of 26 patients who had 3 follow-up imaging at 1–2 months, 3–4 months and 5–8 months. As can be concluded in Figure 3, no leading evolution could be demonstrated. LF pattern is most of the time aspecific (type 1), followed with mass-like pattern (Figure 2c).
Distribution of the different aspects of radiation pneumonitis (RP) and lung fibrosis (LF) as function of time (a) RP: All findings considered, (b) RP: Only predominant findings considered and (c) LF.

Evolution of the different aspects of radiation pneumonitis (RP) as function of time (a) This figure shows the evolution of RP patterns in the 26 patients who had an evaluation at 1–2 months, 3–4 months and 5–6 months (all patterns considered). (b) This figure shows the evolution of RP patterns in the 26 patients who had an evaluation at 1–2 months, 3–4 months and 5–6 months (only predominant pattern considered).

RILT localisation
Eighty-eight per cent of RILT was encompassed by the 35 Gy isodose (Figure 4). The mean and median isodose encompassing RILT were 25 Gy and 23 Gy (0·16–48), respectively. A case of pneumonitis spread to the three right lung lobes was observed, being thus surrounded only by the isodose 0·16 Gy.
Examples of CT scans where radiation-induced lung toxicity is the most extensive fused with baseline CT to view isodoses.

Tumour response
The mean tumour size was 24·2 mm [CI 95% (22·2–26·3)] before SBRT and 23·7 mm [CI 95% (21·1–26·2)] at the time of the last patient follow-up CT scan, p = 0·499. The median follow-up time was 35 months.
The mean initial SUVmax was 9·9 (0·8–40). From the first PET/CT reassessment, at a mean time of 4 months following SBRT (median: 3, min–max: 0–12), and until the last PET/CT, the mean SUVmax remained lower to 5.
Discussion
RILT is a frequent complication and its radiological aspects are aspecific, which makes its diagnosis difficult. The time of onset of RP was more than 3 months after SBRT, with a mean time of 4 months, which is consistent with the literature data. Reference Linda, Trovo and Bradley12,Reference Bibault, Ceugnart, Prevost, Mirabel and Lartigau15
RILT radiological findings
In this study, diffuse consolidation was the predominant aspect in case of RP. However, the modified Kimura score is exclusive by describing one pattern at a time, though several patterns can coexist.
The cut-off characterising an acute toxicity within 6 months following SBRT cannot be applied in the case of RILT, since this is a gradual evolution, without any real change in the aspects being observed. Thus, it was arbitrarily decided to use the modified Kimura score until 8 months and to start the Koenig classification at 6 months. During this period of overlap, anomalies could also be classified according to these two scales. Thus, consolidation can be seen both in the modified Kimura classification and in Koenig’s classification. Reference Palma, van Sörnsen de Koste, Verbakel, Vincent and Senan23,Reference Koenig, Munden and Erasmus25
However, knowing that these changes are frequent is essential for this pathology’s follow-up so as to not misinterpret them as tumour progression.
The incidence of symptomatic RP (i.e., grade ≥ 2) was 26% in our population. The literature data are extremely variable, with an incidence ranging from 2 to 28% depending on the studies, which is a reflection of the difficulty in making this diagnosis, which is based on non-specific clinical and radiological signs.
In our population, 70% of patients were chronic obstructive pulmonary disease. In this fragile field, the causes of respiratory decompensation can be multiple, and the retrospective nature of the data does not allow to exclude another aetiology in a formal way. Reference Menoux, Antoni, Truntzer, Keller, Massard and Noël21
RP after stereotactic hypofractionated radiotherapy seems different from that, better known and observed after normofractionated 3D radiotherapy. Thus, the time of onset is later after stereotactic radiotherapy, usually after 3 months. In both cases, this seems to be confined to a certain isodose, but the dose distribution differs according to the technique used.
RILT localisation
The limitations of the study are associated with image registration and treatment plan comparison, due to the lung mobility, the tumour retraction after SBRT modifying the entire parenchyma surrounding the tumour and the arms position (usually raised during the dosimetric CT and along the body during follow-up CT). In one case, where RILT has spread to the three lung lobes, that shows that isodoses cannot solely explain this complication and raises the hypothesis of a gradual extension, probably of inflammatory and immune cause, Reference Hassaballa, Cohen, Khan, Ali, Bonomi and Rubin7–Reference Ikezoe, Takashima and Morimoto9 concomitant infection, even without infection symptom could be questioned.
Tumour response
The tumour size evolution was not significantly different between the baseline and the last follow-up CT. RECIST is not helpful in evaluating tumour response, especially when RP with diffuse consolidation or mass-like fibrosis is present. Reference Eisenhauer, Therasse and Bogaerts22 In addition, measuring the tumour within RILT can be tedious.
Differential diagnosis between relapse and RILT can be helped by several criteria: bulging margin, air bronchogram loss, linear margin disappearance, lesion craniocaudal size increase. Reference Waissi, Noël and Giraud11,Reference Huang, Senthi and Palma26 In case of doubt, 18F-FDG PET/CT may be useful, although a low hypermetabolism (SUVmax < 5) is frequently seen in cases of RP. Reference Henderson, Hoopes and Fletcher27 Three months post-SBRT SUVmax ≥ 2 and a reduction of <2·55 have a significantly higher rate of distant failure. Reference Clarke, Taremi and Dahele28 Moreover, pre-therapeutic SUVmax was a local control prognostic factor in a retrospective study: 2-year local control rate was 93% when initial SUVmax was ≤6 versus 42% when it exceeded this threshold. Reference Takeda, Yokosuka and Ohashi29 An initial SUVmax ≥ 4·75 was found to be predictive of distant failure in a series of 82 patients. Reference Clarke, Taremi and Dahele28 Although not recommended in routine follow-up after SBRT, 18F-FDG PET/CT is frequently performed alternately with CT. For example, a recent study found that less than two-thirds of patients had this monitoring in line with recommendations. Reference Erb, Su, Soulos, Tanoue and Gross30
Given that no SUVmax has exceeded the threshold of 5 in case of RP in this study, it is conceivable to propose a PET/CT scan in cases of doubt between tumour recurrence and RP on CT scan, which remains the reference for follow-up.
Conclusion
RILT is a frequent complication after SBRT, responsible for parenchymal changes. Most often, RP is only observed radiologically, but it may be accompanied by symptoms (such as fever, dyspnoea, dry cough or chestwall pain) that can lead to acute respiratory distress. It can progress to a chronic form, pulmonary fibrosis. The RILT’s radiological aspects can be profound and appearances must be recognised by clinicians so as not misinterpret them as tumour recurrence. This study describes its most frequent aspects, its time of onset and its evolution, in order to inform the radiation oncologist in their current practice.
Acknowledgements
None.