1. INTRODUCTION
It is a commonly accepted fact that soil is an engineering material of extremely complex and interrelated properties. A number of factors including, but not limited to, environmental effects, stress history, and drying/wetting cause variations in soil behavior. Therefore, it is usually a hard task to simulate the engineering behavior of a soil by the tests either in the laboratory or in the field because of its heterogeneous, anisotropic, stress dependent, and three-phased attributes. In this manner, complexity in determination of properties of soils encouraged engineers to establish empirical relationships between certain parameters for the prediction of targeted engineering properties.
In this context, solution of geotechnical problems necessitates a correct modeling of the real-life situation, and the selected parameters should not be irrelevant. Therefore, the design engineer is responsible for the selection of appropriate soil properties used in the modeling. Both laboratory and field tests enable the engineer to determine a number of parameters related to various soil properties, and the engineer is generally obliged to make inferences for obtaining additional necessary information. The cost of a comprehensive soil investigation is generally not within the limits of many projects. Therefore, the decision maker is responsible for striking a balance among the extent of the testing program and the parameters that should be determined as well as the frequency of tests in spatial scale. Forthcoming paragraphs include studies related with correlations between several properties of soils. The important point here is the correct evaluation of the generalization ability of the correlations. The data used in to establish the correlative expressions should be carefully examined, and the concordance between the data in hand and the data used in establishing correlations should carefully be examined. Correlations established using engineering data belonging to a specific region provide better outcomes for that region, in comparison with those obtained using global data. Nevertheless, correlations in the literature were established by use of the test data on insensitive clays and unaged granular soils, which is often unsecure to use in specimens extracted from naturally stratified soils (Terzaghi & Peck, Reference Terzaghi and Peck1967). Because sensitivity, high plasticity, overburden stress, void ratio, calcareous material inclusion, freezing/thawing effects, and so on, are effective on the behavior of these soils, local correlations tend to isolate these effects (Bowles, Reference Bowles1996; Das, Reference Das2001).
In the light of this knowledge, the aim of this study is to question the ability of the clustering methods for classification of the standard penetration test (SPT) standard penetration resistance value (SPT-N) in the field. The results obtained were compared with the classification by Terzaghi and Peck (Reference Terzaghi and Peck1967). The study also considered the question of the classification ability of unsupervised clustering algorithms using the liquidity index and shear strength parameters as inputs, to classify the SPT-N in the field. The results showed that, in cases where the SPT tests are unreliable or could not be performed, laboratory tests on undisturbed specimens can give valuable information regarding the consistency and SPT-N value of the soil specimen under investigation.
2. BACKGROUND
The SPT is the most common test used in determination and evaluation of the engineering properties of different types of tests in the field. SPT has a number of advantages, including its simplicity and the strength of the mechanical equipment, low cost due to its application in boreholes, and sampling. SPT was used to determine the mechanic and dynamic properties of especially coarse-grained soils, by use of a number of empirical correlations. Although its use in fine-grained soils is still questioned, a number of compressive and undrained shear parameters of fine-grained soils were correlated with this value (Sivrikaya & Toğrol, Reference Sivrikaya and Toğrol2002).
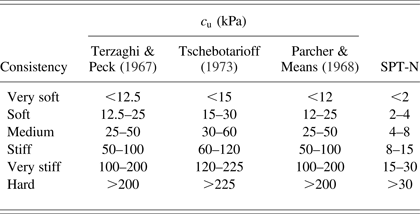
Several correlations were established to set up relationships among the shear strength parameters, consistency, and SPT-N values. Of all these, those tabulated in Table 1 were the most widely known, which was proposed by Terzaghi and Peck (Reference Terzaghi and Peck1967).
The dependency of undrained shear strength and SPT-N value on the consistency of fine-grained soils proposed by several researchers

Note: SPT-N, standard penetration test standard penetration resistance value; c u, undrained shear strength.
Thereafter, many researchers were concentrated on determining the unconfined compressive strength of soils using SPT values (Terzaghi & Peck, Reference Terzaghi and Peck1967; Sanglerat, Reference Sanglerat1972; Hara et al., Reference Hara, Ohta, Niwa, Tanaka and Banno1974; Stroud, Reference Stroud1974; Sowers, Reference Sowers1979; Nixon, Reference Nixon1982; Tomlinson, Reference Tomlinson1986; Ajayi & Balogum, Reference Ajayi and Balogum1988; Décourt, Reference Décourt1990; Kulhawy & Mayne, Reference Kulhawy and Mayne1990; Sivrikaya & Toğrol, Reference Sivrikaya and Toğrol2006; Hettiarachchi & Brown, Reference Hettiarachchi and Brown2009; Mahmoud, Reference Mahmoud2013). The correlations were given in the studies of Sivrikaya and Toğrol (Reference Sivrikaya and Toğrol2009) and Nassaji and Kalantari (Reference Nassaj and Kalantari2011). The idea behind the establishment of these correlations was rational. These expressions were specific to different soil classes and the coefficients were affected from soil plasticity. Established correlations were in the general form of Equation (1):
 $$q_{\rm u}=a.N\comma \;$$
where q u is the unconfined compressive strength of soil, N is the SPT-N value, and a is a coefficient. In the studies referred above, a coefficient ranged between 6.70 and 25. It should be mentioned that, among the relationships depicted above, solely the study of Kulhawy and Mayne (Reference Kulhawy and Mayne1990) included an exponential relationship. These expressions were classified in terms of plasticity and soil class, and some of the relationships were specifically established for certain soils. Of all these, Sivrikaya and Toğrol's (Reference Sivrikaya and Toğrol2006, Reference Sivrikaya and Toğrol2009) relatively recent and impressive studies were specific to Turkish practice. In detail, linear regression and statistical analyses were used to establish simple correlations between the undrained shear strength of soils (S u) and the SPT number. It was emphasized that the undrained shear strength database was constituted using three types of tests: unconsolidated-undrained triaxial tests, field vane tests, and unconfined compression tests. The relationships were also established for clays of high plasticity, clays of low plasticity, clays, and fine-grained soils. The extensive study on Turkish clays also made a distinction for the coefficient of field N values and N 60 values. Another study to establish empirical correlations for estimation of S u from different parameters was carried out by Nassaji and Kalantari (Reference Nassaj and Kalantari2011). The study utilized nonlinear regression analyses to establish relationships for estimation of N(SPT), using water content (w n), liquid limit (w L), and plasticity index (I P) parameters. It was emphasized that the standard deviation for the data in their study were lower, in comparison with those obtained in former studies.
Unsupervised clustering algorithms were used to classify several engineering properties of soils using a number of dependent parameters. In this scope, Göktepe et al. (Reference Göktepe, Altun and Sezer2005) used these algorithms to classify the Anatolian soils in terms of their strength and plasticity characteristics. Moreover, another study was conducted to classify the strength development in cement-stabilized clays using their water content and unconfined compressive strength (Göktepe et al., Reference Göktepe, Sezer, Sezer and Ramyar2008). Apart from the applications in civil engineering, particularly geotechnics, these algorithms found applications in soil sampling planning for rubber tree management along with spatial data (Lin et al., Reference Lin, Li, Luo, Lin and Li2013), assessment of pollution using a color index (Amini et al., Reference Amini, Afyuni, Fathianpour, Khademi and Flühler2004), signal processing for positioning systems (Cheng et al., Reference Cheng, Wang, Wu, Wu and Zhang2013), spatial regionalization of hazardous materials (Nourzadeh et al., Reference Nourzadeh, Hashemy, Martin, Bahrami and Moshashaei2013), and even evaluation of sunk cost industries (Arvas & Bozkır, Reference Arvas and Bozkir2013). The algorithms do not necessitate training; in other words, the algorithms perform classification without learning process, and this advantage is benefited in most of studies emphasized above. Along with the advantage of using geographical information systems, these algorithms have the potential in providing classification and characterization of different aspects of systems as well as processes.
Analyzing the short literature survey above, for fine-grained soils, it is clear that the studies were particularly concentrated on establishment of empirical relationships among several index properties and corrected/uncorrected SPT-N values. However, as can be seen in Table 1, a number of investigators concentrated on the classification of these parameters for a better understanding of the relationship between consistency and SPT value, as well as the shear strength of these soils. In this study, unsupervised clustering algorithms were employed to classify the SPT-N parameter in terms of the variables depicted above. This will enable the reader to check out if the former tables that are of use and accepted by the soil scientists worldwide may be useful or not, for a specific region (Table 1). A database constituted by use of test results in northern Izmir was used to answer this question.
3. SPT TESTS, ATTERBERG LIMITS, AND TRIAXIAL TEST DATA
A number of field tests including SPT, cone penetration test, Vane, dilatometer, and pressure meter are used to characterize the underlying soil strata during field investigations. The SPT test is the most frequently used one of these. A thick-walled sample tube is used in the test, which has outside diameter, inside diameter, and length of 50, 35, and 650 mm, respectively. After boring is stopped, at certain depths, this tube is driven into the soil by dynamic effects: a slide hammer with a weight of 63.5 kg falls from a height of 76 cm. After the penetration of a first 15 cm, the number of blows needed for additional two 15 cm penetration is recorded. The sum of blows for the last 30-cm penetration is termed the standard penetration resistance, or the N value. When the soil does not permit 15 cm advance although 50 blows are performed, the penetration after 50 blows is recorded. The blow counts are used in many correlations to determine other properties of soils. The procedure is designated in accordance with ASTM D1586-11 procedure (ASTM, 2011). Although many corrections are performed on test results, in this study, it was decided to use the raw data.
Another input parameter, liquidity index is determined using three tests: water content, liquid limit, and plastic limits tests. In water content test, the specimen is kept in an oven at 105°C for 24 h. The ratio of water weight over weight of dry soil is the water content of the specimen. Liquid limit is the water content of the fine-grained soil in transition from plastic to liquid state. In contrast, plastic limit is the water content that is the point of transition from the semisolid to plastic state. Liquid limit and plastic limit tests can be employed in accordance with the procedure in ASTM D4318-10 (ASTM, 2010). Measuring these parameters, the liquidity index (LI) can be calculated as
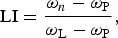 $${\rm LI}=\displaystyle{{{\rm \omega} _n - {\rm \omega} _{\rm P} } \over {{\rm \omega} _{\rm L} - {\rm \omega} _{\rm P} }}\comma \;$$
where ωn, ωL, and ωP are the water content, liquid limit, and plastic limit of the soil, respectively (Das, Reference Das2001).
The Mohr–Coulomb strength parameters of the soils are determined by consolidated-undrained triaxial tests, which were carried out in accordance with ASTM D2850 (ASTM, 2007). In unconsolidated-undrained triaxial tests, after application of the confining pressure, deviatoric stresses are suddenly raised to fail the specimen. Drainage is not allowed during the tests. Axial deformation and deviatoric stresses are measured during the shearing phase. As a result, these values are used to determine the Mohr–Coulomb shear strength parameters of the soils, namely, cohesion intercept (c) and internal friction angle (f). It should be emphasized that the relatively low internal friction angles observed in our database (3°–5°) are due to tests conducted on partially saturated fine-grained soils.
The shear strength values are calculated by the Mohr–Coulomb criterion:
 $${\rm\tau}=c+{\rm\sigma} \tan {\rm\phi}.$$
Therefore, a database was constituted concerning several parameters related to strength, consistency, and field test results. For clustering, four of these were selected: the percentage of material passing through a number 200 sieve (no. 200), the LI as indicated in Equation (2), the shear strength of soil from laboratory triaxial test results at a certain depth (τ), and the SPT blow counts in the field (SPT-N). In the construction of the database, SPT blow counts were noted for the nearest elevation from which the undisturbed specimen was extracted. In addition, if two SPT tests were close to an undisturbed specimen, attention was paid to recording the SPT test results performed on the same classes of soils with the ones on which the shear strength tests were employed.
4. UNSUPERVISED CLASSIFICATION TECHNIQUES
Clustering algorithms are generally known as mathematical processes that are employed to find out structures and behaviors as well as different groups in a data set. A cluster can therefore be defined as a group of elements of data that are organized similarly. Similarity here is defined by the Euclidean distances of the elements to cluster centers. The methods are advantageous in classification of multidimensional data so that the “distance” term is well defined.
4.1. Hard k-means (HKM) classifier
An HKM classifier segments the data in hand to a predefined number of clusters, and this is accomplished by an iterative procedure. In the calculation procedure, the center points are dynamic. Decision of a data point's cluster is made by the comparison of the Euclidean distances from the point to the center of each cluster, of which their number is fixed a priori. The algorithm moves the cluster centers after every iteration. In HKM, a data point can only belong to a certain cluster (Şen, Reference Şen2004). The first step algorithmically is taking each point in the data set in hand and later associating it to the nearest centroid. Minimization of the squared error objective function (J) in Equation (4) leads to clustering of n data points to c clusters (Ross, Reference Ross1995):
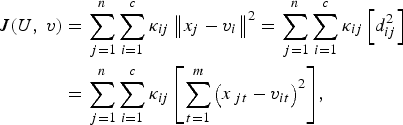 $$\eqalign{J\lpar U\comma \; v\rpar & =\sum\limits_{\,j=1}^n {\sum\limits_{i=1}^c {{\rm\kappa} _{ij} \left\Vert {x_j - v_i } \right\Vert ^2 } }=\sum\limits_{\,j=1}^n {\sum\limits_{i=1}^c {{\rm\kappa} _{ij} \left[{d_{ij}^2 } \right]} }\cr & =\sum\limits_{\,j=1}^n {\sum\limits_{i=1}^c {{\rm\kappa} _{ij} \left[{\sum\limits_{t=1}^m {\left({x_{\,jt} - v_{it} } \right)^2 } } \right]} }\comma \; }$$
where J is the minimization function, U is the partition matrix, v is the matrix of center clusters, m is the number of features in input matrix, d is the similarity measure taking the Euclidean distance calculation as a guide, and κ is a function in the calculation of the partition matrix defined as
 $$U={\rm\kappa}_1 {\rm\comma \; }{\rm\kappa}_2 {\rm\comma \; }{\rm . }\,{\rm . }\,{\rm .\,\comma \; }{\rm\kappa}_i$$
for any x j, so that if κi is equal to 1, x j is the element of ith cluster and the contrary is true if κi = 0.
Regarding this knowledge, cluster centers are computed as in Equation (6):
 $$v_{it}=\displaystyle{{\sum\nolimits_{k=1}^n {{\rm\kappa} _{ik} \, x_{kt} } } \over {\sum\nolimits_{k=1}^n {x_{ik} } }} \quad\lpar {\rm for}\, t=1\colon m \, {\rm and}\, i=1\colon c\rpar.$$
As a consequence, the difference between obtained dissimilarity matrices is calculated and compared with the error criterion (ε). The iteration is accomplished when the difference is below ε. The elements of the similarity matrix (d) can be updated using the following formulation (Şen, Reference Şen2004):
 $$\; \left. \matrix{{\rm if}\; d_{ik} \lpar s\rpar \, ={\rm min}\left[{d_{ik} \lpar s\rpar } \right]^{} {\rm\kappa} _{ij} \lpar s+1\rpar =1 \cr {\rm otherwise\comma \; }\; {\rm\kappa} _{ij} \lpar s+1\rpar =0\; \; \hfill} \right\}\; \forall j \in c\comma \; \;$$
where s is the number of iteration step. Unsuccessful outcomes may be obtained when data is noisy, duplicate, or not convex shaped (Ross, Reference Ross1995).
4.2. Fuzzy c-means (FCM) algorithm
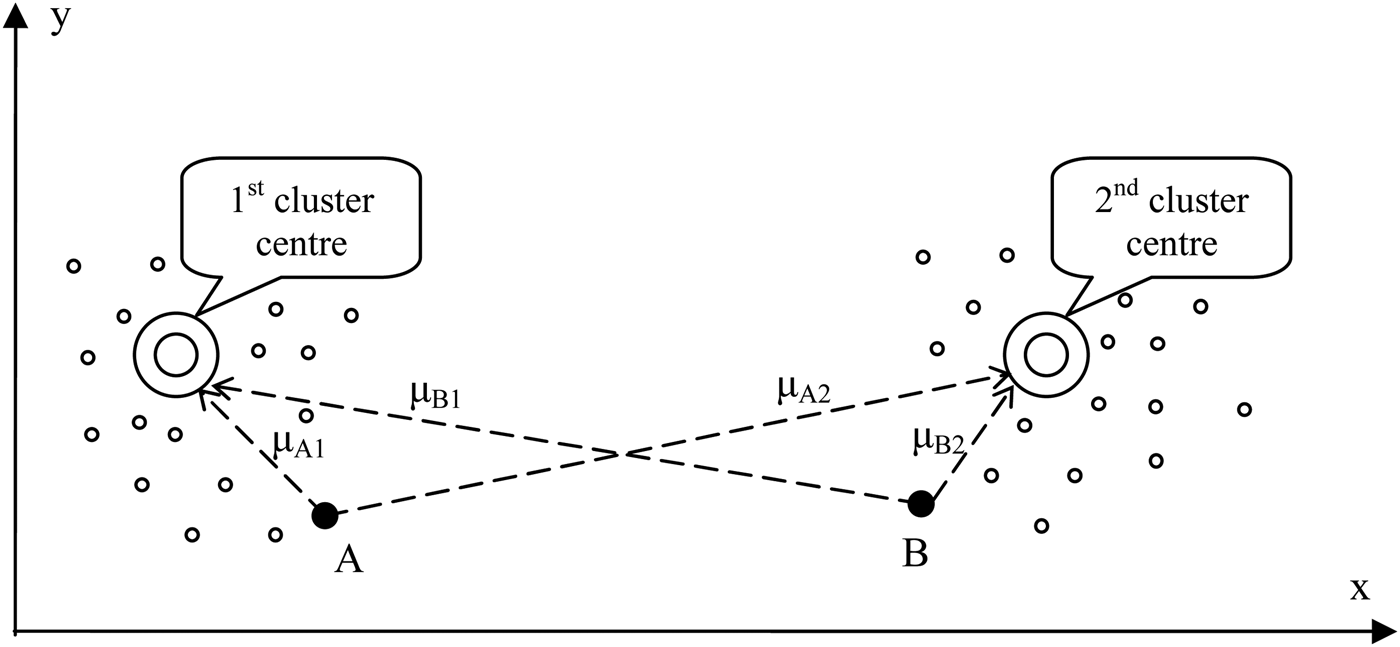
The HKM method is a crisp classification technique, and as can be derived from its formulation, a data point can belong to a certain cluster or not. Instructing the partial belongingness concept by advantage of fuzzification, the FCM method was developed by Bezdek (Reference Bezdek1981). Derived from the Euclidean distance of a data point to a certain cluster center, computation of a membership value enables the determination of a data point's partial belonging to any certain cluster. The primary difference between the crisp and fuzzy classification concepts is sketched in Figure 1. Assuming that there are two cluster centers, from the figure, it is clear that the points A and B belong to the first and second cluster centers, respectively. In the light of this, crisp classification techniques compute the µA2 and µB1 values as 0. In contrast, µA1 and µB2 values will be 1. In fuzzy classification, the membership of a point to every cluster is calculated in each calculation step, and the greatest value of membership determines which cluster this point belongs to. Therefore, a comparative evaluation of memberships reveal that µA1 > µA2 and µB2 > µB1. As will be mentioned, membership values range between 0 and 1 (Wu & Yang, Reference Wu and Yang2002; Miyamoto et al., Reference Miyamoto, Ichihashi and Honda2008).
Definition of membership values: x and y are dependent parameters.
An additional parameter instructed to the HKM algorithm is the fuzzification parameter (m′), ranging between 1 and a feature number (n). For every data point, the greatest membership value to any cluster indicates which cluster this data point belongs to. Similar to HKM, the dissimilarity function in Equation (8) is minimized to terminate the algorithm after supplying a satisfactory amount of error e, belonging to the data point of the cluster. The dissimilarity function [Equation (8)] was minimized to create a criterion for the algorithm termination step (Lanhai, Reference Lanhai1998):
 $$\min\left[{J_m \left({{\bf U}\comma \; {\bf v}} \right)} \right]=\min\left[{\sum\limits_{k=1}^n {\sum\limits_{i=1}^c {\left({{\rm\mu} _{ik} } \right)^{m^{\prime} } \times \left({d_{ik} } \right)^2 } } } \right]\comma \;$$
where μik is the membership degree of the kth data point in the ith cluster and d ik is the Euclidean distance between kth data point and ith cluster center, which is depicted in Equation (9).
 $$d_{ik}=\Vert x_k-v_i \Vert =\sqrt {\sum\nolimits_{i=1}^{m}\lpar x_{ki}-v_{i}\rpar ^2}.$$
The centroids herein may be calculated by
 $${\bi v}_{ij}=\displaystyle{{\sum\nolimits_{k=1}^n {{\rm\mu} _{ik} ^{m^{\prime}}\, \times x_{kj} } } \over {\sum\nolimits_{k=1}^n {{\rm\mu} _{ik} ^{{\bi m}^{\prime}} } }} \quad\lpar {\rm for}\, j=1\colon m \, {\rm and}\, i=1\colon c\rpar \comma \;$$
where v is the matrix composed of cluster centers, x is the data point, and m′ is the fuzzification parameter or weighting coefficient. A series of iterative calculations are used to employ fuzzy partitioning (Bezdek, Reference Bezdek1981):
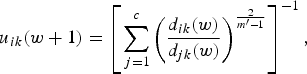 $$u_{ik} \lpar w+1\rpar = \left[\sum\limits_{\,j=1}^{c} \left({d_{ik}\lpar w\rpar \over d_{ jk}\lpar w\rpar }\right)^{2\over m^{\prime} -1}\right]^{-1}\comma \;$$
where w is the calculation step. In any step, the following criterion is the key to terminate the algorithm:
 $$\Vert U^{w+1} - U^{w} \Vert \le {\rm \varepsilon}.$$
Generally speaking, minimization of the objective function, satisfying the criterion in Equation (12), leads to optimized cluster centers.
4.3. Self-organizing maps (SOMs)
SOMs utilize a competitive learning process, which is based on a “winner takes all” rule to categorize features without feedback. Consisting of two layers, input layer is one dimensional, and output neurons are arranged in two dimensions. Briefly, with the aid of the topological neighboring concept, a winning neuron in the output, which is a competitive layer. is determined Haykin (Reference Haykin1996). Many topological shapes could be utilized for neighborhood detection (Şen, Reference Şen2004), but the most common shape, rectangular neighborhood, was used in this study.
In the algorithm, output of each neuron is calculated as follows:
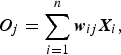 $${\bi O}_j=\sum\limits_{i=1}^{n} {\bi w}_{ij} {\bi X}_{i}\comma \;$$
where O denotes the output vector, w is the weight matrix, and X is the input vector. The weights of the output unit with the highest activation are updated. Euclidean distance is usually leveraged to determine the distance between the winning neuron and the processing neuron in the output layer:
 $$d_j =\Vert X_j - w_{ij} \Vert.$$
In Equation (14), d is the lateral distance vector. The best choice for the quantification of the topological neighborhood function is the Gaussian distribution function. Because this function is bell shaped, it can comfortably satisfy the criteria above:
 $$h_{ij}=\exp\lsqb\! {-}\lpar d_{ij}^{2}/2 {\rm\sigma}^2\rpar \rsqb \comma \;$$
where h ij is the topological neighborhood and σ is the neighborhood width parameter. As a consequence, the weights of the neighboring neurons were updated after the determination of the winning neuron via the following equation:
 $$w_{ij}\lpar t+1\rpar =w_{ij}\lpar t\rpar +{\rm\eta}\lpar t\rpar h_{ij}\lpar t\rpar {\bf \lfloor} X_{\,j}\lpar t\rpar -w_{ij}\lpar t\rpar \rfloor.$$
In Equation (16), t is the iteration step, and η is the learning rate parameter, which diminishes through the iterative process. The iterative process ends when a stable output lattice is obtained (Kohonen, Reference Kohonen1982, Reference Kohonen1998; Göktepe et al., Reference Göktepe, Sezer, Sezer and Ramyar2008).
5. RESULTS AND DISCUSSION
The strength behavior of fine-grained soils is highly dependent on consistency because water existence can change the behavior of clay from quick clay to a stiff medium. As stated above, past researchers classified the consistency and strength in terms of the SPT-N parameter. In this study, an aim was that the results could be a way of estimation of SPT-N of soils when the field values sound unreliable. The opposite can also be considered. When the shear strength parameter is not experienced within the expected range in the laboratory, the SPT-N and liquidity index parameters can be questioned for estimation of shear strength. The results of this study revealed that this is somehow possible with the aid of unsupervised clustering algorithms; however, it should be underlined that the data in this study is regional. It is impossible to state whether the use of a clustering method or a tabulated classification technique depicted in the background section is more advantageous; however, use of field data and correlation with the laboratory test ensures the strength of the method proposed in this study. Because it is known that a fine-grained soil gets softer as its SPT-N value decreases, and soils of higher liquidity index are weaker, it is apparent that these parameters are indicators of the strength of the soils. In this regard, use of unsupervised clustering algorithms and benefiting from their ability of clustering data in a neighboring and proximity- based manner, unsupervised clustering algorithms step forward due to their classification ability and the flexibility in selection of the dependent parameters, which can always be reevaluated for different soil conditions.
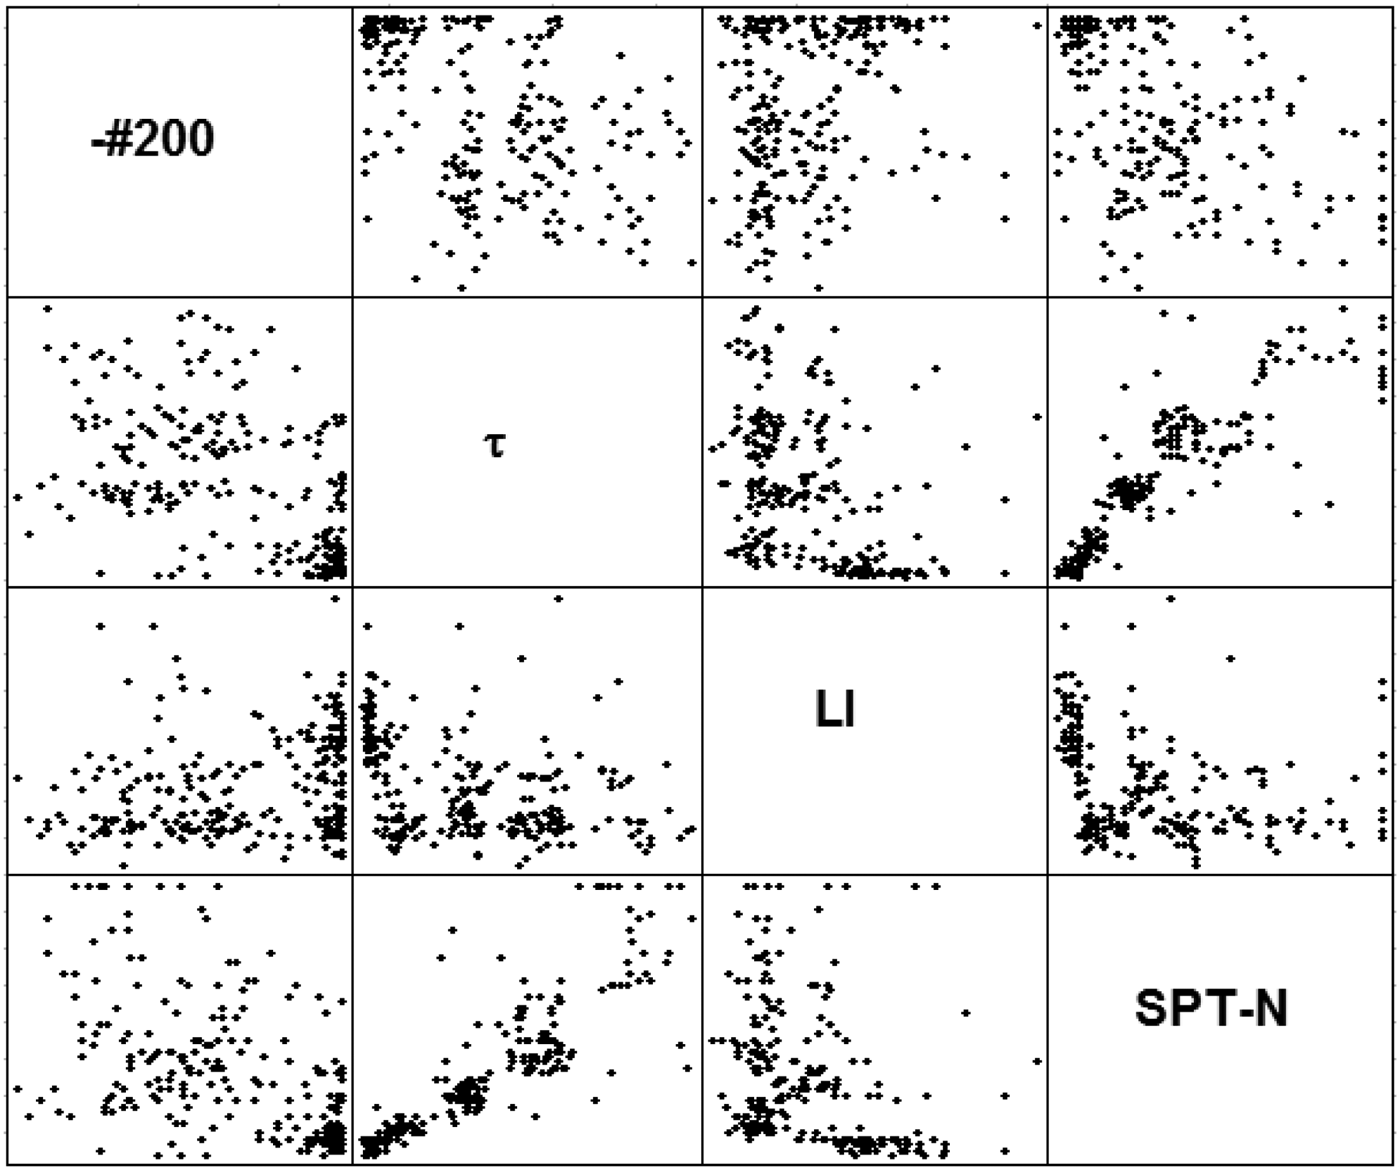
In this scope, boring results obtained from the Karşıyaka municipality to the north of Izmir city were collected and arranged. Evaluating in detail, it was decided to simplify the classification problem by use of three input parameters; later, the dimension of input space was reduced to two. Investigation of the scatter plot in Figure 2 provided determination of parameters seeming to have a valid trend with the SPT-N value. Initial clustering attempts were conducted using no. 200, LI, and shear strength parameters. However, the results were unsuccessful because the shear strength values in all considered classes were including a wide range of no. 200 sieve material (Fig. 2). Compared to τ or LI, it was apparent that there were no correlative relationships among the no. 200 parameter and SPT-N or the rest of the parameters. Therefore, a second attempt in clustering was made neglecting this parameter. Subsequent paragraphs include information about these attempts. It should be emphasized that, in addition to shear strength, many clustering attempts using plasticity index, water content, liquid limit, and no. 200, as well as their combinations, were made, and classification based on LI and τ parameters yielded the best results.
Scatter plots of the parameters considered in this study. Note that the no. 200 parameter was discarded later. LI, Liquidity index; SPT-N, standard penetration test standard penetration resistance value.
5.1. Statistical analysis of the database
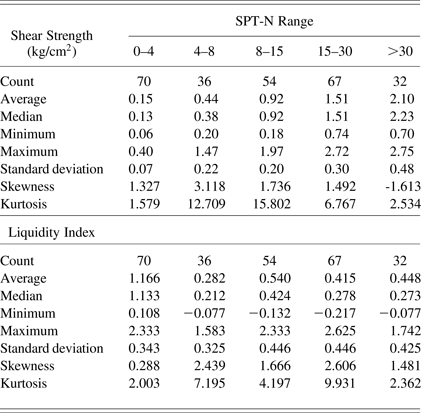
A basic statistical analysis of the dependent parameters tabulated in Table 2 revealed that, as the SPT-N value increases, the average value of shear strength increases, whereas the liquidity index values showed a decreasing trend with fluctuations. The same trend seemed to exist in minimum and maximum values, so these were the signs of distinct clusters. Parallel to the increase in average of the shear strength, an increasing trend was also noted down for the standard deviation of this parameter. The skewness coefficient for τ indicated that bulk values lie to the right of the mean up to an SPT value of 30. For the skewness of LI, the same interpretation can be made; however, this time all the skewness values were positive. These parameters indicate that the tail on the right side of the probability density function was longer than on the left side, for each SPT class. This was a good outcome, especially for the LI parameter, because the ability of classification was prone to increase due to this finding. The same conclusions can be derived from box-whisker plots given in Figure 3. From Figure 3a, it was clear that the range of the data increases as the SPT-N number increases. All the clusters had outliers that did not fall in the interquartile range. From Figure 3b, similar to Figure 3a, outliers were observed and data interquartile ranges were close to each other, except the SPT-N range (4–8).
Box-whisker plots of the data to be classified. SPT-N, Standard penetration test standard penetration resistance value.
Descriptive statistics of the classifiers in SPT-N clusters
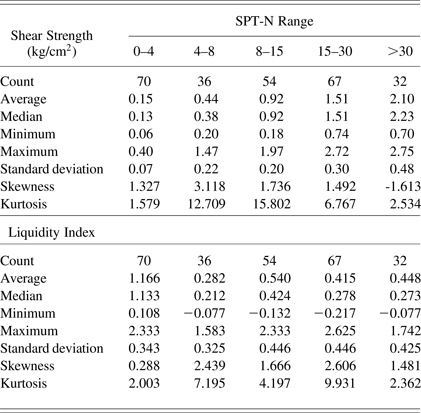
Note: SPT-N, standard penetration test standard penetration resistance value.
Unifying the ranges of very soft and soft classes (Table 1) in one cluster, five clusters were pronounced for the classification tables of Terzaghi and Peck (Reference Terzaghi and Peck1967), Tschebotarioff (Reference Tschebotarioff1973), and Parcher and Means (Reference Parcher and Means1968). Analyzing the center points and the range of the clusters as well as the extreme values for shear strength, the clusters seemed to be in accordance with Tschebotarioff (Reference Tschebotarioff1973). It should be noted that, the field values did not coincide with the ranges given in Tschebotarioff (Reference Tschebotarioff1973) in a strict manner; however, they were in accordance to a reasonable degree.
5.2. SPT-N clustering using shear strength and LI parameters
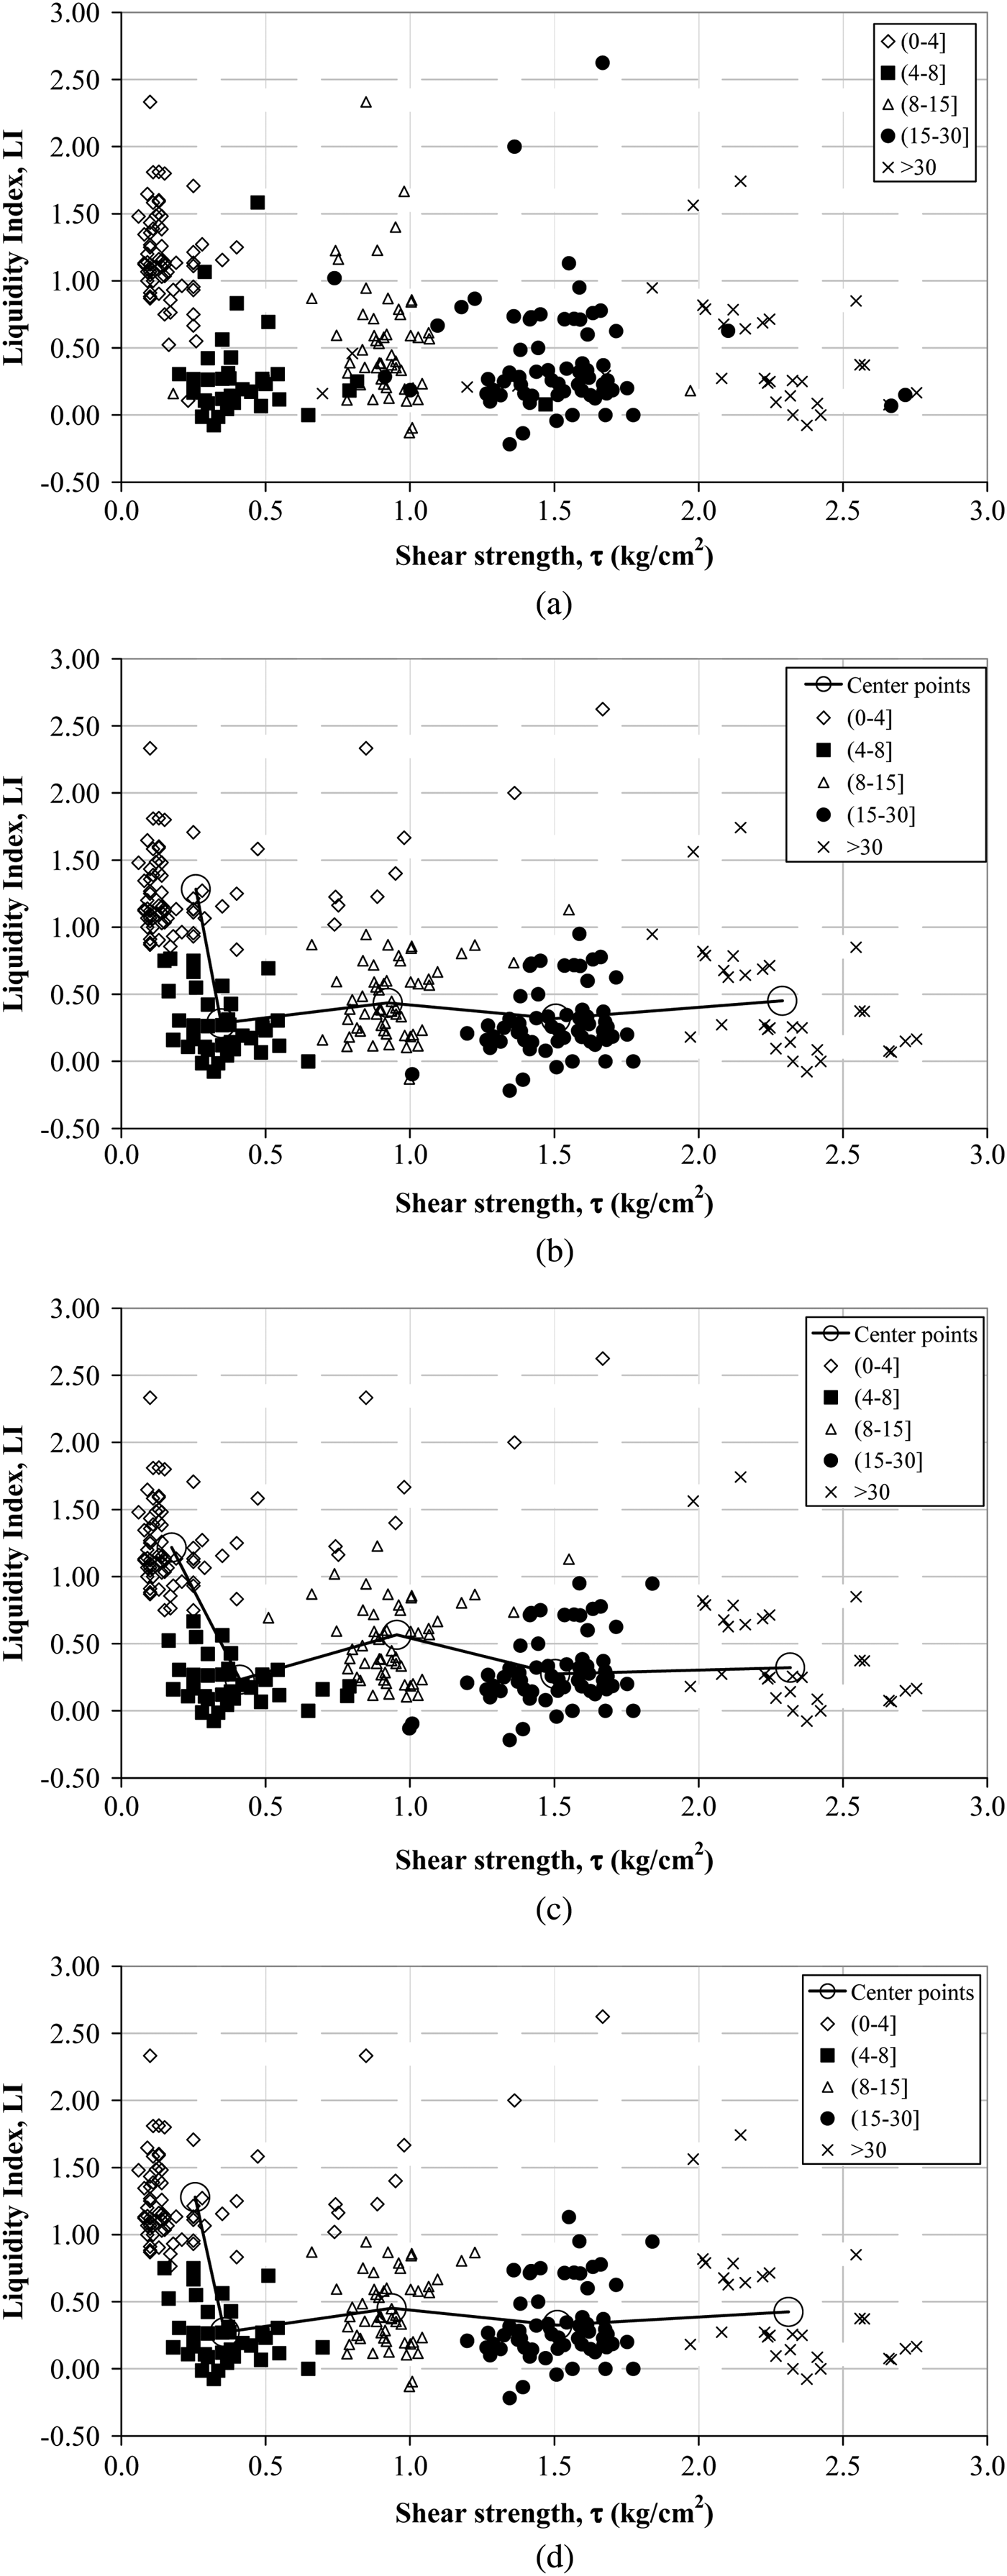
The three algorithms were used to cluster the input data in terms of shear strength and LI parameters. Comparing with real SPT-N values, the performances of the classifiers were evaluated in terms of classification rates. The results obtained from clustering sessions are given in Figure 4, where Figure 4a includes the SPT clusters obtained from field tests. Figure 4b–d shows the results of clustering attempts using τ and LI data. Big circular marks that are interconnected with solid lines represent the cluster centers. A crude examination of these graphs gives the conclusion that the results of the clustering sessions are not different from each other. Nevertheless, this is an expected conclusion that can be drawn from the scatter plot given in Figure 2. It should be emphasized that the graphs, including results of the clustering sessions, indicate that these parameters can be used for classification of SPT-N in the field. The results seem to be in accordance with real life data.
Two-dimensional plots of (a) field data, (b) hard k-means clustering results, (c) fuzzy c-means clustering results, and (d) self-organizing map clustering results
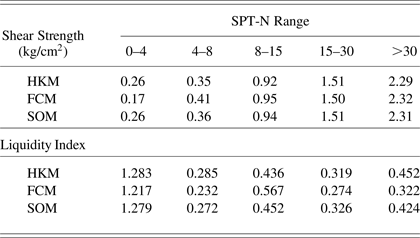
Analyzing the data given in Table 3 in detail, the variety in the LI component of the center points is greater than those of τ. As expected, center coordinates of the FCM algorithm for five clusters are not close to those of HKM and SOM. The variation among the center points of the HKM and SOM algorithms are on the order of 5%; however, greater values are pronounced for the variations among HKM/FCM and SOM/FCM. To our surprise, this result did not positively affect on the classification rates of FCM.
Center points of the clusters obtained using different classifiers
Note: SPT-N, standard penetration test standard penetration resistance value; HKM, hard k-means; FCM, fuzzy c-means; SOM, self-organizing map.
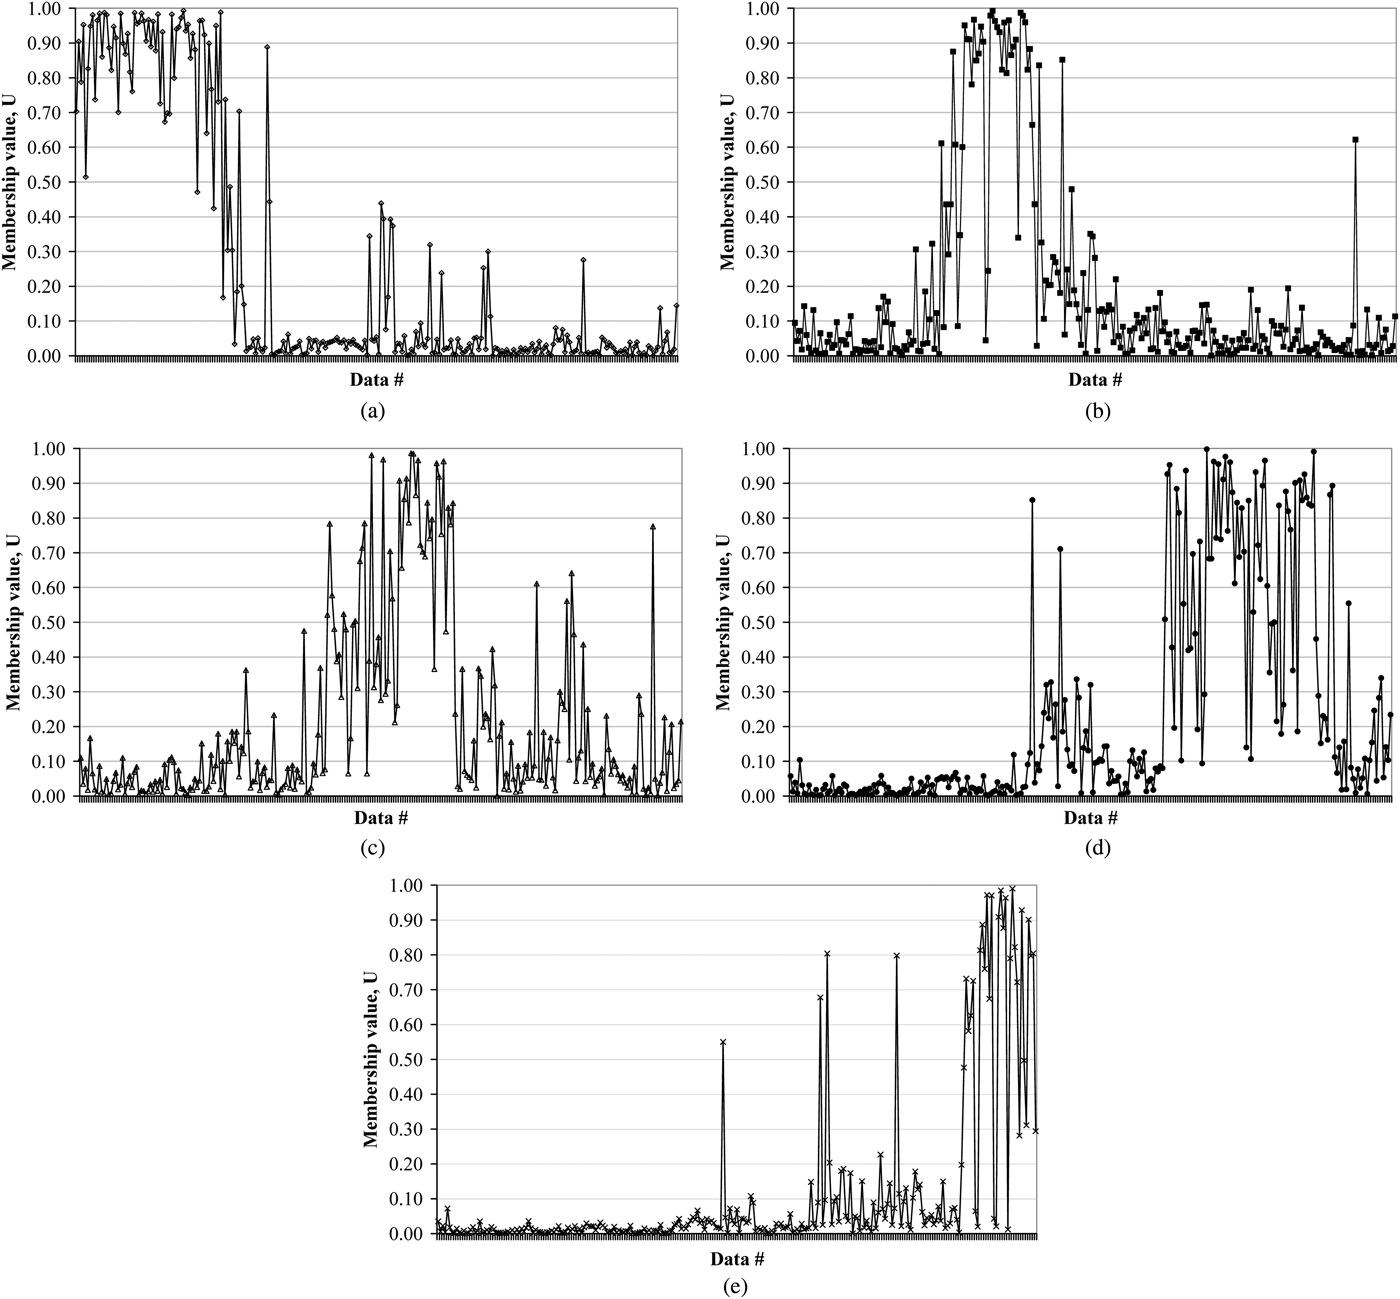
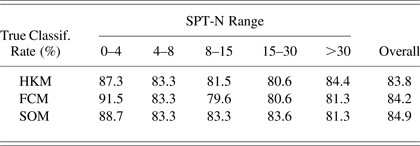
The true classification rates of the three algorithms are given in Table 4. The overall classification rates showed that a SOM algorithm employed for 200 iterations classified the data slightly better than the two remaining algorithms. The classification rates of the SOM, FCM, and HKM algorithms are 84.9%, 84.2%, and 83.8%. Analyzing in detail, FCM produced better outcomes for extremely close clusters (0–4) and (4–8); however, it produced slightly worse performance in comparison with HKM and SOM. This is also seen in partial membership values plotted in Figure 5. The data was arranged in an ascending manner by means of SPT-N, and it was noticed that the membership of the data belonging to the (0–4) and (4–8) clusters were greater, in comparison with the remaining three cluster of the higher SPT-N ranges. Moreover, the multiple peaks and reduced maximum membership values in Figure 5c–e confirms these findings. As a result, none of the classifiers here can be pointed to as a better classifier, and it can be stated that three of the algorithms here serve the needs for SPT-N classification. However, it should not be ruled out that the data in this study is regional, and further attempts should be made to classify these data including different types of laboratory tests, SPT-N equipment, and soil types.
Membership values of the standard penetration test standard penetration resistance value classes in the fuzzy c-means algorithm (a) 0–4, (b) 4–8, (c) 8–15, (d) 15–30, and (e) >30.
Performances of classification algorithms
Note: SPT-N, Standard penetration test standard penetration resistance value; HKM, hard k-means; FCM, fuzzy c-means; SOM, self-organizing map.
6. CONCLUSIONS
In this study, three classifiers (HKM, FCM, and SOM) are employed to classify the SPT-N parameter in terms of the shear strength and LI parameters. It was aimed to classify the SPT-N value in the field using various parameters. Moreover, three classifiers were evaluated and the outcomes and their classification abilities were compared as well. The following results can be drawn from this study:
1. As observed from the studies in the past, the partial belongingness concept in the FCM parameter encourages its use due to its increased classification ability. Although this algorithm was successful in classification of close clusters in this study, the classification rates overall are not markedly greater than the SOM and FCM.
2. In addition to the shear strength parameter, many input parameters were tried for better classification rates including plasticity index, no. 200 sieve, water content, and liquid limit. Classification based on the LI and the shear strength parameters produced the best outcomes. The overall classification rates of the three algorithms were between 83.8% and 84.9%. These values are acceptable for classification of a highly variable SPT-N parameter, which is affected from field and testing conditions as well as water existence.
3. When two of them are reliable and one is ambiguous, the results of this study have a potential to confirm SPT-N, liquidity index, or shear strength parameters. However, it should be taken into account that the data in this study is regional, and further attempts should be made to classify these data, including different types of laboratory tests, SPT-N equipment, and soil types from various parts of the world.
4. These clustering algorithms can be used in classification of various types of scientific data, as stated in the past studies. The clustering algorithms, along with the benefits of using geographical information systems, can provide powerful insight in spatial characterization, regionalization, and classification of various data obtained in studies conducted in any branch of engineering or life sciences, including interdisciplinary research. Nonetheless, as stated in the Background Section, apart from classification of civil engineering field data, these classifiers have found application areas in agricultural engineering, signal processing, environmental engineering and management, industrial engineering, and administrative sciences as well. Because these classifiers do not require a learning process and their ability in clustering utilizing multidimensional data is remarkable, their use can be beneficial. Moreover, the simple algebra in the background of the algorithms makes their use possible and plausible to classify and evaluate different types of data.
A.B. Göktepe is the General Manager of Energy and Construction groups as well as an administrative board member of Kurum Holding in Albania. He attained his BS, MS, and PhD degrees from the Civil Engineering Department at Istanbul Technical University. His research areas include transportation engineering and geotechnics. Dr. Göktepe has published more than 100 papers in the field of civil engineering.
Selim Altun is currently the Vice Dean of Ege University, Faculty of Engineering, and Head of the Geotechnical Engineering Division in the Civil Engineering Department of Ege University. He attained his BS, MS, and PhD degrees from the Civil Engineering Department at Istanbul Technical University. His research areas include geotechnical engineering and foundation engineering. Dr. Altun has published more than 100 papers in the field of civil engineering.
Alper Sezer is an Associate Professor in the Department of Civil Engineering at Ege University. He received his BS in civil engineering from Istanbul Technical University and his MS and PhD in civil engineering from Ege University. He conducted his postdoctoral research at Bristol University. Dr. Sezer's research interests include geotechnical engineering and foundation engineering.