

1. Introduction
Chondritic meteorites have been used as a benchmark for the chemical and isotopic composition of the Bulk Earth for several decades. Therefore, it caused considerable upset when Boyet & Carlson (Reference Boyet and Carlson2005, Reference Boyet and Carlson2006), confirming earlier hints by Nyquist et al. (Reference Nyquist, Wiesmann, Bansal, Shih, Keith and Harper1995), showed that the accessible Earth has a supra-chondritic 142Nd signature. 142Nd is the decay product of the extinct nuclide 146Sm. Because this decay scheme shares the same parent and daughter elements as the long-lived 147Sm–143Nd system, a supra-chondritic 142Nd signature also implies a supra-chondritic 143Nd signature for the Earth's mantle. This has profound implications for the geochemical evolution of the Earth, overturning long-established models.
To explain why terrestrial 142Nd departs from its expected chondritic signature, four alternative Earth models have been proposed: (1) Sm/Nd fractionation in the early Earth by the creation of an enriched reservoir in the deep mantle (Boyet & Carlson, Reference Boyet and Carlson2005, Reference Boyet and Carlson2006); (2) Sm/Nd fractionation by preferential crustal ablation during Earth accretion (Warren, Reference Warren2008; O’Neill & Palme, Reference O’Neill and Palme2008); (3) Sm/Nd fractionation during the orbital differentiation of the solar system (Caro et al. Reference Caro, Bourdon, Halliday and Quitte2008; Caro & Bourdon, Reference Caro and Bourdon2010); and (4) isotopic heterogeneity inherited from pre-solar nucleosynthesis (Andreasen & Sharma, Reference Andreasen and Sharma2006; Ranen & Jacobsen, Reference Ranen and Jacobsen2006). However, each of these models has significant problems in reconciling Earth's 142Nd signature with other isotopic evidence, and no consensus has been achieved.
The 142Nd signature of the Moon provides an important line of evidence for testing these models. Because the Moon is believed to have sampled the early Earth in a giant impact but has remained geologically static for more than 3 billion years, it can provide a window into the early history of the Earth that is critical for solving the 142Nd conundrum.
2. Giant impact models for lunar origins
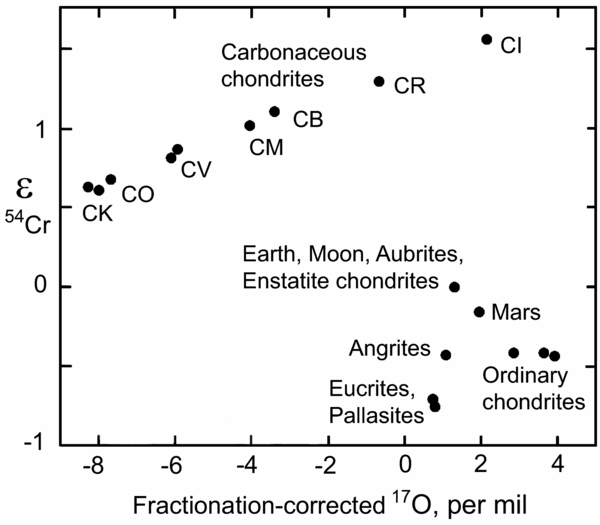
The Earth and Moon have almost identical isotope signatures for several elements, after correction for the effects of mass-dependent isotope fractionation. Homogeneity of fractionation-corrected 17O between the Earth and Moon has been known for some time (Wiechert et al. Reference Wiechert, Halliday, Lee, Snyder, Taylor and Rumble2001), but more recent work has added several more stable isotope systems to this list. For example, Figure 1 compares fractionation-corrected chromium and oxygen signatures in the Earth, Moon and Mars with most major meteorite types (Trinquier, Birck & Allegre, Reference Trinquier, Birck and Allegre2007). Despite huge variations between carbonaceous and ordinary chondrites, the Earth and Moon have identical signatures, along with the enstatite chondrites and enstatite achondrites (aubrites). Similar results have also been found for Ti, Mo and Zr (Dauphas, Marty & Reisberg, Reference Dauphas, Marty and Reisberg2002; Burkhardt et al. Reference Burkhardt, Kleine, Oberli, Pack, Bourdon and Wieler2011; Akram et al. Reference Akram, Schönbächler, Bisterzo and Gallino2015), implying that E-chondrites and aubrites, along with the Earth and its giant impactor (Theia), all grew within a similar orbital space in the solar system (Dauphas et al. Reference Dauphas, Chen, Zhang, Papanastassiou, Davis and Travaglio2014).
Plot of fractionation-corrected chromium and oxygen isotope ratios shown as ɛ (part per 104) and δ (part per 103) deviations from standard values. Modified after Trinquier, Birck & Allegre (Reference Trinquier, Birck and Allegre2007).

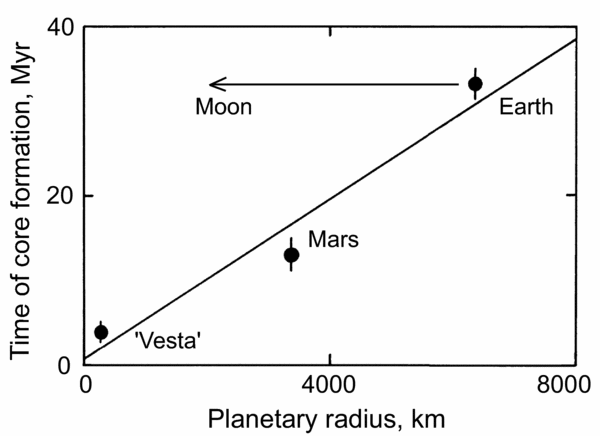
The Earth and Moon also share nearly identical signatures of some extinct nuclide systems such as Hf–W, which continued to evolve during the period of planetary accretion. Because 182W is much more siderophile than its parent, fast rates of core growth, relative to 182Hf decay, generally produce radiogenic 182W signatures in planetary mantles. However, larger bodies like the Earth have less radiogenic tungsten signatures than small bodies such as the eucrite parent body and Mars (Kleine et al. Reference Kleine, Münker, Mezger and Palme2002). This is thought to have occurred because most planetesimals that were accreted to the Earth were re-homogenized during impact, partially resetting its Hf–W clock (Halliday, Reference Halliday2004). In view of the complexities of this growth process, it is highly unlikely that Theia could have had the same the 182W signature as the Earth at the time of their collision. However, recent work has measured 182W differences between the Earth and Moon of only 20–30 ppm, which can be accounted for by the late meteorite bombardment (Kruijer et al. Reference Kruijer, Kleine, Fischer-Godde and Sprung2015; Touboul, Puchtel & Walker, Reference Touboul, Puchtel and Walker2015). This implies that the identical Hf–W ages of the Earth and Moon must have been a product of the collision process itself (Fig. 2).
Plot of apparent Hf–W ages of solar system bodies, compared to their measured or estimated radii, showing the abnormal signature of the Moon. Modified after Kleine et al. (Reference Kleine, Münker, Mezger and Palme2002).

Homogenization of lunar and terrestrial isotope signatures cannot be achieved by ‘conventional’ giant impact models between Earth and Mars-sized objects, which obtain most of the Moon's mass from the impactor (Halliday, Reference Halliday2012). Two viable alternatives involve either a ‘total annihilation’ model in which two equal-sized bodies are thoroughly mixed (Canup, Reference Canup2012), or a high-velocity oblique collision involving a much smaller impactor (Fig. 3). In the latter case, an impactor with < 5% of the Earth's mass hits a rapidly counter-spinning Earth (Cuk & Stewart, Reference Cuk and Stewart2012). Such highly energetic collisions cause the Earth's mantle to lose as much as 10% of its mass, of which a small fraction forms the Moon while the rest is lost to space. The bulk of the impactor's core is added to Earth's core, but half of its mantle is lost into space, so the Moon forms largely from Earth's mantle.
Schematic cross-section of the Earth and Theia (the impactor) immediately before an oblique collision, in a numerical model that creates the Moon largely from Earth's mantle (Cuk & Stewart, Reference Cuk and Stewart2012). Letters indicate the fate of the bulk of material in each zone: C – Earth's core; E – Earth's mantle; A – short-lived terrestrial ‘atmosphere’ of silicates; S – lost to space; black dots – Moon.

Both of these models (Cuk & Stewart, Reference Cuk and Stewart2012; Canup, Reference Canup2012) yield an Earth–Moon system with excess angular momentum relative to the present day, but this can be lost by resonance between an elliptical lunar orbit and Earth's orbit round the Sun. Tides within the Earth slow the Earth's spin by transferring angular momentum to the Moon. A resonance between the Moon's elliptical orbit and Earth's orbit round the Sun then transfers this angular momentum from the Earth–Moon system to the Sun–Earth system.
3. Significance of the lunar Nd isotope signature
142Nd data for the Moon have been accumulating from several studies over the past ten years, with strong agreement between the two most recent (Brandon et al. Reference Brandon, Lapen, Debaille, Beard, Rankenburg and Neal2009; McLeod, Brandon & Armytage, Reference McLeod, Brandon and Armytage2014). These studies show that all three major types of lunar basalt lie on a single 146Sm–142Nd pseudochron (Fig. 4). The word pseudochron is used to indicate (1) that it involves an extinct nuclide system whose parent isotope has completely decayed, and (2) that the system being dated is the hypothetical source of a variety of lunar basalts, rather than the rocks themselves. However, within the parameters of these model conditions, it can be treated as a true isochron, yielding the differentiation age of the Moon, generally taken to represent the final stage of crystallization of the lunar magma ocean that resulted from the giant impact.
142Nd–143Nd pseudochron, plotting ppm 142Nd deviations from terrestrial standards against part per 10000 deviations of 143Nd from CHUR, for widely recognized lunar basalt types. Data from McLeod, Brandon & Armytage (Reference McLeod, Brandon and Armytage2014), with additional samples from Brandon et al. (Reference Brandon, Lapen, Debaille, Beard, Rankenburg and Neal2009). All analyses were corrected for cosmogenic isotope production on the lunar surface. KREEP – potassium, rare earth elements, phosphorus.

On the pseudochron diagram in Figure 4, the y-axis (μ142Nd) represents part-per-million deviations of 142Nd/144Nd from the terrestrial standard value, while the x-axis (ɛ143Nd) provides a better proxy for the original 146Sm/144Nd ratios of lunar mantle reservoirs than the measured Sm/Nd ratios in analysed lunar basalts. Several slightly different versions of this proxy have been used (Boyet & Carlson, Reference Boyet and Carlson2007; Caro et al. Reference Caro, Bourdon, Halliday and Quitte2008; Brandon et al. Reference Brandon, Lapen, Debaille, Beard, Rankenburg and Neal2009). The version in Figure 4 involves the least extrapolation of the raw data, by calculating ɛ Nd values of all the samples at 3.3 Ga, the average age of the youngest (low-Ti) lunar basalt suite, assuming that all samples differentiated from a chondritic source at 4.4 Ga (to be justified below). The resulting ɛ143Nd values are proportional to the 146Sm/144Nd ratios of lunar mantle reservoirs at the time of the Sm/Nd differentiation event (final crystallization of the lunar magma ocean).
McLeod, Brandon & Armytage (Reference McLeod, Brandon and Armytage2014) calculated a 142Nd pseudochron age of 4.385±0.015 Ga using a 103 Ma 146Sm half-life (Marks et al. Reference Marks, Borg, Hutcheon, Jacobsen and Clayton2014) and a two-stage lunar evolution model. This relatively late age for lunar differentiation (180 Ma after solar system formation) can be explained by slow cooling of the lunar magma ocean due to the early meteorite bombardment. It is consistent with a firm minimum age of 4.38 Ga for primary lunar differentiation based on Hf isotope analysis of zircon in KREEP-enriched Apollo 14 basalts (Taylor, McKeegan & Harrison, Reference Taylor, McKeegan and Harrison2009). It is also consistent with a maximum age of 4.42 Ga for the lunar crust based on the oldest ion-microprobe U–Pb ages for lunar breccias (Borg, Gaffney & Shearer, Reference Borg, Gaffney and Shearer2015). On the other hand, other younger (and older) ages for lunar rocks and their source reservoirs can be attributed to open system behaviour of lunar rocks and source reservoirs caused by later giant impacts.
4. Comparison of CHUR and SCHEM models
The most notable feature of the lunar pseudochron (Fig. 4) is that it does not pass through the terrestrial 142Nd signature at a chondritic Sm/Nd ratio. This leads to two alternative geochemical evolution models for the Earth and Moon. If they share a common 142Nd signature (μ142Nd = 0), the Earth and Moon must also share a supra-chondritic Sm/Nd ratio (Caro et al. Reference Caro, Bourdon, Halliday and Quitte2008; Brandon et al. Reference Brandon, Lapen, Debaille, Beard, Rankenburg and Neal2009). Alternatively, if they maintain a chondritic Sm/Nd ratio (ɛ143Nd = 0), they must have distinct 142Nd signatures (Sprung, Kleine & Scherer, Reference Sprung, Kleine and Scherer2013; Huang, Jacobsen & Mukhopadhyay, Reference Huang, Jacobsen and Mukhopadhyay2013).
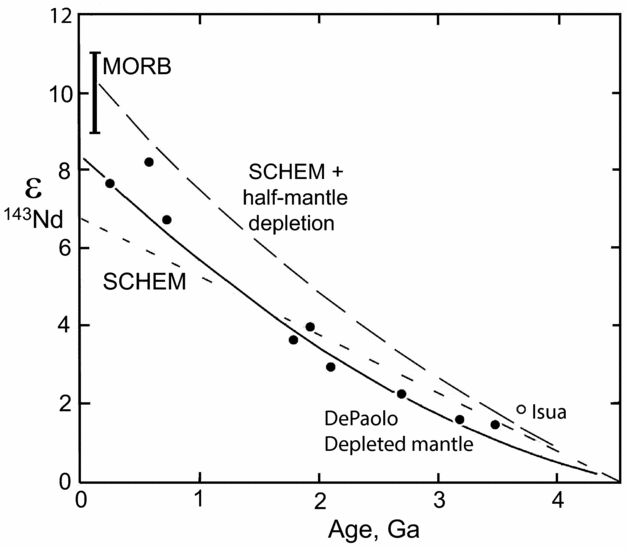
The supra-chondritic Earth model (SCHEM) appears to be the more straightforward of the two models, and has been attributed to Sm/Nd fractionation during orbital differentiation or terrestrial accretion (models 2 and 3 in Section 1). However, the required 5% increase in Sm/Nd ratio leads to major problems for the 143Nd systematics of both the Earth and Moon. As shown in Figure 5, the SCHEM model yields a Bulk Earth evolution line ending at a present-day ɛ143Nd value of c. +6.9. However, the effects of crustal extraction must be added on top of the SCHEM model, thus creating a more LIL (large ion lithophile)-depleted upper mantle reservoir.
Nd isotope evolution plot showing average initial ratios of (terrestrial) juvenile mafic rock suites relative to alternative depleted mantle evolution lines. Modified after Caro & Bourdon (Reference Caro and Bourdon2010). MORB – mid-ocean ridge basalt; SCHEM – supra-chondritic Earth model.

The estimated composition of the depleted mantle depends on the volume of mantle thought to be depleted by crustal extraction. Early box models (e.g. Jacobsen & Wasserburg, Reference Jacobsen and Wasserburg1979; O’Nions, Evensen & Hamilton, Reference O’Nions, Evensen and Hamilton1979) suggested that 25% to 50% of the mantle was depleted to generate continental crust, therefore implying that the lower mantle might be undepleted. However, it is now recognized that the lower mantle contains a huge quantity of subducted LIL-enriched crustal material, with up to 20 times the volume of the present continental crust (Tolstikhin, Kramers & Hofmann, Reference Tolstikhin, Kramers and Hofmann2006). Therefore, mantle depletion occurred to produce both the existing crust and subducted crustal reservoirs, and the present volume of continental crust probably accounts for less than 50% of mantle depletion over Earth history. This means that the SCHEM + half-mantle depletion model (Fig. 5) represents a realistic lower bound of depleted mantle source compositions using the SCHEM model.
In comparison with this model, the average initial Nd isotope signatures of juvenile mafic rocks compiled by Caro & Bourdon (Reference Caro and Bourdon2010) have much less depleted compositions (solid circles in Fig. 5), which are nevertheless close to the depleted mantle (DM) model of DePaolo (Reference DePaolo1981). The exception of Isua will be discussed below. Apart from this case, a realistic combination of SCHEM and crustal extraction produces a mantle source that is too LIL-depleted (with 143Nd values too high) to produce the average compositions of juvenile mafic rock suites over time.
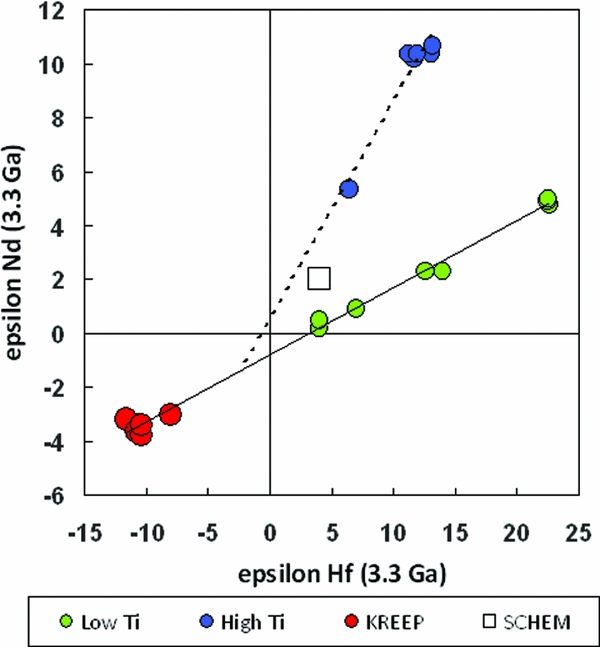
The SCHEM model has similar problems explaining the 143Nd isotope systematics of mafic lunar rock suites. These problems are seen most acutely when initial 143Nd compositions of lunar rocks are placed in the context of Hf isotope data (Sprung, Kleine & Scherer, Reference Sprung, Kleine and Scherer2013). The Hf isotope signatures of Moon rocks are susceptible to cosmogenic isotope production on the lunar surface. However, after these effects are corrected, strong correlations are seen between ɛ Nd and ɛ Hf signatures of lunar basalts (Fig. 6). Even though many individual samples have positive initial ɛ Nd values relative to CHUR (chondritic uniform reservoir), they define Nd–Hf isotope mantle arrays that pass close to the CHUR point. Sprung, Kleine & Scherer (Reference Sprung, Kleine and Scherer2013) showed that it is very difficult to obtain the array of low-Ti lunar basalts from the SCHEM source, because the basalt array passes two ɛ Nd units below the SCHEM point. In other words, just as for terrestrial mantle-derived rocks, the SCHEM source is too LIL-depleted to produce the Nd signatures of many lunar basalts without a special secondary enrichment process (such as mantle metasomatism), which is difficult to model (Sprung, Kleine & Scherer, Reference Sprung, Kleine and Scherer2013).
Initial ɛ Hf versus 143Nd signatures for lunar basalts, showing convergence towards a chondritic Sm/Nd ratio (ɛ = 0). Note that ɛ Nd is plotted on the vertical axis for comparison with Figure 5. Data from Sprung, Kleine & Scherer (Reference Sprung, Kleine and Scherer2013).

Based on this evidence for chondritic lunar Sm/Nd, Sprung, Kleine & Scherer (Reference Sprung, Kleine and Scherer2013) expressed some uncertainty about whether the Moon really does have a non-terrestrial 142Nd composition. However, the additional data presented by McLeod, Brandon & Armytage (Reference McLeod, Brandon and Armytage2014) solidify the non-terrestrial lunar 142Nd signature (Fig. 4). Assuming zero errors in ɛ143Nd, the standard deviation of individual 142Nd measurements about the isochron is 1.8 ppm. Since the zero 143Nd value is near the centroid of the isochron, there is little error magnification in calculating the uncertainty of 142Nd in the Bulk Moon (−5.9±1.5 ppm, 2 SEM), assuming equal weighting of errors. The fact that the high-quality data of McLeod, Brandon & Armytage (Reference McLeod, Brandon and Armytage2014) and Brandon et al. (Reference Brandon, Lapen, Debaille, Beard, Rankenburg and Neal2009) lie in the middle of the cloud of earlier data with larger errors (Brandon et al. Reference Brandon, Lapen, Debaille, Beard, Rankenburg and Neal2009) argues against systematic errors.
5. The enstatite chondrite model
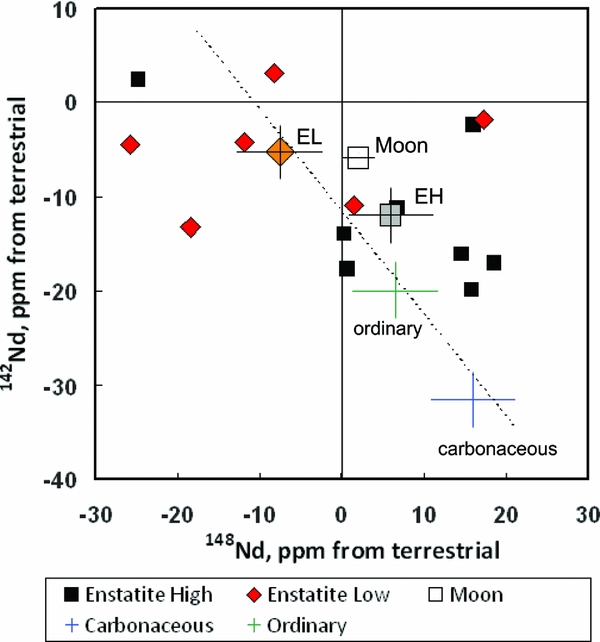
Although the c. 6 ppm discrepancy between terrestrial and lunar 142Nd signatures appears to be a problem, it can actually reconcile the Nd systematics of the Earth–Moon system with that of chondrites. In order to test the genetic relationship between these bodies, it is important to assess their 142Nd signatures against a non-radiogenic Nd isotope such as 148Nd (Fig. 7). Because 148Nd is non-radiogenic, and also has an r-process nucleosynthetic source distinct from most other Nd isotopes, this nuclide can be used to test the effects of variable Sm/Nd ratios and nucleosynthetic sources in controlling the isotope signatures of solar system bodies.
Deviations of 142Nd/144Nd versus 148Nd/144Nd in the Moon and different chondrite types relative to terrestrial standards. Error bars show 1σ standard errors on means. A regression through the chondrite means does not pass through the terrestrial composition. Data from Gannoun et al. (Reference Gannoun, Boyet, Rizo and Goresy2011) and the compilation of Boyet & Gannoun (Reference Boyet and Gannoun2013).

In Figure 7, the average compositions of carbonaceous, ordinary and enstatite chondrites form an array with a negative slope that passes well below the composition of terrestrial standards (Boyet & Carlson, Reference Boyet and Carlson2005; Andreasen & Sharma, Reference Andreasen and Sharma2006; Carlson, Boyet & Horan, Reference Carlson, Boyet and Horan2007; Gannoun et al. Reference Gannoun, Boyet, Rizo and Goresy2011; Qin, Carlson & Alexander, Reference Qin, Carlson and Alexander2011). This is indicated, for example, by the fact that no Nd isotope analyses plot in the positive quadrant of Figure 7 for both isotope tracers. This demonstrates that the accessible Earth does not lie on the extension of a nucleosynthetic mixing line through the chondrites. Therefore, model 4 (Section 1) is not sufficient alone to explain the discrepancy between terrestrial and chondritic 142Nd signatures, as recognized by Andreasen & Sharma (Reference Andreasen and Sharma2006, Reference Andreasen and Sharma2007). In contrast, the composition of the Bulk Moon (assuming a chondritic Sm/Nd ratio) does lie within 1 sigma error limits of the meteorite array. Therefore, the lunar composition forms a bridge between chondritic and terrestrial Nd models. Furthermore, detailed study of the elemental Sm/Nd ratios of enstatite chondrites shows that these are consistent with the established values from other chondrite types (Bouvier, Vervoort & Patchett, Reference Bouvier, Vervoort and Patchett2008). Hence, it is concluded that the Earth–Moon system has an isotopic composition similar to enstatite chondrites (Javoy et al. Reference Javoy, Kaminski, Guyot, Andrault, Sanloup, Moreira, Labrosse, Jambon, Agrinier, Davaille and Jaupart2010), but a secondary process must have generated the more radiogenic 142Nd signature of the accessible Earth.
6. Terrestrial mantle evolution
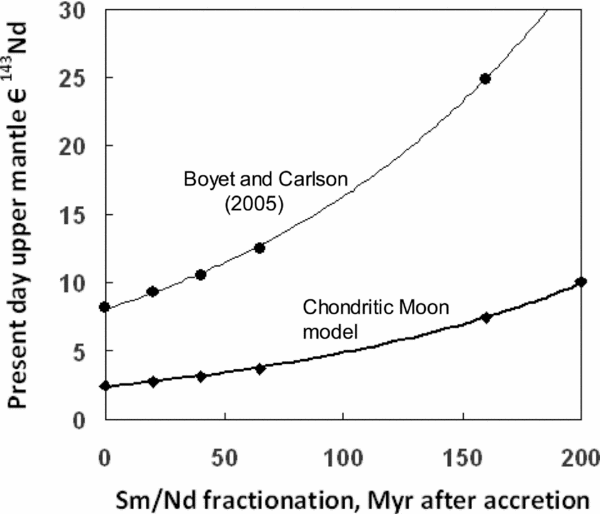
If the Earth and Bulk Moon are assumed to have had identical isotope ratios after the giant impact, their distinct present-day 142Nd signatures imply elemental Sm/Nd fractionation in the early Earth. Because Sm/Nd fractionation affects the long-lived 143Nd system, this places stringent limits on the timing of such an event. For example, early evidence for a 20 ppm 142Nd offset between chondrites and the Earth (Boyet & Carlson, Reference Boyet and Carlson2005) required a fractionation event within 30 Ma of solar system condensation to prevent the depleted mantle ɛ143Nd value from exceeding +10 at the present day (Fig. 8). However, this is very problematical because it would have pre-dated the giant impact. Even if the giant impact did not cause immediate homogenization of Earth's mantle (Fig. 3), vigorous convection would have assured such homogenization within a few million years (Caro & Bourdon, Reference Caro and Bourdon2010).
Plot comparing the results for modern ɛ143Nd of an early Earth Sm/Nd fractionation event at different times after solar system formation. The models yield a 6 ppm or 20 ppm increase of 142Nd in the depleted mantle.

Because the 142Nd difference between the Chondritic Moon and terrestrial standards is only 6 ppm, this can be explained by Sm/Nd fractionation as late as 120 Ma after the origin of the solar system without increasing ɛ143Nd in the depleted mantle above +5.5 (Fig. 8). From an elemental point of view this fractionation event must still be of the same magnitude as that proposed by Boyet & Carlson (Reference Boyet and Carlson2005), but the 142Nd signature of the enriched reservoir is three times less extreme. Hence, the isotopic signature of this source would be difficult to detect above the analytical noise of 142Nd ocean island basalt (OIB) signals (Andreasen et al. Reference Andreasen, Sharma, Subbarao and Viladkar2008; Murphy et al. Reference Murphy, Brandon, Debaille, Burgess and Ballentine2010; Jackson & Carlson, Reference Jackson and Carlson2012).
Over the years, several models of very early terrestrial differentiation have been constructed to solve a variety of geochemical problems. One of the first was proposed by Chase & Patchett (Reference Chase and Patchett1988), who invoked the subduction and storage of early mafic crust to explain the consistently positive ɛ Nd values of Early Archaean igneous rocks. Supracrustal suites such as Isua seem to have average ɛ Nd values around +2 (Fig. 5), implying Early Archaean mantle more depleted than predicted by the model of DePaolo (Reference DePaolo1981). By invoking very early extraction of the enriched reservoir and some later re-mixing into the overlying mantle, the model of Chase & Patchett buffered the ɛ Nd value of the depleted mantle through most of Archaean time.
Tolstikhin & Hofmann (Reference Tolstikhin and Hofmann2005) provided a mechanistic basis for the separation of an early enriched reservoir by proposing that subduction and storage of early mafic crust was enhanced by the accumulation of a layer of dense Fe-rich regolith, created by the early heavy meteorite bombardment. They proposed that this material was stored at the core–mantle boundary, generating the D″ layer identified from geophysical evidence (e.g. Wen et al. Reference Wen, Silver, James and Kuehnel2001).
A third variant of the early deep mantle storage model was proposed by Nebel et al. (Reference Nebel, van Westrenen, Vroon, Wille and Raith2010), who argued that crystallization of the global magma ocean could have produced dense Fe-rich rocks similar to ferrodiorite that were enriched in Nb/Ta, thus explaining the anomalously low Nb/Ta ratio of the depleted mantle. The expected Fe-enrichment of subducted proto-crust can also explain the low Fe content of the Earth's upper mantle (Meier, Reufer & Weiler, Reference Meier, Reufer and Weiler2014), without positing a separate origin for the lunar and terrestrial mantles.
The ‘regolith’ and ‘ferrodiorite’ models can be additive, in the sense that they would reinforce each other's effectiveness in storing an early high-density enriched component. However, the significant aspect of the Chondritic Moon model is that it provides tighter constraints on the timing of this extraction process. The predicted +5.5 ɛ143Nd value caused by Sm/Nd fractionation after 120 Ma is consistent with the ‘focus zone’ end-member (FOZO) of mantle isotope trends proposed by Hart et al. (Reference Hart, Hauri, Oschmann and Whitehead1992). It gives scope for additional mantle depletion due to the extraction of continental crust and recycled OIB sources, but implies that these ongoing extraction processes only contributed about 50% of total mantle depletion (Tolstikhin, Kramers & Hofmann, Reference Tolstikhin, Kramers and Hofmann2006). Because this 50% depletion was spread spatially over most of the remaining mantle, it generated a more homogeneous non-enriched reservoir than the early box models indicated. This fits with geophysical evidence for whole-mantle convection, and explains why the upper mantle sampled by subduction-related magmatism can be attributed to a relatively well-mixed evolving DM source (Fig. 5).
7. Comparison with Martian data
The Chondritic Moon model can be tested by comparison with Mars, as sampled by SNC-type meteorites. Mars has been geologically active for much longer than the Moon (Nyquist et al. Reference Nyquist, Bogard, Shih, Greshake, Stöffler and Eugster2001), so its isotope systematics are more complex. The shergottites have much younger igneous crystallization ages (165 to 575 Ma), compared with Chassigny and the nakhlites (1270 to 1360 Ma), but the shergottite source appears to have had a simpler geological history. 142Nd signatures in most shergottites (Caro & Bourdon, Reference Caro and Bourdon2010) define an isochron on the Nd–Nd pseudochron plot (open circles in Fig. 9), whose slope yields an age of 40 Ma after solar system formation, interpreted as dating the crystallization of a Martian magma ocean produced by heating from short-lived extinct nuclides.
142Nd pseudochron plot for Martian meteorites in comparison with lunar data available prior to 2010. Dotted line – solar system initial isochron. Modified after Caro & Bourdon (Reference Caro and Bourdon2010).

142Nd in these samples also correlates with tungsten isotope ratios, which give an estimated age of core formation of 12 Ma after solar system condensation (Foley et al. Reference Foley, Wadhwa, Borg, Janney, Hines and Grove2005). Although these systems are dating different events in the early history of Mars, their relatively good agreement suggests that the shergottite source remained relatively undisturbed over the history of Mars. In contrast, nakhlites (open squares in Fig. 9) fall to the left of the solar system initial composition (dotted line in Fig. 9), implying an impossible negative age. These compositions are attributed to Sm/Nd fractionation after 142Nd became extinct (Caro et al. Reference Caro, Bourdon, Halliday and Quitte2008), and cannot yield meaningful age information.
The best estimate for the 142Nd signature of Mars at a chondritic Sm/Nd value (c. −8 ppm) falls well within error of the lunar composition (Fig. 9). In contrast, the Martian and lunar regression lines in Figure 9 do not coincide at a terrestrial 142Nd signature (ɛ142Nd = 0), but cross the zero 142Nd line at different Sm/Nd ratios. Thus, the best available data for Mars support the Chondritic Moon model.
8. Conclusions
Because it sampled the mantle of the very early Earth, the Moon offers key evidence that can point to a solution of the 142Nd conundrum. The −6 ppm 142Nd signature of the Moon (at a chondritic Sm/Nd ratio) is very close to that of enstatite chondrites. Therefore, the Earth–Moon system could have been derived from this type of material with minimal elemental Sm/Nd fractionation during accretion. This can explain the apparent chondritic Sm/Nd signature of the Bulk Moon. However, the +6 ppm 142Nd signature of the accessible Earth relative to the Moon requires elemental Sm/Nd fractionation in the very early post-impact Earth, which can be attributed to extraction of an early incompatible-element enriched proto-crust from the impact-produced terrestrial magma ocean.
This early enriched component must have been stored at the base of the mantle and never substantially re-sampled, as proposed by Boyet & Carlson (Reference Boyet and Carlson2005). However, because its 142Nd enrichment can be less than a third of that originally proposed, any 142Nd anomalies in modern OIB will be at the limits of resolution of current analytical techniques. The depleted mantle generated by this early Sm/Nd fractionation event would have evolved along a trajectory similar to FOZO that is less extreme than the proposed SCHEM source. However, because this mantle is more LIL-depleted than the chondritic source, it requires that the residue of existing and subducted crustal extraction over Earth history involved most of the mantle. This is consistent with whole-mantle convection, as implied by geophysical data, and therefore generates a unified account of Earth's evolution.
Acknowledgements
The author is very grateful to two anonymous reviewers for their constructive criticisms that led to significant improvements in this paper.