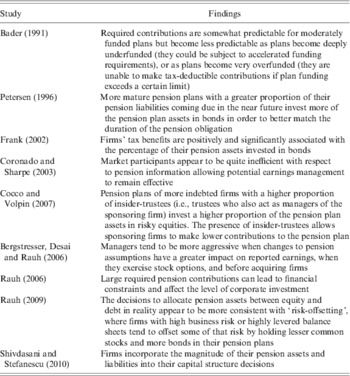
1 Introduction
Defined benefit (DB)Footnote 1 pension plans today look less secure than a decade ago. The recent failures of the biggest US automakers have highlighted the impact of large unfunded pension liabilitiesFootnote 2. As the total amount of US retirement assets in corporate DB plans was over US$ two trillion as of December 2008Footnote 3, there is a growing concern about historically low funding levels, and policymakers are calling for reform of the institutional framework. In this context, understanding the determinants of DB pension plan risk-taking is of critical importance. While recent papers have examined the pension plans of publicly-traded companies, about 90% of the firms that file annual reports with the IRS for their DB pension plan are privately held. Although these plans cover more than 60% of all DB beneficiaries, little is known about their risk-taking. This paper examines empirically the effect of the asset–liability structure and other pension plan and sponsor characteristics on the risk-taking of both types of pension plans. We find evidence of economically significant differences in the risk-taking of pension plans sponsored by private firms versus publicly-traded companies. The investment risk-taking increases with the funded status of pension liabilities and this effect is almost twice as high for plans with publicly-traded sponsors as for plans with private sponsors. In contrast, the effect of sponsor contributions on risk-taking for private sponsors is more than four times higher than for public sponsors.
To further examine the correlation between risk-taking and pension plan characteristics, we ask whether it is more likely for pension funding levels and contributions to affect risk-taking, or conversely for risk-taking to affect the asset–liability structure of the planFootnote 4. We analyze the direction of causality by examining the lead–lag relationship between the potentially endogenous variablesFootnote 5. In our cross-sectional and panel data regressions, we use instrumental variables to account for endogeneity. Overall, our results suggest that funding levels and contributions are important determinants of plan risk-taking and that sponsor ownership has an important effect on this relationship.
Our results are consistent with the evidence in Coronado and Sharpe (Reference Coronado and Sharpe2003), Franzoni and Marin (Reference Franzoni and Marin2006)and Bergstresser et al. (Reference Bergstresser, Desai and Rauh2006)Footnote 6. Coronado and Sharpe (Reference Coronado and Sharpe2003)show that investors did not ‘pierce the veil’ of pension accounting during the 1990s. Franzoni and Marin (Reference Franzoni and Marin2006)and Picconi (Reference Picconi2006)also find that market participants appear to be quite inefficient with respect to pension information, allowing potential earnings management to remain effective. Managerial compensation in public sponsors depends on stock price performance, which is linked to pension plan performance through reported earnings. Pension plan risk-taking is one tool that managers of public firms can use to manage reported earnings, while the incentive to manage earnings in order to manipulate shareholders is absent for private firms.
Considering the interest of employee-beneficiaries, pensions are a more important part of the fixed compensation (DB plan benefits are not performance-based) of managers for firms that pay relatively low salaries. Gao et al. (Reference Gao, Kai and Lemmon2010)offer evidence that private firms tend to pay lower managerial salaries than publicly-traded ones, so private sponsors have incentive to manage their pension plans more conservatively than public sponsors. This incentive is even stronger for firms where managers have substantial ownership stake, because a low-risk pension plan can lower the total risk exposure of owner-managers who are not well diversified. Holderness (Reference Holderness2009)offers robust evidence that ownership is more concentrated for smaller firms than for large ones. Since privately-held firms tend to be smaller than public ones, private sponsors would tend to have more concentrated managerial ownership and their pension plan managers would have incentives for lower risk-taking than the managers of plans with publicly-traded sponsors.
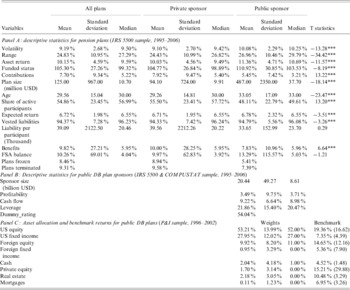
The conventional theoretical arguments for the optimal pension-plan risk-taking have ignored the distinction between plans with private versus publicly-traded sponsors and their different managerial incentives, and these theories have produced conflicting predictions about both high and low optimal risk-taking (e.g., Sharpe (Reference Sharpe1976), Treynor (Reference Treynor1977), Black (Reference Black1980), Harrison and Sharpe (Reference Michael Harrison, Sharpe, Bodie and Shoven1983); see below). This paper offers empirical evidence that there are economically significant differences between risk-taking of plans with private and public sponsors and highlights the need for further theoretical extensions. Panel A of Table 1 illustrates the importance of the sponsor's ownership in a simple way: the annual volatility of pension plan returns for publicly-traded sponsors on average is about 10% higher than the volatility of plans sponsored by privately-held firms. We hope that future research will produce an encompassing interpretation of our results within a theoretical framework that takes into account the effect of ownership structure on the incentives of managers and employee-beneficiaries.
Descriptive statistics for US DB pension plan and their sponsors

The main focus of existing models like the ones mentioned above, as well as their empirical tests (see below) has been on the asset allocation decision between debt (the low risk asset class) and equity (the high risk asset class). Previous empirical studies have examined the debt–equity ratio of pension plans with publicly traded sponsorsFootnote 7, in part due to lack of detailed data on pension plan asset allocationsFootnote 8. The evidence for a relationship between pension funded status and debt–equity asset allocation of public sponsors’ pension plans is mixedFootnote 9.
In this paper, we take a new approach and instead of debt–equity ratios, we examine three measures of pension plan total risk-taking; the volatility of realized pension plan returns, the range of realized returns and the volatility of pension plan asset allocation mix. The main advantage of our approach is that we are able to estimate the risk-taking for plans sponsored by private firms, without having to rely on asset allocation data, which are not available for these plans. Moreover, using the realized volatility or the range of realized returns as a measure of total risk captures the portfolio risk of all asset classes and investment styles, as well as the effect of portfolio re-balancing. Prior studies that have used book leverage have abstracted from differences in investment styles, and from asset classes other than debt and equity, like alternative investments, that provide diversification and hedging benefits. The importance of such asset classes has increased as capital markets have become more globalized and institutional investors have become more sophisticatedFootnote 10.
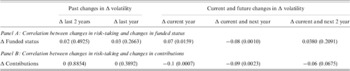
We show that the changes in funded status and sponsor's contributions are positively related to the future changes in risk-taking, but unrelated to the past changes in risk-taking, indicating that it is more likely that risk-taking is determined by plans’ funding levels and sponsor contributions, than vice versa. The relationship between risk-taking and a plan's asset–liability characteristics remains robust when we use IV regressions to account for endogeneity and control for both unobservable and observable characteristics.
Our first set of regression results examines the relationship between pension plan risk-taking and its asset–liability structure, and the effect of the sponsor's ownership on this relationship. We find that there is economically significant difference in the magnitude of investment risk for plans with public versus private sponsors. In addition, the effect of the pension liabilities funded status on the risk-taking is stronger for plans sponsored by publicly-traded firms, while it is the contributions that are more important for the risk-taking of plans with privately held sponsors.
Our interpretation of these results is that access to external financing and possible cash constraints are relatively more important for private firms than for public ones, as pension contributions can reduce investment spending and other corporate expenses. The managers of publicly traded sponsors, on the other hand, pay more attention to the funded status of pension liabilities, as this is often taken into account by equity analysts and credit rating agencies. In addition, managerial compensation in public sponsors depends on stock price performance, which is linked to pension plan funding levels through reported earnings.
Our second set of results documents the relationship between pension plan risk-taking and sponsoring firm characteristics. We consider the endogenous choice of ownership for the sponsoring firms and we control for omitted variables bias. Our finding that funded status is an important determinant of risk-taking for public firms remains robust. When we analyze the subset of plans with publicly traded sponsors we also find that lower leverage and higher credit rating are associated with higher pension plan investment risk. These results are consistent with risk-management practices proposed in the literature (see below).
Our final set of results examines the conditional risk-taking of pension plans of publicly-traded sponsors, taking into account time-varying asset–liability structures and the changing investment opportunity set. We examine in a panel dataset the realized volatility of daily returns of benchmark portfolios constructed using the pension plan asset-class holdings and the returns on an index for every asset class. The results confirm our finding that relatively better funded plans take on more risk over time. However, increases in contributions do not have an effect on the conditional risk-taking of plans with publicly traded sponsors.
Our findings contribute to the literature in two ways. First, we document a novel economically significant difference in pension-plan risk-taking for privately-held versus publicly-traded sponsoring firms. Our second contribution is to assess the empirical support for alternative theoretical models that exist in the literature. Our results suggest the need for a broad interpretation of the previous findings within the incentive-theoretical paradigm that takes into account the multiple stake-holders in the firm and its pension plan. Existing studies that have adopted the conventional framework have focused on two-party agency problems, like the owner–manager, owner–employee, or manager–employee diverging interests or incentive alignment. While all of these are relevant, the private–public ownership dichotomy highlights the multiple roles of agents (managers are beneficiaries and can be partial owners) and shows that they have different weights for private and public firms.
Section 2 provides a brief overview of the related literature. Section 3 describes the data and section 4 details our research methodology. Section 5 contains the empirical results. The last section concludes.
2 Background
DB pension plans create complex contracting relationships between shareholders, managers, and past and current employee-beneficiaries. Agency costs arise for DB pension plans due to conflicts of interest between the stakeholders of the pension contract. Much of the existing literature focuses on the agency costs in the form of moral hazard risk-shifting incentives for sponsors. These agency costs are exacerbated when a government agency provides pension liability insurance in case of sponsor's default. Harrison and Sharpe (Reference Michael Harrison, Sharpe, Bodie and Shoven1983)argue that the existence of the Pension Benefit Guarantee Corporation (PBGC), together with the limited tax deductibility of overfunded US DB plans, implies that their asset allocation and funding decisions are jointly determined and extreme, with a U-shaped relationship between the funded status of the pension plan and the riskiness of its assets.
To protect the interests of pension beneficiaries and to limit agency risks, pension regulators require that DB pension plans are set up in trusts, and that specific disclosure, fiduciary and diversification standards are metFootnote 11. However, current corporate governance practices often fail to ensure that pension funds are run in the best interest of the pension beneficiaries. Cocco and Volpin (Reference Cocco and Volpin2007)find that pension plans of more indebted firms with a higher proportion of insider-trustees (i.e., trustees who also act as managers of the sponsoring firm) invest a higher proportion of the pension plan assets in risky equities. This evidence suggests that such firms maximize the value of their put option and shift risk to the pension plan beneficiaries. Also consistent with a risk-shifting effect, Cocco and Volpin show that the presence of insider-trustees allows sponsoring firms to make lower contributions to the pension plan.
Theoretical reasons also explain why the risk in the pension fund might optimally decrease when its funded status deteriorates. Bader (Reference Bader1991)argues that firms attempt to minimize the volatility of their pension contributions. These contributions are often predictable for moderately underfunded or overfunded plans, but less predictable when funding levels become more extreme. Bader's argument suggests an inverted U-shape relationship between funding and equity investment where extremely overfunded and underfunded plans invest in fixed income securities and only moderately funded plans should increase their allocation to equity investment. Rauh (Reference Rauh2009)also documents that risk management incentives to avoid costly financial distress dominate risk shifting, whereby shareholders maximize the value of their put option. His empirical findings show that the better funded US pension plans in his sample – which should have less incentives to engage in excessive risk-taking – in fact invest more in risky equity. Campbell and Viceira (Reference Campbell, Viceira, Clark, Munnell and Orszag2006)suggest that firms may choose to invest in riskier assets if they want to offer access to alternative investments, which may not be available to individual investors. Alternatively, equity investing may hedge against increases in real wages if future earnings growth and stock returns are positively correlated (Lucas and Zeldes, Reference Lucas and Zeldes2006). Bergstresser et al. (Reference Bergstresser, Desai and Rauh2006)consider reporting regulations and show that the impact of risky pension investments on earnings creates an incentive to increase the volatility of the pension planFootnote 12.
Recently, several studies have considered the effect of pension contributions on corporate policies. Shivdasani and Stefanescu (Reference Shivdasani and Stefanescu2010)point out that pension obligation are more senior to payments on debt and therefore pension contributions can have a significant impact on a company's marginal tax rate for debt financing. They show that firms with DB plans realize substantial tax benefits from pension contributions and that the existence of such a pension plan significantly lowers the extent to which firms can afford to take on additional leverage. Rauh (Reference Rauh2006)also shows that a sponsor's investment expenditures decrease when firms make cash contributions to their underfunded DB pension plans.
Finally, our study is related to the literature on corporate risk-taking and ownership. There exist theoretical arguments for both positive and negative relationship between firms’ risk-taking and their ownership. On the one hand, agency theory suggests that large shareholders who enjoy cash flow and control benefits from the companies they manage have greater incentives to increase firm value by investing in risky projects. On the other hand, diversification arguments suggest that if large shareholders have their wealth concentrated in a single firm, they may be less willing to undertake risky projects than if they owned a diversified portfolio of firms.
Consistent with our results, there is empirical evidence that concentrated ownership decreases the incentives for corporate risk-taking. For example, Wright et al. (Reference Wright, Ferrris and Awasthi1996)do not find support for the hypothesis that institutional owners have a significant and positive influence on risk-taking because of their incentive to increase firm value through more risky projects, and John et al. (Reference John, Litov and Yeung2008)argue that private benefits are important to large shareholders and therefore they are only willing to take on conservative projects. Barry et al. (Reference Barry, Lepetit and Tarazi2011) show that ownership structure is significant in explaining risk differences between public- and privately-owned banks. A higher equity stake of either individuals/families or banking institutions is associated with a decrease in asset risk and default risk. On the other hand, Laeven and Levine (Reference Laeven and Levine2009)document a positive relationship between risk-taking and shareholder powers for U.S. banks. Our paper offers additional empirical evidence related to the role of ownership structure in corporate risk-taking.
3 Research design
We estimate cross-sectional and panel regressions and we report both OLS and IV estimation results. Our IV regressions take into account the endogeneity of some of the pension plan characteristics and the plan's investment risk. Since many of the sponsoring companies have more than one pension plan, we cluster the standard errors by sponsor in all specifications where the unit of observation is the individual plan.
3.1 Cross-sectional regressions
In our first set of cross-sectional results, we examine the relationship between a proxy for the risk-taking and ownership:
 $$\eqalign{ \tab {{Risk \minus taking_{ij} \equals \sum {\beta _{{\rm \setnum{0}\comma }t} D_{t} } \plus \beta _{\rm \setnum{1}} PubliclyTraded_{j} \plus \beta _{\rm \setnum{2}} FundedStatus_{ij} \plus }}\beta _{\rm \setnum{3}} Contributions_{ij} \cr \tab \hskip70pt \plus \beta _{\rm \setnum{4}} Vested_{ij} \plus \beta _{\rm \setnum{5}} Benefits_{ij} \plus \beta _{\rm \setnum{6}} Age_{ij} \cr\tab \hskip70pt \plus \beta _{\setnum{7}} ActiveParticipants_{ij} \plus Controls_{ij} \plus e_{ij}} $$
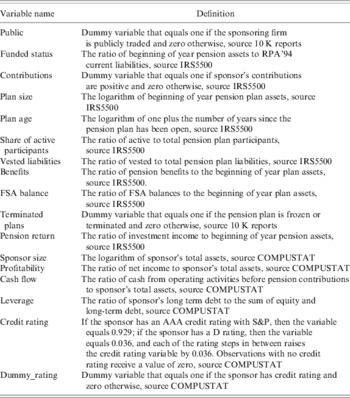
where our two measures of risk-taking are either Volatilityij or Rangeij. The first one, Volatilityij is the standard deviation of the returns on the beginning of year pension plan assets for plan i of sponsor j computed when at least five (year) observations are available, i.e.,  ${\sigma _{ij} \equals \sqrt {{{\rm 1} \over {T \minus {\rm 1}}}\sum {\left( {r_{ij\comma t} \minus {{\rm 1} \over T}\sum {r_{ij\comma t} } } \right)^{\rm \setnum{2}} } } \vert T\geqslant {\rm 5}}\comma {{\rm 1} \over T}\sum {r_{ij\comma t} } \geqslant r_{risk \minus free} $, where rij,t is the annual plan return for plan i of sponsor j in year t, calculated using data from the IRS form 5500 and defined as investment income divided by beginning-of-year pension assets. The second measure, Rangeij is the difference between the maximum and minimum returns for plan i of sponsor j computed when at least five (year) observations are available, i.e., Δrij = (max(rij,t) − min(rij,t))|T ≥ 5. The main advantage of the range measure is that it does not require an estimate (potentially very noisy) of the expected return of the plan.
The main explanatory variables of interest are: first, the PubliclyTradedj indicator variable equals one if sponsor j is a publicly traded company and zero otherwise; FundedStatusij, which is calculated as the sample mean of the ratio of plan assets to liabilities based on the beginning-of-year assets and the RPA’94 current liabilitiesFootnote 13 reported in the 5500 forms; and Contributionsij, which is a dummy variable that equals one if sponsor's contribution is positive and zero otherwiseFootnote 14.
Petersen (Reference Petersen, Fernandez, Turner and Hinz1996)provides evidence that more mature pension plans, with a greater proportion of the pension liabilities coming due in the near future, invest more of the pension plan assets in bonds in order to better match the duration of the pension obligation. The variables Vestedij, Benefitsij and Ageij measure the duration of pension plan's liabilities. They are calculated as follows. The plan Ageij is measured as the log of one plus the plan age in years. The variable Vestedij is the percentage of the RPA ’94 current liability vested and Benefitsij is the benefit payments made by pension plan i of sponsor firm j divided by the average pension plan assets. Finally, the share of ActiveParticipantsij is a proxy for hedging demand by sponsors who hedge future wage growth as in Sundaresan and Zapatero (Reference Sundaresan and Zapatero1997)and Lucas and Zeldes (Reference Lucas and Zeldes2006).
The controls include the plan Sizeij measured as the log of plan assets at the beginning of the year, and the net FSA balances (scaled by beginning of year assets)Footnote 15. Current ERISA and IRC funding rules for DB pension plans permit sponsors of underfunded plans with FSA credit balances to forgo making contributions, even for severely underfunded plans. Comprix and Muller (Reference Comprix and Muller2006)show that pension plans with high net FSA balances take higher investment risk. Finally, we include a dummy variable that equals one if the ith plan was terminated during the sample period and zero otherwise. Because of differences in the level of market movements across years, we include year-effects, an indicator Dt that equals one if the data from that year was used to calculate that observation and zero otherwise.
Next, we examine the interactions of sponsor's ownership type with the other theoretically-motivated variables to determine empirically if the ownership type is relevant for existing theories (see discussion below). Our cross-sectional regression has the specification:
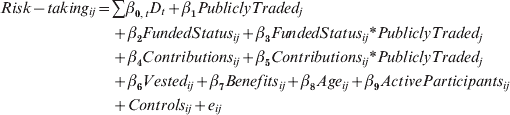 $${\eqalign{Risk \minus taking_{ij} \equals \tab \sum {\beta _{{\rm \setnum{0}\comma }t} D_{t} } \plus \beta _{\rm \setnum{1}} PubliclyTraded_{j} \cr\tab \plus \beta _{\rm \setnum{2}} FundedStatus_{ij} \plus \beta _{\rm \setnum{3}} FundedStatus_{ij} \ast PubliclyTraded_{j} \cr \tab \plus \beta _{\rm \setnum{4}} Contributions_{ij} \plus \beta _{\rm \setnum{5}} Contributions_{ij} \ast PubliclyTraded_{j} \cr\tab \plus \beta _{\rm \setnum{6}} Vested_{ij} \plus \beta _{\rm \setnum{7}} Benefits_{ij} \plus \beta _{\setnum{8}} Age_{ij} \plus \beta _{\rm \setnum{9}} ActiveParticipants_{ij} \cr\tab\plus Controls_{ij} \plus e_{ij} \cr} }$$
We test whether the funded status of a pension plan has significant effect on the risk-taking by testing the hypothesis that β2 ≠ 0. In particular, the literature (e.g., see Rauh Reference Rauh2009), has proposed alternative explanations, and we test for risk-shifting, β2 < 0, versus risk-management, β2 > 0. The hypothesis that pension plan managers minimize the contributions of the plan sponsor implies that we expect to find a significant coefficient β4 < 0. The literature (see, e.g., Petersen (Reference Petersen, Fernandez, Turner and Hinz1996)) also suggests that shorter duration of pension liabilities on average implies lower risk-taking, and if any of the individual hypotheses β6 = 0, β7 = 0 and β8 = 0 are rejected, then we expect to find β6 < 0, β7 < 0 and β8 < 0 respectively. The hypothesis that employers hedge future wage growth of their employees, as suggested in Sundaresan and Zapatero (Reference Sundaresan and Zapatero1997)and Lucas and Zeldes (Reference Lucas and Zeldes2006), is tested for β9≠0, and if this coefficient is significant, we expect to find β9 > 0.
Finally, we expect that there is a significant difference between publicly-held and privately-held sponsor's plans, due to different managerial incentives to manipulate earnings. Any evidence of significant coefficients on interaction terms with ownership can be interpreted to indicate that there are important differences in incentives for pension plan risk-taking between private and public sponsors.
3.2 Public sponsor characteristics
We consider the sub-sample of publicly traded sponsors. Equation (1) is modified to include sponsor's characteristics:
 $$\eqalign{ Volatility_{ij} \equals \tab \sum {\beta _{{\rm \setnum{0}\comma t}} D_{t} } \plus \beta _{\rm \setnum{1}} Funded_{ij} \plus \beta _{\rm \setnum{2}} Contributions_{ij} \plus \beta _{\rm \setnum{3}} Vested_{ij} \plus \beta _{\rm \setnum{4}} Benefits_{ij} \cr \tab \plus \beta _{\rm \setnum{5}} Age_{ij} \plus \beta _{\setnum{6}} ActiveParticipants_{ij} \plus \beta _{\rm \setnum{7}} CashFlow_{j} \plus \beta _{\rm \setnum{8}} CreditRating_{j} \cr\tab\plus Controls \plus e_{ij} \cr} $$
Friedman (Reference Friedman, Bodie and Shoven1983), Petersen (Reference Petersen, Fernandez, Turner and Hinz1996), Frank (Reference Frank2002)and Comprix and Muller (Reference Comprix and Muller2006)provide evidence that sponsors offset their (non-pension) business risk by reducing the investment risk of the pension plan assets. We include CreditRatingj to capture this incentive. We expect CreditRating to be positively associated with risk-taking, consistent with sponsors with lower business risk-taking on relatively higher investment risk with their pension plan assetsFootnote 16.
Petersen (Reference Petersen1992)provides evidence that sponsors’ ability to generate funds internally influences the operation of DB plans. He finds that sponsor firms’ inability to generate resources internally result in reduced plan contributions, more favorable actuarial assumptions to reduce required cash contributions, and in extreme cases, termination of overfunded pension plans. We include CashFlowj, calculated as cash flow from operations divided by total assets, to capture the ability of sponsor firms to generate resources internally. We expect risk-taking and CashFlow to be positively associated for sponsors that manage liquidity risk, as in Petersen (Reference Petersen1992). Finally, in addition to the pension plan controls we include sponsors’ controls. These are the sponsor's size and leverage.
In our first three sets of tests, we examine the differences in the volatility of individual pension plans computed using between five and twelve observations for each plan. We cannot calculate annualized variance of return estimates computed using higher frequency data since only annual return data for DB pension plans are available from the IRS5500 formsFootnote 17. Our panel regressions below use our third measure of risk-taking, the realized volatility of daily asset-class benchmark returns.
3.3 Public sponsor panel regressions
The final set of results reports estimates from panel regressions of the annualized conditional volatility of daily returns on the pension plans’ asset-allocation benchmark portfolio on funded status, and other explanatory variables and controls. The panel regression has the following specification:
 $$\eqalign{ Volatility_{jt} \equals \tab \beta _{\rm \setnum{0}} \plus \beta _{\rm \setnum{1}} Funded_{j\comma t \minus \setnum{1}} \plus \beta _{\rm \setnum{2}} Contributions_{j\comma t \minus \setnum{1}} \plus \beta _{\rm \setnum{3}} Vested_{j\comma t \minus \setnum{1}} \cr \tab \plus \beta _{\rm \setnum{5}} Benefits_{j\comma t \minus \setnum{1}}\plus \beta _{\rm \setnum{6}} Age_{j\comma t \minus \setnum{1}} \plus \beta _{\setnum{7}} ActivePartcpant_{j\comma t \minus \setnum{1}} \cr \tab \plus \beta _{\rm \setnum{8}} CashFlow_{j\comma t \minus \setnum{1}} \plus \beta _{\rm \setnum{9}} CreditRating_{j\comma t \minus \setnum{1}} \plus Controls \plus e_{jt} \cr} $$
Our measure of risk (Volatilityjt) is the year t annualized volatility of daily returns on a portfolio invested in benchmark indexes with portfolio weights the jth sponsor's asset-class holdings, i.e.,  ${\sigma _{jt} \equals \sqrt {\omega {\prime}_{j} \Sigma _{t} \omega } {}_{j}}$ where ωj is a (k × 1) vector of portfolio weights for the jth sponsor and Σt is the time t annualized covariance matrix of daily benchmark return for k asset classes. The main explanatory variable of interest is FundingStatus j,t − 1, which is now calculated as the ratio of plan assets to liabilities based on the beginning-of-year assets and liabilities. The controls include the plan Sizejt, which is measured as the log of plan assets and the sponsor leverage. All specifications include time dummies and fixed effects or industry effects.
As before, we test the null hypothesis that the funded status of a pension plan has significant effect on the risk-taking, β1≠0, with alternatives for risk-shifting, β1 < 0, versus risk-management, β1 > 0. Next, the hypothesis that pension plan managers minimize the contributions of the plan sponsor implies a significant coefficient β2 < 0. Similarly, the hypotheses that longer duration of the pension liabilities is associated with higher risk-taking and that sponsors hedge future wages growth, etc. imply that we expect to find significant coefficients with signs as discussed above.
4 Data
We use four sources of data for this study. Corporate pension plans with more than 100 participants are required to file annually a Form 5500 with the IRS. We restrict our sample to sponsor firms’ fiscal years ending 1995 to 2006. This time-period is advantageous to the testing of our hypotheses as no major regulatory changes were made to the funding rules for DB pension plansFootnote 18. For private sponsors, we obtain sponsor characteristics from ORBIS BVDFootnote 19 using the sponsor's name and employer identification number (EIN), for the period 2000–2006. For publicly traded sponsors, we link the sponsors of each pension plan indicated on the Form 5500 filing with firms on COMPUSTAT using the sponsor's name and EIN.
Our IRS Form 5500 sample of plan-level data consists of 138,954 observations on 20,849 DB pension plans (unique sponsor EIN and plan number) and 15,700 sponsoring companies (unique EIN) for the period 1995–2006. Table 1 shows descriptive statistics for our sample.
Panel A of the table shows that on average, the annualized volatility of pension plan returns was 9.2% and the average fund in our sample was overfunded at 105.3% ratio of assets to liabilities. The average fund has 125 million in pension assets, but the distribution is skewed and the large standard deviation is driven by very large funds. Note that most of the pension plans in our IRS 5500 sample, about 92%, are plans with privately-held sponsors. 2,016 funds were frozen during the sample period and 1,764 were terminated. On average about 55% of plan participants were active, the benefits paid were 9.82% of beginning of year assets, 94.37% of liabilities were vested.
On average the pension plans sponsored by publicly traded firms are larger and older than those sponsored by private firms. They have a smaller share of active members, better funded status, lower employer contributions to assets ratio and higher return and volatility than plans with private sponsors. There is no statistically significant difference in the means of the liability per capita for the plans of public and privately held sponsors and although the difference in the means of the assumed expected rate of return is significant, there is no difference in the medians at any conventional statistical levelFootnote 20. Overall, the table shows that there are important differences in the structure of pension liabilities for the plans of public versus privately held sponsors. We examine this issue in a regression context in the next section.
When we match the pension data obtained from the 5500 forms with ORBIS BVD data for the period 2000–2006, we obtain sponsor characteristics for 4,641 pension plans for 2,486 privately-held sponsors and 846 public sponsors. We also combine the pension data obtained from the 5500 forms with COMPUSTAT data for the sub sample of 1,825 publicly traded sponsors for the same period. Panel B of Table 1 shows descriptive statistics for the publicly-traded sponsors in our matched sample. The table shows that the average sponsor has 20.44 billion in assets and on average operating cash flow is 9.1% of asset. 56% of the sample sponsors have credit rating.
Finally, we link the pension data obtained from the 5500 forms to asset allocation data for the largest 1,000 US pension funds from the annual Pensions and Investments survey for the period 1996–2002. Matching the data by sponsor name provides 355 corporate plans that have at least one year of matching data. Panel C of Table 1 reports summary statistics for the asset allocations of plans.
The table shows that the main driver of the total volatility for the largest US corporate pension plans is the equity asset class with an average allocation of 63% of assets. US equity on average represents 53% of pension assets and US fixed income on average represents 28% of pension assets. The alternative asset classes represent a small fraction of the average portfolio.
For our panel regressions, we calculate returns for benchmark portfolios with portfolio weights the actual sponsors’ pension asset allocation. The benchmarks used are as followsFootnote 21:
• S&P 500 for domestic equity investment returns;
• MSCI EAFE for international equity investment returns;
• Barclay's US Aggregate Bond Index for domestic fixed income investment returns;
• Barclay's Global Bond Index for global fixed income investment returns;
• 13-month T-bill yield for money market investment returns;
• NCREIF Property Index for real estate investment returns;
• Venture Economics Private Equity index for private equity returns;
• Barclay's MBS Index for returns from mortgage investments;
Panel C of Table 1 reports the average annual return for each benchmark and the average pension asset allocation weight for each asset class for our sample period 1996–2002. We calculate the annualized daily volatilityFootnote 22 of the asset-allocation benchmark portfolios for each year in our panel and use it as our measure of risk in specification (4)Footnote 23. We now turn to the empirical results.
5 Results
5.1 Correlation analysis
We start our analysis by examining the correlation between the change in volatility and the changes in pension liabilities funded status and sponsor contributions. There are arguments that the causality might run both ways. It is a well-documented fact that as funding levels improve, pension plans increase the riskiness of their asset allocation (Rauh, Reference Rauh2009). However, it is also possible that pension plans increase the riskiness of their investment to avoid underfunding and higher contributions. A simple way to differentiate between these two opposing predictions is to see whether the change in volatility leads the change in funded status and contributions, or the changes in funded status and contributions lead the change in volatility.
Table 2 shows the correlation between the change in the funded status and contributions and the past and future changes in annualized daily volatility of the asset-allocation benchmark portfolios for the period 1996–2002. We calculate the change in the funded status and contributions from the previous year and the change in volatility for the last two years, the current year, and the next 2 years.
Correlation analysis

Panel A of Table 2 shows that a change in funded status is not correlated with past changes in volatility. However, a change in funded status is positively correlated with the future changes in volatility, indicating that it is more likely that funding levels affect risk-taking than vice versa. Panel B of Table 2 shows a similar result for contributions. Changes in contributions are not correlated with past changes in volatility. However, changes in contributions are negatively correlated with the future changes in volatility, indicating that it is more probably that contributions affect risk-taking than vice versa.
The next section presents our regression results. We examine the relationship between pension plan characteristics such as funded status and contributions and investment risk and how sponsor's ownership affects this relationship.
5.2 Cross-sectional analysis
Our first set of results analyzes the role of funded status and contributions using the cross-sectional regression specifications (1) and (2). This main focus of this analysis is the distinction between the publicly-traded versus privately held sponsor and its impact on the risk-taking of the pension plan. The results can also be interpreted as tests of several of the above models’ predictions about the relationship between the realized annual volatility of pension plan returns and the funded status of the pension plans. Our analysis allows us to explore whether the ownership status of the sponsor makes a difference for the empirical support of these models.
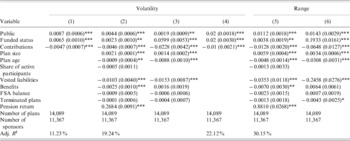
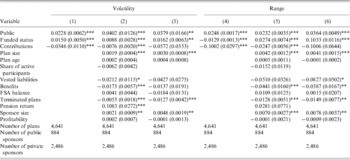
Table 3 summarizes the cross-sectional results for specification (1). Columns (1)–(3) show the regression results when the dependent variable is volatility and columns (4)–(6) report the results when the dependent variable is range. The standard errors reported in the table are clustered by sponsoring firm.
Cross-sectional regression: ownership and risk-taking (IRS 5500 Data, 1995–2006)

The table presents evidence about the effect of sponsor's ownership on the investment risk of its pension plan. The positive coefficient of Public is significant at the one-percent level and the effect of ownership is also economically significant. For example, in the simple specifications without controls (columns (1)–(3) changing the ownership from privately held to publicly traded sponsor increases the volatility by 87 basis points and the range by 240 basis points. These changes are large when compared to the means of the volatility (9.19%) and the range (26.92%).
Consistent with previous studies, we find that funded status has a positive effect on risk-taking whereas contributions have a negative effect. All coefficients are significant at the one percent levelFootnote 24.
Plan age, vested liabilities and benefits all lead to reduced risk-taking with significant negative coefficients at conventional levels. The negative signs of these coefficients are consistent with the above theoretical models of pension liability risk management. For example, high vested liabilities imply lower risk-taking, consistent with interest rate risk management and liability duration matching, as in Petersen (Reference Petersen, Fernandez, Turner and Hinz1996).
Columns (1) and (2), and (4) and (5) report OLS estimates, whereas columns (3) and (6) report 2SLS estimate where returns and share of active participants are used as instruments for funded status and contributionsFootnote 25. Our results remain the same when we account for the possibility of endogeneity between risk-taking and pension plan characteristics.
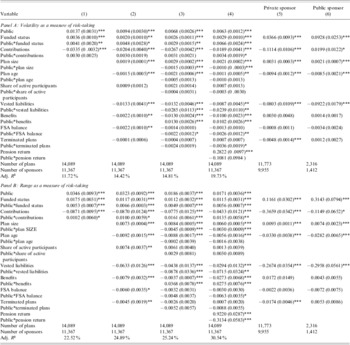
Table 4 summarizes the cross-sectional results for specification (2). Panel A shows the regression results when the dependent variable is volatility and panel B reports the results when the dependent variable is range. The standard errors reported in the table are clustered by sponsoring firm.
Cross-sectional pension plan regression (IRS 5500 Data, 1995–2006)

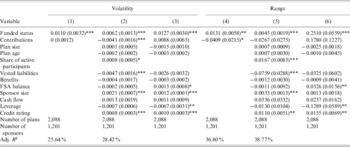
The table shows an economically significant positive effect of funded status for publicly-traded sponsors. The ownership dummy variable (Public) remains positive and statistically significant in all specifications. In addition, in the simple specification without controls, (Panel A, column 1) changing the funded status by one standard deviation around its mean increases the volatility of pension assets by 2.03% for plans with private sponsors. The increase of 4.84% for plans with public companies is almost two and a half times larger than for private sponsors. This difference between public and private sponsors is even stronger in the specifications with control variables. In these regressions, the coefficient of funded status is small whereas the coefficient of the interaction variable (Plublic*Fundedij) remains larger and significantly positive. This result suggests that asset–liability structure is much more important for the risk-taking of pension plans with publicly-traded sponsors. This is a novel empirical result that is not explained by the existing theoretical literature.
The other significant determinant of risk-taking is contributions. The level of contributions is more important for the risk-taking of plans sponsored by private firms. For private firms’ pension plans, the estimated coefficient on Contributions is negative and significant at the one percent level, while this coefficient is much smaller or not significant for plans with public sponsoring firms. These results can be interpreted to indicate that access to public financial markets and possible cash constraints are relatively more important for private firms, while for public firms, the pension plan managers pay more attention to the funded status of pension liabilities, as this is often taken into account by equity analysts and credit rating agencies. Columns (5) and (6) report the results from 2SLS estimationFootnote 26. The results remain qualitatively the same when we control for endogeneity.
To summarize, the improved funded status is associated with an increase in risk-taking, and this effect is significant for plans with publicly-traded sponsoring firms. The main determinants of pension plan risk-taking are different for public and private firms. The fact that pension liability risk management depends on ownership suggests that theoretical models need to capture how the ownership structure of the sponsor creates different incentives for its pension plan risk-taking.
5.3 Public sponsor characteristics
Our next results are obtained from a more detailed investigation using additional data from the COMPUSTAT database. We characterize the risk-taking of pension plans of publicly-traded sponsors using regression specification (3). These regressions control for sponsor characteristics like size, creditworthiness, leverage, and availability of cash. Table 5 reports the cross-sectional regressions with sponsor characteristic controls. The standard errors are clustered by sponsoring firm.
Cross-sectional regression for publicly traded sponsors (IRS 5500 & COMPUSTAT Data, 1995–2006)

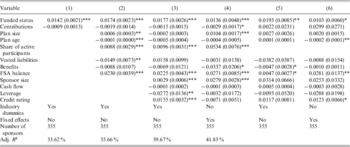
The table shows that for public firms the funded status is the only significant plan specific determinant of pension plan risk-taking once sponsor characteristics are included as explanatory variables. The coefficient on funded status is positive and significant at the one percent level. The contributions coefficient is either not significant or negative and significant at the five and ten-percent levels. One sponsor characteristic, credit rating, has positive coefficient that is significant at the 5% level (columns (2)–(3) and (5)–(6)Footnote 27. This variable is a proxy for the ability of the sponsor to honor its obligations: general creditworthiness implies that an existing pension deficit will not be realized in the near term. These results can be interpreted to indicate the importance of the financial strength of the sponsor and are consistent with the findings of Petersen (Reference Petersen1992).
Overall the results suggest that sponsor characteristics like size, cash-flow, and creditworthiness, tat proxy for financial strength, are positively associated with pension plan risk-taking for publicly-traded sponsoring firms. The finding that financially strong public sponsors take on more risk can be interpreted as market discipline affecting the investment policies of pension plans of publicly-traded firms.
5.4 Conditional volatility panel regressions
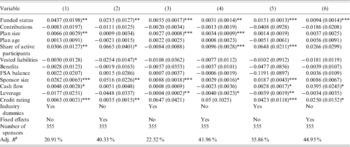
Our fourth set of results characterizes the conditional risk-taking of pension plans using the panel regression specification (4). The asset allocations of the plans are used to construct asset allocation benchmark portfolios from asset-class indexes. The realized conditional volatility of these benchmark portfolios is a proxy for the conditional volatility of the plan. The results on the conditional volatility of pension plan allocation benchmark portfolios are presented in Table 6. We consider specifications with industry controls as well as specifications with fixed effects.
Panel regression for publicly traded sponsors (IRS 5500, COMPUSTAT & P&I Data, 1996–2002)

The table shows that the funded status of pension liabilities remains an important determinant of the conditional risk-taking of pension plans, corroborating the cross-sectional results above. The coefficient of the funded status is positive and significant for all specifications at conventional levels, suggesting that relatively better funded plans take on more risk over timeFootnote 28. Overall, the results are consistent with our cross-sectional analysis and show that for public sponsors, increased risk-taking is driven by improved funded status and by the financial strength of the sponsor. The results once again highlight the importance of sponsor ownership for the relationship between risk-taking and pension plan characteristics.
6 Supplemental analysis
6.1 Endogenous ownership type, risk-taking and sponsor characteristics
In this section, we address the possibility that ownership may be determined by firm and industry characteristics that are correlated with risk-taking, i.e., ownership may be endogenous. For example, the scope for moral hazard may be greater for riskier firms so these firms remain private as their managers should hold greater ownership stakes to align incentives (Demsetz and Lehn, Reference Demsetz and Lehn1985).
In our set up, the endogenous variable is a dummy variable and applying directly 2SLS estimation is not appropriate. Angrist and Pischke (Reference Angrist and Pischke2008)coin this set up ‘the forbidden regression’Footnote 29. In this case, the usual OLS first-stage is only an approximation to the underlying nonlinear model. If we use a nonlinear first stage (for example a Probit model), the forbidden regression in this case is the second stage equation created by plugging in nonlinear fitted values. The problem is that only OLS estimation of the first stage is guaranteed to produce first-stage residuals that are uncorrelated with fitted values and covariates.
Angrist and Pischke (Reference Angrist and Pischke2008)suggest using the nonlinear fitted values as instruments. In general, using fitted values as instruments is the same as plugging in fitted values when the first-stage is estimated by OLS. Nonlinear fits-as-instruments has the further advantage that, if the nonlinear model gives a better approximation than the linear model, the resulting 2SLS estimates will be more efficient than those using a linear first stage regression.
Firm-level variable such as profitability, growth and size are likely to be correlated with both ownership and firm risk-taking. We use the four-digit SIC industry average Tobin Q as an instrumental variable. Since we cannot observe the Q of private firms, we use an estimate of Q for public companies as a proxyFootnote 30. Industry Q is a market signal of the perceived investment opportunities. Previous studies have argued that firms are more likely to be public when the market valuations in their industry are much higher than valuations in other industries. For example, Pastor and Veronesi (Reference Pastor and Veronesi2005) find that insiders tend to go public after observing improving market conditions and Lowry and Schwert (Reference Lowry and William Schwert2002) show that more firms go public after periods of high underpricingFootnote 31.
We examine the robustness of our results with respect to endogenous choice of ownership. The results of the IV regressions are reported in Table 7.
Cross-sectional regression: ownership endogeneity (IRS 5500 & ORBIS Data, 2000–2006)

The table shows that the ownership remains robust determinants of pension plan risk-taking. In addition, the positive coefficient on funded status and the negative coefficient of Contributions are significant in all regression specifications. The coefficients of the Public interaction variables have the same sign and magnitude to those in Table 4 but they have larger standard error reflecting the smaller sample size. These findings confirm our previous results that for plans with public sponsors, better funding levels are associated with increased plan risk-taking but changes in contributions are important for the investment risk of plans with private sponsorsFootnote 32.
We also address the concerns that our results are driven by fundamental differences between the sample of plans with public sponsors and the sample of plans with private sponsors (e.g., Table 1 shows that these samples differ with respect to size, age, funding, and shares of active participants, i.e., characteristics associated with risk-taking).We performed a propensity score matching procedure where we first calculated propensity scores derived from a probit model where the dependent variable Public ownership dummy variable is regressed on plan characteristics (size, age, funding, and shares of active participants), sponsor characteristics (size, profitability, industry Tobin's Q), and other controls. We then matched each pension plan with private sponsor, one-to-one, with the public sponsor pension plan with the closest propensity scoreFootnote 33. The results based on the propensity score matched samples confirm that public sponsor pension plans take more risk-than private sponsor pension plans.
6.2 Ex-post returns and ex-ante risk-taking
Panel C of Table 1 shows that during our sample period the realized equity premium was about 12%. This highlights the fact that ex-ante (expected) and ex-post (realized) returns differ. It is common, however, to use ex-post market-based measures of risk (such as fluctuations in stock returns) or accounting-based measures of risk (fluctuation in accounting earnings). Examples from the literature on bank risk-taking include Esty (Reference Esty1997), Saunders et al. (Reference Saunders, Strock and Travlos1990), and Emmons et al. (Reference Emmons, Gilbert and Yeager2004)and from the literature on mutual funds risk-taking, Chevalier and Ellison (Reference Chevalier and Ellison1997), Coles et al. (Reference Coles, Daniel and Naveen2006), and Ma and Tang (Reference Ma and Tang2012).
In this section, we re-examine our result using the conventional measure for ex-ante pension plan risk-taking, the proportion of funds allocated to risky assets. Data on asset allocation are only available for public pension plans so we are only able to replicate the regression results from Table 6. Table 8 presents the robustness regression results. Our main findings remain the same. The coefficient of funded status is significantly positive and the coefficient of contributions is not statistically significant in all specifications.
Panel regression for publicly traded sponsors (IRS 5500, COMPUSTAT & P&I Data, 1996–2002)

6.3 Additional robustness tests
We estimated specifications that employ an alternative measure of pension plan risk-taking. The likelihood that the pension plan is frozen or terminated can be interpreted as a proxy for risk-taking, since higher risk is associated with a lower probability of pension plan survival. The relationship between plan closure and the asset–liability structure also captures differences in the incentives of public and private sponsors to terminate or freeze the pension plans.
The results (not reported here, available upon request) show that the probability of pension plan closure increases with underfunding for plans with public sponsors, but not for plans with private sponsors. Moreover, contributions, vested liabilities, benefits and the share of active participant are significant drivers of pension plan closures for both public and private pension plans in this specification. In particular, higher contributions, vested liabilities and benefits lead to increased likelihood of plan closures, while a higher share of active participants implies a lower probability of plan closure.
In our panel regressions, we have considered additional specifications with industry controls as well as fixed effects that include different combinations of control variables. The main findings reported above are robust across the specifications. For example, including the lagged return in specification (4) decreases the statistical significance because we lose about 40% of the observations but the results are qualitatively similar with coefficients that have the same sign and are of similar magnitude.
Overall, our robustness tests suggest that the empirical relationships documented in this paper are robust, while the testable predictions of the theoretical models in the current literature, when taken individually, cannot explain the rich empirical pattern of pension plan risk-taking. Instead, the existing theoretical models can be viewed as complementary and need to be incorporated into a more general framework that highlights the multiple trade-offs of sponsors and agents when they optimize pension plan investments.
7 Conclusion
This paper uses a large sample of corporate DB pension plans sponsored by private and public firms to investigate the relationship between the plan risk-taking and its asset–liability structure, as well as the ownership and financial characteristics of the sponsoring company. First, we examined the cross-sectional relationship between different measures of pension plan risk and the funded status of pension liabilities, as well as the ownership of the sponsor. Next, taking into account the time-varying asset–liability structure and investment opportunity set, we also characterize the conditional risk-taking of pension plans in a panel dataset of pension plan asset class holdings of publicly-traded sponsor companies.
We test empirically whether the sponsor's private versus public ownership matters for several theoretically motivated hypotheses about the relationship between total risk and asset–liability structure. We document a robust positive effect of the funded status of the plan's pension liabilities on the plan risk-taking, that are qualitatively different for publicly-traded versus privately-held sponsors. These findings cannot be readily interpreted within the popular models of pension plan risk-taking. The significance of the ownership structure suggests that future theoretical analysis of pension plan risk-taking would require a broader modeling framework that incorporates managerial and other stakeholder incentives for alternative types of sponsor ownership structure.
Appendix
Studies examining the effect of pension funding levels and contributions

Variable definitions