Introduction
The poultry red mite (PRM) Dermanyssus gallinae (De Geer, 1778) is an avian haematophagous mite of economic importance in layer farms worldwide (Sparagano et al., Reference Sparagano, George, Harrington and Giangaspero2014). The presence of PRM on poultry farms produces both direct and indirect damage (stress, anemia, decrease in yield, downgraded eggs and transmission of pathogenic microorganisms). Better control of the PRM to reduce its impact is a crucial challenge because its particular life habits make it a highly recalcitrant pest mite. Being a strictly haematophagous mite, the PRM needs blood meal to molt (juveniles) and to complete any gonotrophic cycle (adult female). However, in contrast to true parasites, the PRM does not live on a host. The PRM comes into contact with the host only during fast and rare blood meals, as do micropredators sensu Lafferty and Kuris (Reference Lafferty and Kuris2002) such as adult female mosquitoes or bedbugs. Most of the conventional control means (sprayed products, whether an acaricide or mite repellent) are only partly efficient. Furthermore, because PRM does not live on the host, the external treatment of hens is unsuitable to control this pest.
In general, whether the system is plant-phytophagous or is a host-micropredator, host selection by a parasite is likely to proceed in a hierarchical manner: (1) seeking and remotely recognizing the host using chemosensory (olfactory in aerial media) and/or visual cues (choice step), and (2) assessing the acceptability of the host based on contact cues (gustatory in aerial media) (selection step) (see Takken and Knols, Reference Takken and Knols2010; Deletre et al., Reference Deletre, Schatz, Bourguet, Chandre, Williams, Ratnadass and Martin2016; Mollo et al., Reference Mollo, Garson, Polese, Amodeo and Ghiselin2017). The choice step generally occurs over a distance, whereas the selection step generally occurs upon contact. Making the host repellent or at least less attractive would greatly contribute to improving the control of the PRM. Indeed, lengthening the delay between two blood meals is expected to significantly decrease the mite's population dynamics, as a consequence of the increase in the interval between moults and between egg-laying events. According to model simulations, a delay in the blood meal (dedicated to egg maturation) in female mosquitoes can have significant effects on the population dynamics of these micropredators (Wan and Zhu, Reference Wan and Zhu2014). Disrupting chemical interactions in PRM and the hen is likely to significantly affect the growth of mite populations.
According to Dethier et al. (Reference Dethier, Browne and Smith1960), a substance may be considered repellent against a given organism when it causes this organism to make movements oriented away from its source. Deletre et al. (Reference Deletre, Schatz, Bourguet, Chandre, Williams, Ratnadass and Martin2016) further refined categories and definitions of the repellent activities in the context of pest control. These authors distinguished two main types of repellent actions: expellent vs irritant. Irritant activity induces a contact-mediated behaviour governed by specific gustatory receptors. Expellent activity induces a distance-mediated behaviour and is governed by specific olfactory receptors. Here, we focus on the expellent type, within which Deletre et al. (Reference Deletre, Schatz, Bourguet, Chandre, Williams, Ratnadass and Martin2016) proposed to distinguish between ‘true repellent’ and ‘odour-masking’ actions. The former prevents location of the remote host by inducing movement away from the odour source by an organism, whereas the latter consists of either a partial or complete disruption of the remote localization of the host due to the odour cue (Bernier et al., Reference Bernier, Kline, Posey, Debboun, Frances and Strickman2007; Deletre et al., Reference Deletre, Schatz, Bourguet, Chandre, Williams, Ratnadass and Martin2016).
For some time, the chemical profile of vertebrate odours has been suspected to vary according to various environmental factors. For instance, chemical analysis of volatile compounds from the human body seems to be promising for the diagnosis of diverse human diseases and infections (Prugnolle et al., Reference Prugnolle, Lefèvre, Renaud, Möller, Misse and Thomas2009; Shirasu and Touhara, Reference Shirasu and Touhara2011; Kim et al., Reference Kim, Jahan and Kabir2012; Santonico et al., Reference Santonico, Lucantoni, Pennazza, Capuano, Galluccio, Roscioni, La Delfa, Consoli, Martinelli, Paolesse, Di Natale and D'amico2012). Human subjects infected by the malaria parasite Plasmodium falciparum showed skin volatile profiles that were different from those of uninfected people (Berna et al., Reference Berna, McCarthy, Wang, Saliba, Bravo, Cassells, Padovan and Trowell2015), whereas, in mice, host odour changes were associated with the presence of infectious stages of Plasmodium chabaudi (De Moraes et al., Reference De Moraes, Stanczyk, Betz, Pulido, Sim, Read and Mescher2014). Diet also proved to have an effect on the composition of human skin odours (Havlicek and Lenochova, Reference Havlicek and Lenochova2006; Mebazaa et al., Reference Mebazaa, Rega and Camel2011; Fialová et al., Reference Fialová, Roberts and Havlíček2016; Paskewitz et al., Reference Paskewitz, Irwin, Konwinski and Larson2018). Mebazaa et al. (Reference Mebazaa, Rega and Camel2011) demonstrated that volatile emanations from human arm pits were chemically modified after subjects ingested Fenugreek (Trigonella foenum-graecum L., 1753). The effect of alcoholic beverage or fruit ingestion on skin odour composition and mosquitoes' attraction has also been investigated. Shirai et al. (2002) provided the first evidence that volunteers were more attractive to laboratory Aedes albopictus (Skuse, 1894) mosquitoes after ingesting 350 mL of beer. In another study conducted under semi-field conditions in Burkina-Faso, Lefèvre et al. (Reference Lefèvre, Gouagna, Dabiré, Elguero, Fontenille, Renaud, Costantini and Thomas2010) demonstrated that beer consumption by volunteers resulted in a consistent increase in human attractiveness to Anopheles gambiae (Giles, 1902) mosquitoes. Paskewitz et al. (Reference Paskewitz, Irwin, Konwinski and Larson2018) provided lab evidence that the ingestion of banana increased the human attractiveness to An. stephensi as compared to ingestion of grapes.
Although no such study is available in birds, modulating the hen odour via feed supplementation using essential oil compounds may be promising to improve PRM control. Essential oils are traditionally used for their repellency to pest arthropods (Ellse and Wall, Reference Ellse and Wall2014). For example, the genus Cymbopogon produces the most widely used natural repellent against mosquitoes (Trongtokit et al., Reference Trongtokit, Rongsriyam, Komalamisra and Apiwathnasorn2005). Several whole essential oils or individual compounds have been shown to repel PRM (George et al., Reference George, Sparagano, Port, Okello, Shiel and Guy2010; Birkett et al., Reference Birkett, Hassanali, Hoglund, Pettersson and Pickett2011; Nechita et al., Reference Nechita, Poirel, Cozma and Zenner2015). In Europe, many plant extracts (containing essential oils) or single compounds of essential oils are allowed as feed additives in animal farming (European Union Register of Feed Additives pursuant to Regulation (EC) No 1831/2003), making them good candidates for modulating hen odours via feed supplementation. According to claims, some commercially available in-feed solutions, which include blends of various volatile compounds, make hens less attractive to the PRM, thereby decreasing red mite infestation (e.g. Nor-Mite®, a mineral feed sensu regulation (EC) No 767/2009 (a complementary feed containing at least 40% crude ash) composed of Syzygium aromaticum (L., 1753) (syn = Eugenia caryophyllata) and Cymbopogon nardus L.). Crude Nor-Mite®, as well as several of its individual compounds, has been shown to be repellent in laboratory tests on D. gallinae (Labalette and Chicoteau, Reference Labalette and Chicoteau2016; Labalette et al., Reference Labalette, Vanden Avenne and Daubner2017a, Reference Labalette, Roussel and Chicoteau2017b). In addition, in a field trial with Nor-Mite® (at 500 ppm in standard feed), a significant decrease in the PRM population was recorded just after the treatment started, followed by a consequent and stable reduction of the infestation over a 60-day period (Labalette and Chicoteau, Reference Labalette and Chicoteau2016). However, at the start of the present study, it was unknown whether the recorded effects of the Nor-Mite® were due to the hen odours' alterations.
The present study was dedicated to test the following hypotheses: (1) hen odours are modified by Nor-Mite® ingestion and (2) these modified hen odours are less attractive (expellent) to PRM than unmodified hen odours. To document the distance-mediated expellent activities (i.e. blocking host recognition at the first ‘choice’ step and encompassing the ‘true repellent’ activity of volatile compounds emitted by odour-manipulated hens or any odour-masking effect), we carried out chemical analyses on hen odours as well as behavioural tests on PRM individuals with olfactometer devices to determine whether the ingestion of Nor-Mite® effectively decreased the hen attractiveness to the PRM, and, if so, what chemical changes were responsible for such an effect.
Material and methods
Biological material
Mites
Live PRMs were collected from two French barn layer farms in the Rhône-Alpes-Auvergne region and were then maintained in starvation in a lab at room temperature and under room hygrometry conditions in culture vessels (Microbox® initially for plant experiments; Avamoplast, Lokeren, Belgium) for at least one week before the test.
Birds
All the experimental work with animals was performed at the IRD laboratory animal facility, with appropriate animal ethics approval. Adult female White Leghorn chickens were maintained in a controlled temperature room and were provided water and feed ad libitum (standard feed: B114 pondeuse EFIBIO, France; composition: corn, triticale, soybean, sunflower, barley, bean, alfalfa and calcium carbonate). Before and during any of the experiments (e.g. odour sampling and in vivo choice tests), starting at least three days before the test, the treated hens were provided with standard feed with the addition of Nor-Mite® powder at a rate of 5 kg T−1 (0.5%) (supplemented diet: standard feed + Nor-Mite®). The control hens were provided with crude standard feed (unsupplemented diet: standard feed alone).
Chemical analysis of the VOCs
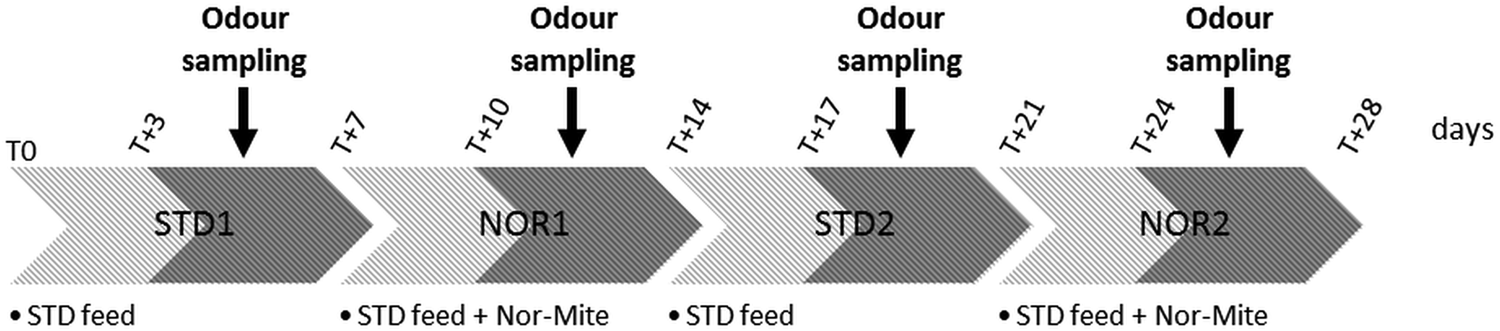
For the chemical characterization of the hen odours, a sequential ‘before/during treatment’ experiment was conducted on the nine hens as described in Fig. 1. A series of individual odour trapping events was performed over a one-week period on the unsupplemented hens (STD1), then a second series on the same flock after a minimum of three days of treatment (NOR1). To evaluate the persistence and/or the cumulative effect of the possible modifications, we replicated this sequential experiment on the same flock during the fortnight following the end of the NOR1 series (STD2 and NOR2).
Timeline of feed experiments and of odour sampling. Nine hens were successively fed with unsupplemented feed for 7 days (STD1, T0 to T + 7), then with supplemented feed for an additional 7 days (NOR1, T + 7d to T + 14). The same sequence was repeated over another two-week period immediately following (STD2, T + 14 to T + 21 and NOR2T + 21 to T + 28). Individual odour trapping was performed after a minimum of three days of treatment over a week (dark grey areas).

Trapping of hen odours (before and after ingestion of the feed additive) and VOC monitoring
Hen volatiles were monitored using solid-phase microextraction (SPME). This is a nondestructive, solvent-free, sampling technique ideally adapted to the sampling of volatiles from living organisms (Musteata and Pawliszyn, Reference Musteata and Pawliszyn2007; Duan et al., Reference Duan, Shen, Wu and Guan2011). Sampling by SPME was performed using 65 µm PDMS-DVB Stableflex fibres (Supelco, Sigma-Aldrich, Bellefonte, PA, USA).
To trap hen volatile organic compounds (VOCs) in headspace, individual hens were placed within a 60 × 30 × 30 cm glass terrarium, the walls of which were preliminarily covered using a specific polyethylene terephthalate plastic film (Nalophan®; Kalle Nalo GmbH, Wursthüllen, Germany), an inert plastic, to reduce ambient contaminations. After an equilibration time (15 min), an SPME fibre was introduced with a manual holder into the glass terrarium containing the hen. The fibre was exposed to the hen's headspace for 6 h, which, during preliminary tests, was found to be the best sampling time. During sampling, the hens were maintained in the dark to keep them calm. For each volatile sampling session, another glass terrarium remained empty as a control to monitor volatiles from the experimental room. This control terrarium was simultaneously sampled from an empty Nalophan® bag.
During the sampling time, all the hens excreted urine and faeces. Therefore, the hen odours included urine and faeces odours. This odour is consistent with a whole-body hen odour, as hens are commonly carrying these products, especially around the cloaca and on the legs, where the PRM commonly climb. Nevertheless, to refine the odour characterization, we also sampled odours from droppings of each hen in the absence of it from the glass terrarium, just after the 6-h hen-odour sampling period (2 h sampling duration). These paired data (one urine + faeces odour chromatogram paired to one hen odour per hen in each run) were used to determine the extent to which the sampled odours were emitted by these products as well as what part was typically emitted by other components of the hen body.
Gas chromatography-mass spectrometry (GC-MS) analyses of the SPME hen volatile extracts were performed on a Shimadzu QP2010 Plus spectrometer (quadrupole mass spectrometer, Shimadzu Scientific Instruments, Kyoto, Japan) interfaced with a Shimadzu GC2010 chromatograph. The Shimadzu GC was equipped with a split-splitless injector (250 °C – split ratio 1:4) and a 30 m × 0.25 mm × 0.25 µm film thickness Optima-5MS fused silica capillary column (Macherey-Nagel, Düren, Germany), with helium as the carrier gas (1 mL min−1), and the chromatograph was programmed for a 5 min isothermal at 40 °C, then 40 °C to 150 °C at 4 °C min−1, 150 °C to 240 °C at 16 °C min−1 and 4 min at 240 °C. The overall program lasted 42 min.
Mass spectra were recorded using the electronic impact ionization mode at 70 eV, scanning from 38 to 350 m/z. The ion source was set to 200 °C, whereas the transfer line was set to 250 °C. All the volatile compounds were identified by comparison with a mass spectral library (NIST; Wiley 9th) and manual identification by a chemist. Retention times of a series of n-alkanes (alkanes standard solution, 04070, Sigma Aldrich®) were used to convert retention times into retention indices. Chromatograms were acquired and analysed using the Shimadzu software GCMS solution v.4.11. All the peaks of each chromatogram were considered, including the compounds present in very low and trace amounts. Non-natural compounds, such as industrial chemicals (e.g. 2-ethylhexan-1-ol and naphthalene) and/or compounds not naturally produced by living organisms (Charpentier et al., Reference Charpentier, Barthes, Proffit, Bessière and Grison2012), were considered not relevant and were discarded.
GC-MS analyses of the Nor-mite® core were performed on a liquid extract in cyclohexane. The GC analysis was as described above with the following differences: the spectrophotometer was a basic Shimadzu QP2010, the injection temperature was 280 °C and the split ratio was 1:20, the Shimadzu GC was equipped with a Zebron Capillary GC-ZB-5 column (Phenomenex, Aschaffenburg, Germany) and the chromatograph was programmed as follows: 3 min isothermal at 50 °C, then 50 °C to 150 °C at 5 °C min−1, 150 °C to 250 °C at 14 °C min−1 and 5 min at 250 °C. The overall program lasted 35 min. Mass spectra were recorded with the same mode as above, the ion source was set to 220 °C and the transfer line to 280 °C. The identification of compounds was also identified in comparison with the NIST library, complemented by comparisons with standard compounds.
Choice behavioural tests
To test distance-mediated mite behaviour, choice tests were conducted using tube olfactometers and odour-loaded air flows. Two types of odours were used: one directly emitted by living hens (whole odours, in vivo tests) and the other from single synthetic compounds (obtained from Sigma-Aldrich; in vitro tests).
Olfactometer devices and airflow design
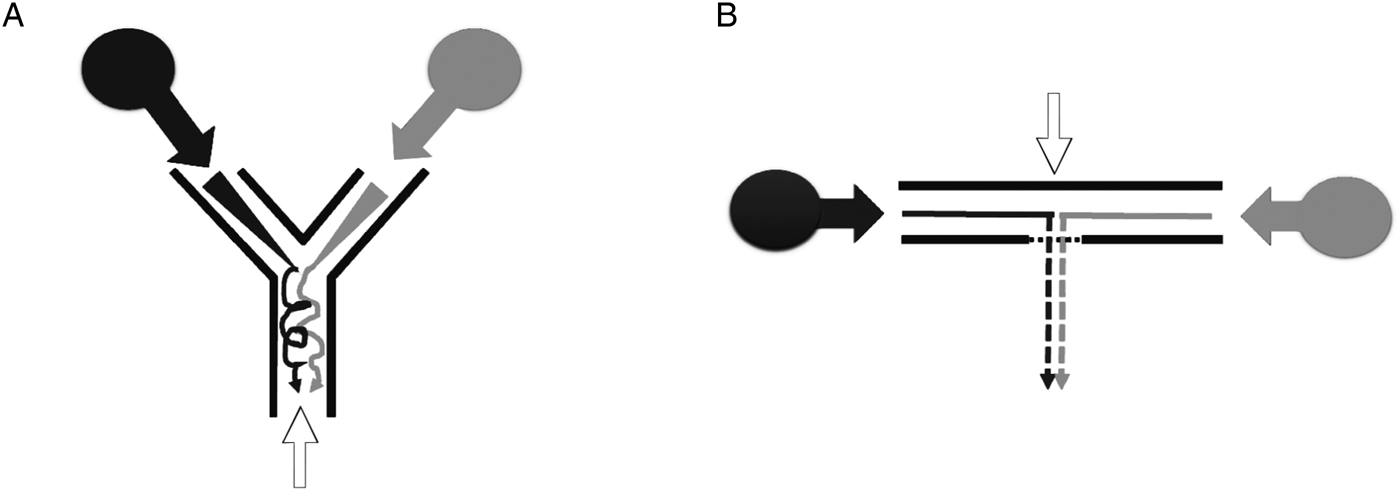
In all the tests, mites were individually released using a fine wet brush at the olfactometer entrance, where two airflows were circulating in the same direction and at the same flow rate (120 mL min−1). The airflow was loaded with odours on both sides or on a single side (with pure air as a control on the other side), depending on whether odour-masking or true repellent activities were sought. The circulating air was purified during passage through active charcoal pellets. This charcoal-purified airflow was humidified by passage through a bubbler filled with water and was then directed into the odour containers (either hen boxes or glass jars) as follows: in the Y-shaped olfactometers (inner diameter = 5 cm; glass), pure or odour-loaded airs were blown by means of a membrane pump into each end of the Y tube (through adapted glass + Teflon connectors). Then, the mite individual was released within the first centimetre of the base tube (Fig. 2A). In the T-shaped olfactometers (inner diameter = 0.45 cm; polypropylene), clean or odour-loaded airs were sucked off at the base of the T tube, and, subsequently, the mite individual was introduced through an ~800 µm diameter hole at the junction of the end tubes (Fig. 2B).
Shape and sense of airflows in the olfactometer devices. (A) Y-shaped olfactometer and (B) T-shaped olfactometer. Black and grey disks, source of odour-loaded air; solid black and grey arrows, sense of air flows; open arrows, mite entrance.

Thus, the tested mites could choose between a VOC (or a VOC complex) and pure air (control) or between two different VOC complexes. The choice was presented in two different ways: by allowing entry into a gradient of more or less concentrated odour-loaded airs in Y-shaped olfactometers or by allowing concomitant submission to two different air flows in the T-shaped olfactometers. In accordance with recommendations by Deletre et al. (Reference Deletre, Schatz, Bourguet, Chandre, Williams, Ratnadass and Martin2016), the Y-shaped olfactometers were mainly used to test the odour-masking effect, and T-shaped olfactometers were used to test the true repellency effect (expellent activity). Indeed, whereas the Y-shaped olfactometers are well-suited to test attractant (and associated odour-masking) activities, studying the true repellent effects with this olfactometer can be tricky because the mite has to go through an area with some VOC (central branch) to reach the branch with pure air. This activity may induce a strong increase in non-choice runs and may make the results unclear.
All the connections among the different parts of the set up consisted of Teflon tubing. The olfactometers were all mounted horizontally, with the end tubes directed toward the unique light source. A flexible heating resistor was placed under the olfactometer (internal temperature close to 40 °C) to favour mite activity (fasting mites are most likely to seek a host, thus being activated by the heat; see Kilpinen, Reference Kilpinen2001), thereby preventing backward movements. Airflow rates were regulated due to flowmeters with floating balls and were established during the preliminary assays for each type of container and olfactometer to maintain the mite's ability to adhere to the surface.
Odour containers
VOCs in the tests (either natural or synthetic) were collected in containers, with each supported with an inlet and outlet connector for incoming and outgoing air streams to allow clean air to circulate, thus becoming odour-loaded by passing through the headspace before reaching the olfactometers.
Containers for in vivo tests: Plexiglass® boxes were used (50 × 40 × 75-cm) to collect whole hen odours and to expose the mites in the choice tests. The boxes were supported with inlet and outlet connectors (one on the top and one on the bottom) and were specifically manufactured for these tests by Plexi d'Oc (Montpellier, France). Before the experiments were started, the inner walls of each box were covered with the Nalophan® film. Then, one hen was introduced into each test box, the pump was initiated and the boxes were carefully closed. To prevent pressure loss and to allow a positive pressure to be maintained into the box (thus allowing air to correctly circulate), 1-cm wide Teflon tape covered with 5-cm wide adhesive tape was tightly applied to the lid edges. The system was thus left in operation for 5 min before the tests started.
Containers for in vitro tests: To test for biological activity of the main compounds of interest, synthetic VOCs were provided to mites in dedicated 500-mL glass jars with screw-on caps (Duran-Schott, Colombes, France), each containing a 2 mL glass diffuser filled with 20 µL of the compound(s) being tested (purity ⩾95%), with the lid septum being pierced with a deactivated fused silica capillary (Agilent, inner diam. = 0.53 mm, length = 4 cm). Once the diffusers were in place and the device was installed, a mite was inserted 2 min later, allowing the compounds time to diffuse into the olfactometer's branches and for the system to stabilize. This approach allowed constant and linear diffusion of the compounds. The vials were weighted individually before each test run to check the evaporation rates of the synthetic compounds.
Tested modalities
In vivo tests (Plexiglas® boxes): The effects of the whole hen odours on PRM behaviour were tested on nine hens from a single batch (same strain, age and origin) fed at the same time (separated cages) with standard feed supplemented with Nor-Mite® (four hens) or with unsupplemented standard feed (five hens).
The testing of the unsupplemented hens vs the supplemented hens (Y-shaped olfactometers to determine whether supplemented hens were less attractive than supplemented ones) was performed using the hen boxes.
The tests with the unsupplemented hens (crude standard feed) vs clean air were conducted using the Y-shaped olfactometers to check for odours from the unsupplemented hens being effectively attractive to the PRM under the experimental conditions.
In vitro tests (glass jars): Some of the individual VOCs identified in the odours from the supplemented hens were tested in T-shaped olfactometers vs pure air.
Bioassay procedure
The experimental time (time that it takes a mite to choose one branch or the other) was recorded from the time the air propulsion/suction tube was connected to the Y or T tube. Single, starved adult female mites were introduced at the above-described points and were observed for no longer than 10 min to state their choice.
In the Y-shaped olfactometers, upon reaching the Y junction in the glass tube, a mite chose between two odour-loaded airflows. When the mite reached the far end of one arm, the choice was scored, and the mite was removed from the Y tube (same for T tubes). When a mite made no choice within 10 min (2 min in T tubes), a zero was recorded. The olfactometer was then thoroughly washed out using ethanol (96% Extra Pure; Sigma-Aldrich) to remove any adsorbed VOC and was allowed to fully dry under a fume hood before any subsequent tests (a set of nine identical Y-shaped olfactometers and 20 T-shaped olfactometers were used to conduct sequential tests). After each single test, the flow set up (connection between Y or T branches and tubes from the different odour containers) was inverted to avoid position effects.
In all types of runs (Y- and T-shaped olfactometers, hen boxes and glass jars), blank tests (only pure air circulating from both containers) were intermittently processed (randomly inserted between the real tests). This was done to check for the unbiased distribution of choices (symmetry of olfactometer, with a choice distribution close to 50/50 in the absence of test VOCs).
Statistical analyses
All the analyses were performed in the R software program (R Development Core Team, 2018; url: http://cran.r-project.org/).
Removal of compounds from ambient air
Compounds found in the controls are representative of room air odours and are therefore irrelevant in the comparison of the hens' odours. As a result, for each sample, the area under the peak (AUP) of each compound recorded in the control was subtracted from the AUP from the corresponding compound recorded in the test.
Analysis of odours based on dissimilarities
All the chemical data were log-transformed and proportions of each VOC relative to the most abundant one within each chromatogram were calculated prior to the following analyses being performed. Nonmetric Dimensional Scalings (NMDS) were performed to visualize the dissimilarities among the samples through a projection in a multidimensional space. Multidimensional positioning, in general, consists of calculating the coordinates of the same objects from a proximity matrix (similarity or dissimilarity) and projecting them into a k-dimensional space (usually k = 2 or 3). NMDS compares the pairwise distances (difference) of the objects in reduced ordination space (expressed in terms of axes) and the dissimilarity of the objects in the real world. Here, the objects were the blends of the VOCs (odours) captured for each hen at each moment of the odour-trapping experiment. The proximity matrix was a dissimilarity matrix constructed using the Bray–Curtis method. To obtain the most satisfactory representation, reducing the conflicts between the data and projection, i.e. reducing the deviations in the actual distances within each object pair in the projection, is necessary. For this, a stress function is calculated that measures the goodness of fit between the estimated distances and the input proximities. The projection is optimized by an iterative approach to minimize the amount of conflict.
Once the unconstrained ordinations were performed as described above using the metaMDS function of the vegan R package vs 2.4–1 (Jari et al., Reference Jari, Blanchet, Friendly, Kindt, Legendre, McGlinn, Minchin, O'Hara, Simpson Gavin, Solymos, Stevens, Henry, Szoecs and Wagner2016), we estimated whether and to what extent these ordinations explained the odour variability. Therefore, we used the envfit function of vegan to fit the two experimental variables (Nor-Mite® supplementation, series) to the unconstrained ordinations. Additionally, two-way permutational multivariate analyses of variance (PERMANOVA) were performed using the adonis function to test the effect of the same variables and their interactions. We also measured the homogeneity of dispersion among the variables using the functions betadisper and permutest in vegan. The pseudo-F and P values from 999 permutations were calculated for each factor.
For identification of the most discriminating VOCs according to feed supplementation using the Bray Curtis dissimilarities, analyses were conducted using the simper function in vegan. Similarity percentage (SIMPER) (Clarke, Reference Clarke1993) is based on the decomposition of the Bray Curtis dissimilarity index and allows VOCs to be ordered according to their estimated contribution to the differences between groups. In addition, as expectations not only rely on the amount of variation but also on the occurrence patterns, to refine the identification of the most discriminating VOCs according to feed supplementation, we defined a method based on the occurrence and the amount of segregation according to feed supplementation, with the STD1 considered the reference data for unsupplemented hens, the NOR1 and NOR2 considered the reference data for the supplemented hens, and the STD2 possibly accounting for the persistence of the supplementation effect.
Behavioural tests
The data from the choice tests were analysed using two-tailed binomial tests based on the null hypothesis that the probability of scores for the test VOC(s) or the control (or for either VOC complexes) is equal to 50%. Since these tests required the assignment of individuals to one of the two choices, individuals who had not made a choice were excluded from the statistical analyses.
Results
Composition of hen odours and comparison between unsupplemented and supplemented hens
We obtained 22 useable chromatograms from the nine hens tested and the two ‘before/during treatment’ series (several samples were lost because of some SPME fibres being pecked by a bird during sampling). In the first ‘before/during treatment’ series, odours from five unsupplemented hen individuals STD1 and from three supplemented hen individuals NOR1 were successfully sampled. In the additional ‘before/during treatment’ series, odours from seven individuals were successfully sampled in each series (STD2 and NOR2).
Analyses of the hen chromatograms (excluding control samples and urine + faeces chromatograms) allowed identification of most of the compounds in the profile. A total of 96 VOCs were detected in the hen odour profiles. These VOCs were distributed as follows: aldehydes (72.07% total areas under peaks), terpenes (8.19%), alcohols (7.9%), aromatic compounds (4.69%), carboxylic acids (3.94%), ketones (1.91%) and others (1.3%: alkanes, alkenes and esters). The striking predominance of aldehydes was due to nonanal, which was recorded in 100% of the individuals and represented the major part of the areas under the peaks (63.03 ± 2.83%). To account for the possible variation between individual SPME samples (trapping efficiency may sometimes vary among samples when different SPME fibres are used), the proportions of each VOC were calculated relative to this VOC within each chromatogram. The urine + faeces 22 paired chromatograms allowed the detection of 76 of the VOCs detected in the hens' chromatograms (plus 23 other VOCs).
To reduce bias due to the sensitivity limits of SPME sampling and GC-MS analyses, the dataset was reduced by discarding the VOCs with an occurrence percent below a 15% threshold for the whole dataset. The resulting corrected hen-odour dataset was a matrix containing 87 VOCs distributed across 22 odour samples (see Supplementary materials S1).
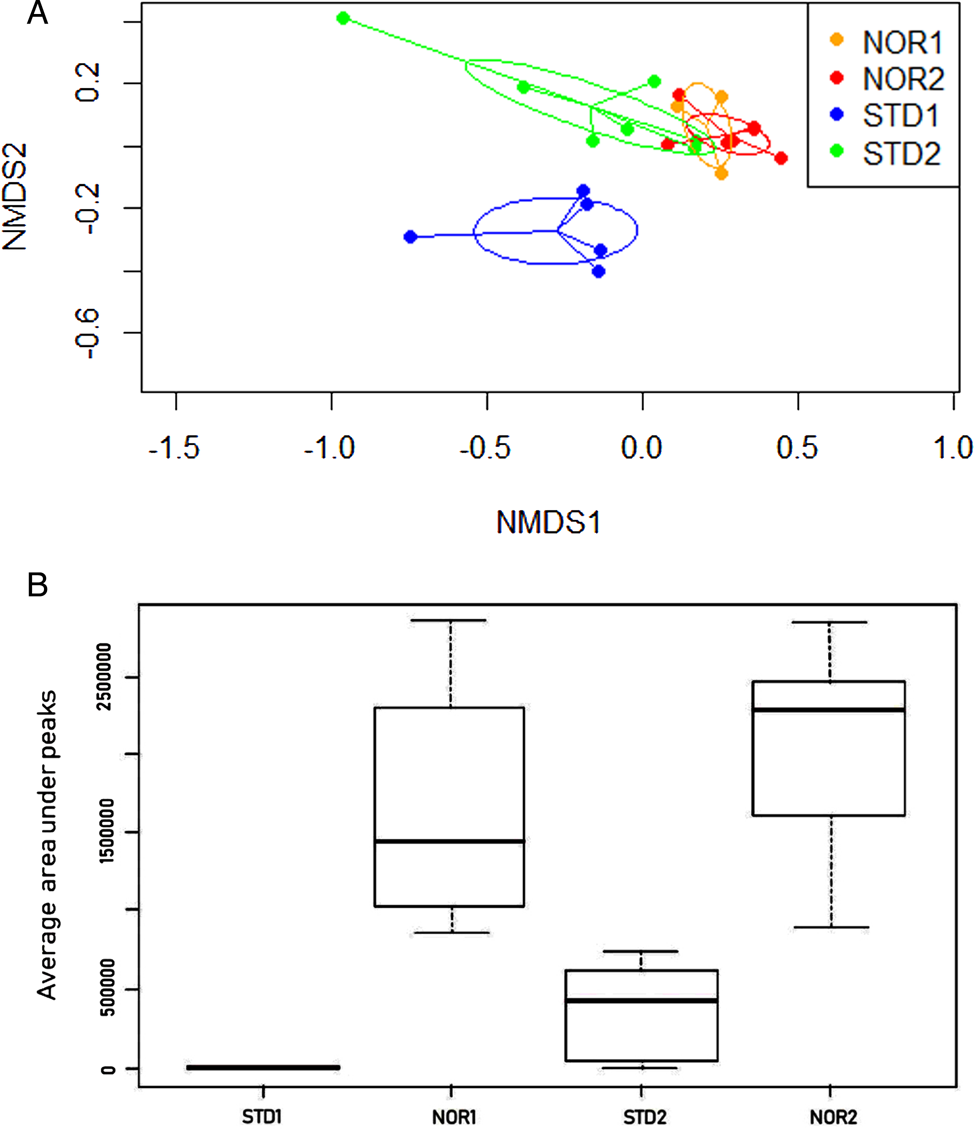
The NMDS projection of the corrected whole dataset (87 VOCs) resulted in a 0.092 stress value, with k = 2. The two-dimensional projection showed a marked distance between the barycenters of the profiles from the first series of unsupplemented hens (STD1) and those obtained after ingestion of Nor-Mite® (with the profiles in the two groups NOR1 and NOR2 largely overlapping each other) (Fig. 3A). Overall, the STD2 group had an intermediate position between NOR1 + NOR2 and STD1. This finding reflected the observed persistence of some of the compounds emitted after Nor-Mite® ingestion, even after >3 days of unsupplemented feeding (see below and Fig. 3B).
(A) Two-dimensional NMDS projection of the VOC contents between odours of the different hens tested (Bray–Curtis dissimilarity) using the corrected 87-VOC whole dataset (stress = 0.090). Data are placed in 2D space after iterative improvement of their ordinational distancing (spacing) to as close as possible represent their distance in the dissimilarity index (see Material and Methods). The axes display data in a way which best represents their dissimilarity. Each coloured dot corresponds to a sampling event from a single individual; STD1, unsupplemented hens (n = 5); NOR1 and NOR2, supplemented hens (series 1 and 2, n = 3 and 7 resp.); STD2, unsupplemented hens in the second series (n = 7). Segments of the ‘spider’ diagrams are connected to the centroid of their treatment group (STD1, STD2, NOR1 and NOR2), and dispersion ellipses were drawn using the standard deviation of point scores. (B) Distribution of eugenol areas under peaks, showing the marked persistence over the STD2 period (i.e. after more than 3 days feeding on unsupplemented food). Occurrence of eugenol per chromatogram was as follows: STD1, 0/5; NOR1 3/3; STD2, 5/7 and NOR2, 7/7.

The goodness of fit of Nor-Mite® feed supplementation was significant with α = 5% (P = 0.001) and the effect of the series (STD1 + NOR1 vs STD2 + NOR2) was not significant (P = 0.107). With two-way PERMANOVA, the effects of both these variables as well as their interaction were significant, with α = 1% (see Table 1). The significant effect of the series in the latter analysis may be due to the hen individuals with successful odour sampling being partly different between the first and second series; the odours of two hens were successfully analysed in all four trapping periods (# H1 and H3), whereas the others were either successfully analysed in one of the two periods within a series or in a single series (e.g. #H7 in the first series only and #H8 and H9 in the second series only). The interaction between feed supplementation and series is consistent with the persistence of some VOCs during the STD2 unsupplemented period.
Results from the multivariate permutational analyses (PERMANOVA) of differences in Bray–Curtis indices of dissimilarity according to the feed supplementation and the experimental series

d.f., degrees of freedom; SS, sum of squares; Mean Sqs, mean sum of squares; pseudo F, F value by permutation.
Significantly higher dispersion of data was recorded in the unsupplemented hens compared to the supplemented hens (permutest F = 10.501, P = 0.004), whereas no significant differences were recorded between the two series (permutest F = 0.655, P = 0. 494). This finding might explain, at least partly, the significant effect of feed supplementation from the PERMANOVA results. Whether the feed supplementation effectively is the cause of the difference in dispersion is unknown, but notably, one of the possible effects of the supplementation is the homogenization of the hen odours.
To further investigate the effect of the Nor-Mite® supplementation, we strove to identify the VOCs of interest to answer the main questions here by examining both the segregation patterns of the VOCs' occurrence (presence/absence) and their similarity percent using abundance data (SIMPER analysis on the matrix of the VOC proportions relative to nonanal in each chromatogram) according to treatment, as well as their possible animal or plant origin. The unsupplemented STD1 hens were considered references for the typical hen odour in our conditions because these hens had never been supplemented with Nor-Mite® (or any other similar product), in contrast to all the other hens (NOR1, NOR2 and STD2). Given the experimental design and the above-described results, the unsupplemented hens in the second series (STD2; second run after a 1-week supplementation with Nor-Mite®) were not used as a reference for either of the two conditions due to possible persistence effects. The following general assumptions were considered to explore the segregation patterns of the VOCs' occurrence: the VOCs having an occurrence close to 100% in the five STD1 hens were likely to be part of the intrinsic hen odour in our conditions, whereas those VOCs having an occurrence percentage close to 0 in these hens and high in the NOR1 and NOR2 hens were likely emitted due to Nor-Mite® supplementation.
Typical hen odour and affected VOCs
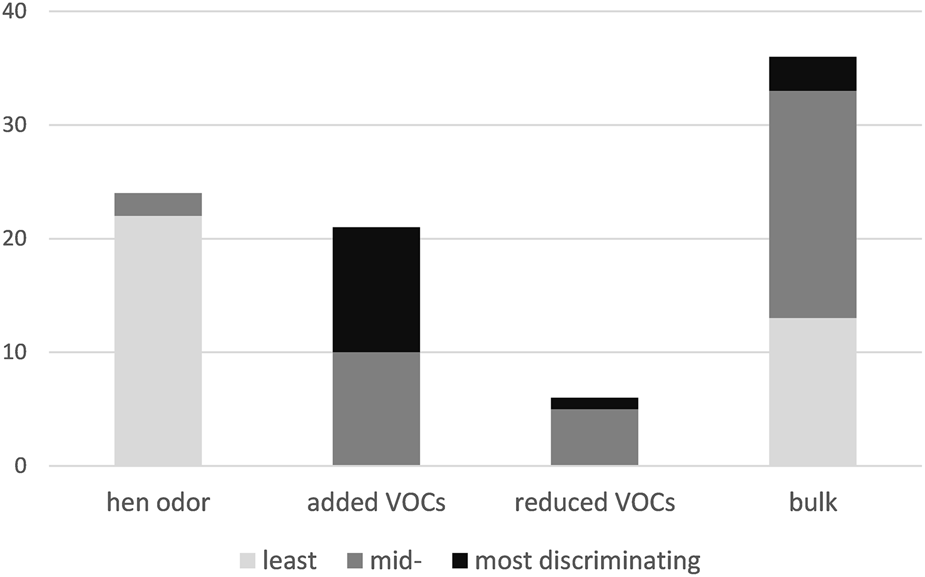
The 87 VOCs retained in the corrected dataset were classified into the following categories: ‘hen odour’, ‘added VOCs’, ‘reduced VOCs’ and ‘bulk’ using our occurrence-focused assignment rules (Fig. 4).
– ‘Hen odour’. 24 VOCs were recorded in all five STD1 hens or almost all (4/5) and in >80% of the other treatments (NOR1 + NOR2, STD2). In the SIMPER order, 22 of these 24 VOCs were classified among the 35 least discriminating, with 12 of them being in the last positions (see Fig. 4 and Supplementary materials S1). This order is consistent with a VOC signature typical of the hen odour in our present conditions. All the more that twelve of them were absent from the urine + faeces chromatograms in almost all the STD1 samples (namely, hexan-1-ol, tridecanal, nonan-1-ol, hexanal, 2-pentylfurane, octan-2-one, λ-dodecalactone, hexanoic acid, oct-2-enal, oct-1-ene, undecanal and an unidentified alkane), and others were detected in strikingly lesser amounts in the urine + faeces chromatograms than in the corresponding hen chromatograms. These findings make us confident that our characterization of hen odours is reliable and that the odours do not originate solely from urine and/or faeces.
Fig. 4.Distribution of VOCs according to our occurrence-focused rule (1 bar per VOC class) and to the SIMPER ranking (different grey levels). ‘Hen odour’, VOCs that compose the signature typical of the hen odour in the present conditions, ‘increased’, VOCs the amount of which was strongly increased during feed supplementation (incl. VOCs that were only detected during feed supplementation), ‘reduced’, VOCs the amount of which found to be decreased during feed supplementation, ‘bulk’, VOCs with no obvious segregating pattern. ‘Least’, ‘mid-’, ‘most discriminating’, VOCs with a SIMPER rank between 1 and 15 (15 VOCs with the highest contribution (30%) to the discrimination in the SIMPER analysis), between 16 and 52 and between 53 and 87 (34 VOCs contributing the last 12% of the discrimination) respectively.

– ‘Added VOCs’ and ‘reduced VOCs’. Here are considered post-supplementation changes. Using the following rule, 21 VOCs were found to be added or at least strongly increased after the start of supplementation: present in max. of 1/5 (0–20%) of the STD1 and in >50% of the NOR samples (NOR1 + NOR2). Among these, six VOCs were considered persistent because they had >50% occurrence in the STD2 group (Supplementary materials S1). In addition, the occurrence and amount distribution of another six VOCs (decane, dodecanal, m-cresol, nonane, 6-methylhept-5-en-2-one and an unidentified alkene) suggested that Nor-Mite® supplementation also induces a decrease in the production of some compounds that were naturally emitted by hens under our conditions. Indeed, these six VOCs were present in all five STD1 hens (two VOCs) or in 4/5 STD1 hens (four VOCs) but had a ratio mean STD1 AUP/mean NOR AUP above two (more than two-fold more in STD1) and showed <50% occurrence in the remaining groups (although distributed across all three non-STD1 groups). These six VOCs will be referred to as ‘reduced VOCs’ in the remaining text. In the SIMPER order, these 27 VOCs (21 ‘added VOCs’ + 6 ‘reduced VOCs’), which possibly were affected by the feed supplementation were classified among the first 49 (of 87 VOCs) contributing to the discrimination between the supplemented and unsupplemented hens. Of these, 12 were among the first 15 discriminating VOCs in the list, which contribute to 30% of the discrimination in the SIMPER analysis (Fig. 4, Table 1). Interestingly, 11 of these VOCs were ‘added VOCs’ and decane was the only ‘reduced’ VOC that had a substantial contribution to the SIMPER discrimination (ordered 6th, with the six first contributing 14% to the SIMPER discrimination). In short, half (11/21) of the ‘added VOCs’ were among the 15 VOCs, explaining the first 30% of the discrimination. Conversely, almost all of the ‘reduced’ VOCs (5/6) were among the affected VOCs contributing least to discrimination in the SIMPER analysis (positions 16th, 40th, 41st, 43rd and 44th respectively, ie among the 44 VOCs explaining the first 68% discrimination). Without any clear explanation for the decrease hypothesis, we decided to focus on the ‘added VOCs’ in the remainder of the text.
– ‘Bulk’. The remaining 37 VOCs had no obvious segregation pattern based on the above-described occurrence-focused rules and were thus considered bulk VOCs. The contribution of these VOCs according to the SIMPER results was in the mid-range or lower in most cases (see Fig. 4), although three were classified among the first 15 positions, i.e. among VOC explaining up to 30% discrimination (namely terpinen-4-ol, methoxyphenyl oxime, cis-verbenol). Overall, the results from the occurrence-focused classification and the computed distance-based method converged toward each other and generated consistent characterization of the most discriminating VOCs in the present study.

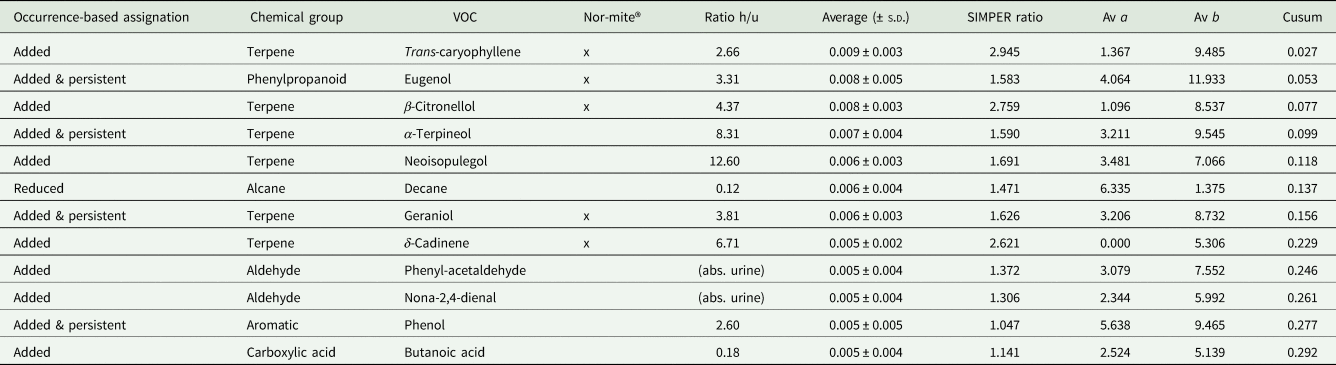
Most of the ‘added VOCs’ were found in a much higher amount (2.6 to 12.6-fold means AUP) in whole-hen chromatograms than in the urine + faeces chromatograms (if not undetected in the latter), with the exception of two VOCs (Table 1). Although we cannot conclude that most of the ‘added VOCs’ were emitted by the hen itself and not by urine and/or faeces (due to the reduced sampling time in the latter), this finding suggests that these VOCs originated at least from both, the animal and its excrements. Furthermore, one exception was noted: butanoic acid had 5.42 times more mean AUP in the urine + faeces chromatograms (Table 1).
Once the main VOCs of interest were identified, we attempted to determine the relationships of the ‘added VOCs’ with the Nor-Mite® mineral feed by considering their chemical features and respective presences in the mineral feed (Table 1). Five of the plant-originating recorded VOCs were present in both the Nor-Mite® core and in the odours of the supplemented hens. These were likely emitted as such after ingestion. Among the seven VOCs absent from the Nor-Mite® core and detected in the odours of supplemented hens, only three were plant secondary metabolites and thus may result from the metabolization of compounds in the former: butanoic acid, neoisopulegol and α-terpineol.
Finally, a few VOCs classified as bulk VOCs and located after VOCs explaining the first 30% discrimination in the SIMPER order were known to be found in the Nor-Mite® core (e.g. linalool, position 24). These VOCs were found in low amounts, and they most likely resulted from the feed supplementation. The failure for their detection in several of the supplemented hens may be due to either important interindividual variation and/or to the limits of our sampling and analysis systems.
Biological activity of the modified odours of the supplemented hens
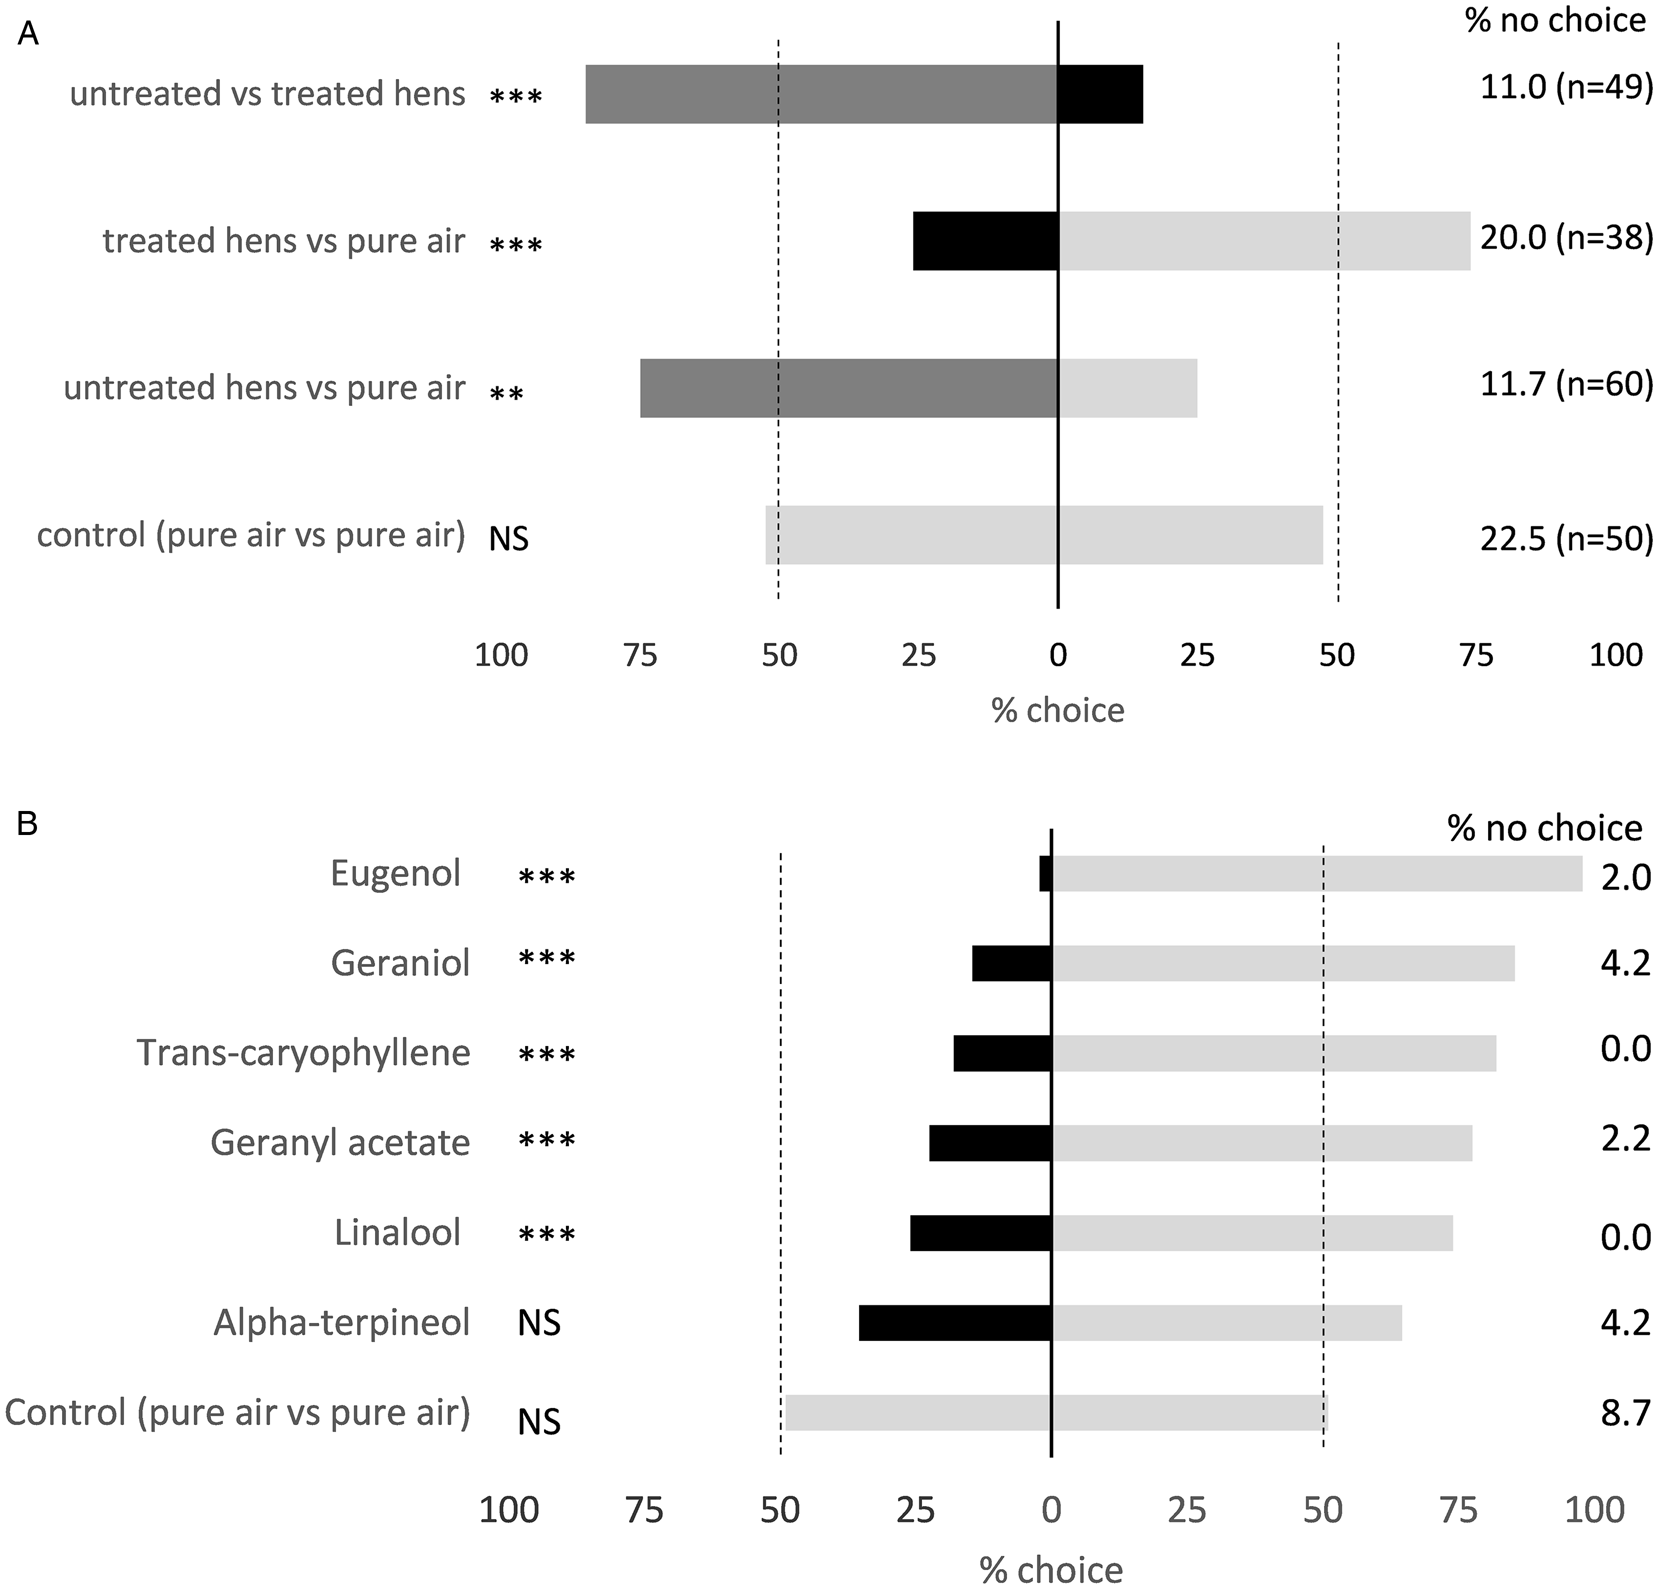
Blank tests, with pure air blown into both branches of the Y-shaped olfactometers or sucked from the basal branch of the T-shaped olfactometers (Fig. 2), did not allow the detection of any departure from the expected 50/50 distribution of the mite choices. This finding excludes any directional bias in the system, which could have been induced by uncontrolled factors (e.g. a lateral brightness gradient), and it validates the devices and protocol used to test the behaviour of D. gallinae individuals. The basic percentage of no-choice mites (as estimated in the blank tests) was much lower in the T-shaped olfactometers (2%) than in the Y-shaped olfactometers (18%). This pattern was congruent with expectations because the T-test was selected to reduce excess no-choice compared to Y-tests in the context of repellency tests due to the mixing of repellent VOCs with pure air during the proposed entry of the mite.
In the Y-shaped olfactometers containing air loaded with the odours of whole hosts, adult females of D. gallinae tended to significantly prefer odours from the unsupplemented hens than from pure air (Fig. 5A). This finding confirmed that the system was appropriate to test for remote host attractiveness (validation bioassays). In the test bioassays, the mites significantly preferred odours from the unsupplemented hens over those of the supplemented ones and preferred to choose pure air over the odours from the supplemented hens (Fig. 5A).
Olfactory response of starved adult females of D. gallinae to whole host odours in Y-shaped olfactometers (A) and single synthetic molecules in T-shaped olfactometers (B). In each histogram, the last line corresponds to the blank test (pure air blown from both sides to test for system reliability), with the tests shown above the lines. A. Percentage of mites that chose the odour of the unsupplemented hens (dark grey bars), the odour of the supplemented hens (black grey bars) or the pure air (light grey bars). For each test, the number of runs is specified to the right in the brackets (a new mite in each run). B. Percentage of mites that chose the molecule being tested (indicated at left; dark solid bars) or pure air (light grey bars). For each test, 50 runs were conducted, each with a new individual mite. Numbers within bars correspond to the number of mite individuals who chose the tested odour. % no choice = percent of mites that failed to make any choice. Treated and untreated hens, hens that have been fed on supplemented feed or not, Binomial < 0.001, P = 0.5, ***; binomial < 0.005, P = 0.5, **; binomial > 0.05, P = 0.5, NS (not significant).

Six molecules, representative of the two plant-originating VOC categories, were tested in the T-shaped olfactometers containing air loaded with single synthetic molecules. Because biological receptors are known, in some cases, to be much more sensitive than our technological detectors, it is likely that even the Nor-Mite®-issued VOCs that were detected in only some of the NOR hens were, in fact, also emitted by other hens in much lower amounts, which could be detected by the mites. Therefore, different VOCs were tested in olfactometers. Four VOCs were selected from among the VOCs present in the Nor-Mite® core that were classified as ‘added VOCs’ (+ in some case persistent) within the affected VOCs using our occurrence-based rules, of which three contributed substantially to the SIMPER discrimination (trans-caryophyllene geraniol and eugenol in Table 2) and one less-contributing VOC (geranyl acetate). One VOC was selected from among the plant-originating VOCs not present in the Nor-Mite® core (α-terpineol) and was also classified among the affected VOCs in Table 2. Finally, one VOC was selected from among the VOCs classified as bulk terpenes using our occurrence-based rules and classified below the 30%-contribution to the SIMPER discrimination although present in the Nor-Mite® core (linalool). More than 50% of the mites chose pure air instead of any of the six molecules tested, with only α-terpineol showing a nonsignificant choice ratio, with α = 0.05 (Fig. 5B).
Information on the first 12 affected VOCs contributing to 30% of the discrimination between odours of unsupplemented and supplemented hens according to the SIMPER analysis and to the congruent patterns of occurrence

Their presence in the crude mineral feed (Nor-Mite®) was estimated based on the composition of the product, and the amount of the VOCs in the urine + faeces odours was measured in the present study. Nor-Mite®, presence (x) or absence in Nor-Mite® core; Ratio h/u, ratio of the mean AUP in whole-hen chromatograms/urine + faeces chromatograms (paired per hen); Average, mean AUP in all whole-hen odours; SIMPER ratio, average to sd ratio, Av a, mean AUP in unsupplemented hen odours; Av b, id. in supplemented hen odours; cumsum, cumulative contribution; (abs. urine), not detected in urine + faeces odours.
Discussion
Except for very few studies (Douglas, Reference Douglas2006), the present work presents a rare odour analysis in birds performed using the entire bird and the first exhaustive and reliable VOC database from hens (Supplementary material S1). Most of the previous studies on bird odours, and particularly those conducted in hens (Williams et al., Reference Williams, Kokkinn and Smith2003; Bernier et al., Reference Bernier, Allan, Quinn, Kline, Barnard and Clark2008), relied on dipping some feathers in solvent or analysing uropygial gland secretions (see Campagna et al., Reference Campagna, Mardon, Celerier and Bonadonna2012). Such methods only partly reflect the overall odour emitted by a bird and frequently result in isolating some compounds that are not volatile at naturally occurring body temperatures.
In the present study, the following results on hen odour manipulation were shown:
– Odours emitted by hens may be substantially modified by the in-feed administration of plant-originated VOCs, mainly as a result of the addition of or increase in plant-originating VOCs.
– Most molecules newly emitted by hens after the ingestion of Nor-Mite® reflect the constituents of the core mineral feed and are emitted as such (i.e. without any chemical modification). Only a small part of the newly emitted molecules results from chemical changes. These changes may have occurred during the metabolism process in the hen and/or during the storing of the supplemented feed.
– A few Nor-Mite®-originating molecules persisted in whole-body odours up to one week after the feed supplementation (e.g. trans-caryophyllene and eugenol) was discontinued.
Different pathways may contribute to the observed modification of the whole-body odour, which may result in the excretion of VOCs via urine and/or faeces, cutaneous glands or breath. Although the different emission sources of odours may not get fully distinguished from each other in our study, records of the ‘added VOCs’ from urine + faeces chromatograms strongly suggest that urine and faeces are not the main source of most of the plant-originating VOCs (Table 1), which is supported by literature on mammals [eugenol and terpenes mainly excreted as metabolites according to Fisher et al. (Reference Fisher, von Unruh and Dengle1990); Michiels et al. (Reference Michiels, Missotten, Dierick, Fremaut, Maene and De Smet2008)]. Sweat glands were hypothesized to be an excretory route of terpenes in human (Stewart, Reference Stewart2014), but birds lack such glands. Solid feed may directly emit VOCs via the breath from the crop, where it is trapped and where drugs are not absorbed because of a keratinized epithelium (Toutain et al., Reference Toutain, Ferran and Bousquet-Melou2010). This emission mode is consistent with the non-persistent ‘added VOCs’. However, this may hardly explain the persistence of some VOCs (>3 days without any feed supplementation) since, the crop has an emptying time ranging between 3 and 20 h in broilers (Toutain et al., Reference Toutain, Ferran and Bousquet-Melou2010). Unless these VOCs may persist on the crop epithelium after it has been emptied, other sources likely operate in the emission of persistent ‘added VOCs’. Finally, the ‘added VOCs’ not present in the Nor-Mite® core may result from the degradation of certain molecules composing the Nor-Mite® active complex (or secondary compounds) during the transit through the body of the hen and/or when supplemented feed is being stored. For example, citronellal is the precursor of neoisopulegol thus, the former may undergo metabolization in the hen, which could have an enzyme that helps produce this compound.
Behavioural tests carried out on hen headspaces in the present study were dedicated to testing olfactory responses sensu stricto of D. gallinae to the host's whole odours, and the mites were voluntarily freed from the responses related to the sense of taste and touch because all contact was avoided between the mite and its host. We therefore tested the true repulsion (repellent activity) according to the definition of Deletre et al. (Reference Deletre, Schatz, Bourguet, Chandre, Williams, Ratnadass and Martin2016). Modifications of hen odours by Nor-Mite® ingestion produced a true repellent effect and not just an odour mask. Indeed, mites preferred pure air to air loaded with the odour of a supplemented hen. If odour modulation resulted in an odour mask, one would expect mite choice distribution in this test to approach 50/50 (no preference) due to disruption of the localization of host odour or to the reduction of the host's attractiveness. The repellent activity observed vis-à-vis the whole-body odour of hens was not due to a single VOC since all molecules that were individually tested but one (α-terpineol) was significantly repellent to starved females of D. gallinae in olfactometers.
The aversive effect of ‘added VOCs’ may be related to the toxic effect of corresponding odorant plant substances in the PRM. Animal behaviour is largely driven by sensory cues that predict reward or punishment with either innate or learnt aversion known in both vertebrates and invertebrates (Li and Liberles Reference Li and Liberles2015). Terpenes were originally produced by plants as toxins dedicated to defence against herbivores and became in some cases attractants or rewards to phytophagous organisms that evolved resistance to them (Terry et al., Reference Terry, Walter, Moore, Roemer and Hull2007). Interestingly, in natura, avian haematophagous arthropods may be exposed to plants that produce diverse toxins and are actively added by birds to their nests (see Scott-Baumann and Morgan, Reference Scott-Baumann and Morgan2015). Of ten whole plant essentials oils, three had both a repellent effect and a toxic effect (thyme, oregano and lavender) on the PRM, whilst all others exhibited no (or weak) repellent or toxic effects (Nechita et al. Reference Nechita, Poirel, Cozma and Zenner2015). The strongest repellent activity was found with eugenol, a molecule highly toxic to the PRM (Sparagano et al. Reference Sparagano, Khallaayoune, Duvallet, Nayak and George2013).
Despite extremely promising results, future works to strengthen and make results more specific are needed to definitely determine the overall mode of action of feed supplementation with repellent compounds. Questions remain concerning mite behaviour in the field. Notably, the dose of Nor-Mite® administered to the hens during our study was voluntarily 10-fold the recommended dose to ensure detection of odour modification. Confirmation of the behavioural tests at the recommended doses would be prudent. Similarly to the toxic effect of pesticides (Finney Reference Finney1943), VOC repellency is dose-dependent in a logistic relation (sigmoid-shaped; e.g. Vatandoost and Hanafi-Bojd, Reference Vatandoost and Hanafi Bojd2008). The amounts of molecules to which the mites were exposed in the headspace study are unlikely to be comprised in the basal area of the sigmoid-shaped curve (minimum-activity doses). On the other hand, the amount of compounds emitted may become disproportionately low when the dose is reduced due to the antibiotic properties of terpenes and eugenol, which limit the effectiveness of microorganisms in metabolizing them at high concentrations (Michiels et al., Reference Michiels, Missotten, Dierick, Fremaut, Maene and De Smet2008). Nevertheless, a one-shot field experiment with Nor-Mite® suggested a significant effect on the PRM population observed after 15 days of feed supplementation with 500 ppm of Nor-Mite® (Labalette et al., Reference Labalette, Vanden Avenne and Daubner2017a, Reference Labalette, Roussel and Chicoteau2017b).
The persistence of the repellent activity at the individual level, as well as its possible specificity to the mite stages, remains undetermined. Behavioural tests were conducted over a few minutes and on mites undergoing short fasting (a few days). Under farm conditions, where mites only have ‘repellent’ hens available at any time, the need to feed may cause the mite to overcome its repugnance after a while. Furthermore, over generations of the PRM, the effect of selection could lead more or less rapidly to the development of populations that are not very sensitive to modified odours.
How modifications in the composition of hen urine and faeces may impact PRM populations is unknown. The accumulation in manure and dried droppings of the remaining unmetabolized part may affect the mite habitats. Because mites tend to accumulate under dried droppings, such a change in habitat can have more or less significant effects on population dynamics. In addition, to refine our understanding of the mode of action of Nor-Mite®, it would be interesting to study the possible biological activity of ‘reduced VOCs’ (e. g. decane) in the future. These VOCs may have a key role in PRM attraction to host odour (kairomone) and their disruption may act in synergy with the repellent effect of ‘added VOCs’. If so, their study could also pave the way for the development of synthetic attractants and subsequent alternative means of control.
The present preliminary results are important to sanitary solutions when dealing with haematophagous pest arthropods. This finding suggests a new means of control, not only against ectoparasites in livestock and pets but also in human medicine against blood-sucking insects. For instance, some safe dietary supplement might be tested for its ability to modify human body odour, thereby making the skin repellent to host-seeking mosquitoes.
Supplementary material
The supplementary material for this article can be found at https://doi.org/10.1017/S0031182019001379
Acknowledgements
All the experiments were performed at the ‘Plateforme d'Analyses Chimiques en Ecologie’ (PACE), technical facilities of the LabEx CeMEB (Montpellier). The authors would like to warmly thank Pascal Boutinaud and Nathalie Barougier (IRD, Montpellier) for the care provided to the poultry during the experiments and for their valuable advice and Athanasios Angellou (Aristotle University of Thessaloniki, Greece) for the preliminary choice tests and protocol development (Short Term Scientific Mission in the context of COST action F1404 COREMI). We also thank Bruno Buatois at PACE (CEFE) for his tremendous help with the chemical analyses, including the full analysis of all obtained chromatograms, and Rodrigo Mendoza-Sánchez (Chemistry Department, University of Toronto) for his valuable help during the final discussion of the chemical result for inclusion in the manuscript. We would also like to warmly thank the editor in charge of the manuscript, as well as the two reviewers, for their valuable comments and suggestions, which greatly contributed to improving the manuscript.
Financial support
This work was partially supported by Nor-Feed (Beaucouzé, France).
Conflict of interest
None.
Ethical standards
All the experiments involving hens were conducted in compliance with regulations on animal experimentation (reference number of Ethics committee: 036; project number: APAFIS#2339-2015101122029640 v4).