I. INTRODUCTION
Single-walled carbon nanotubes (SWNTs) have continued to attract wide attention due to their extraordinary mechanical, electronic, and optical properties. Reference Tasis, Tagmatarchis, Bianco and Prato1,Reference Casagrande, Imin, Cheng, Botton, Zhitomirsky and Adronov2 Their unique structure, remarkable thermal, electrical conductivity and high mechanical strength make SWNTs viable candidates for a wide range of electrical applications. Reference Kaiser and Skákalová3–Reference Schuettfort, Nish and Nicholas9
Unfortunately, pristine SWNTs are insoluble in all solvents, consequently, they are difficult to process, which hinder the widespread application of these novel nanostructures. Reference Francisco and Daniel10–Reference Yao, Braidy, Gianluigi and Adronov13 Therefore, much research has been devoted to overcoming this problem and a great deal of research has been focused on functionalization of SWNTs, mainly to enhance their solubility and solution phase processability. Reference Tasis, Tagmatarchis, Bianco and Prato1,Reference Banerjee, Hemraj and Wong14,Reference Homenick, Lawson and Adronov15
Considering that chemical functionalization of carbon nanotubes (CNTs) dramatically improves their solubility in a variety of solvents, significant effort has been reported in the development of functionalization strategies, which involves both covalent and supramolecular approaches. Reference Imin, Imit and Adronov12,Reference Imin, Cheng and Adronov16,Reference Cheng, Imin, Maunders, Botton and Adronov17
Previously, there were certain reports about an alternative strategy for functionalization of SWNTs which involves the self-assembly of appropriately functionalized nanotubes on prepatterned surfaces and it could be found that the prepatterning can include the deposition of amine groups (known to induce binding of oxidatively purified nanotubes through acid–base chemistry) by microcontact printing (MCP), dip-pen nanolithography (DPN), and electron beam lithography or by surface charging using an atomic force microscope (AFM). Reference Imin, Imit and Adronov12,Reference Imin, Cheng and Adronov16,Reference Cheng, Imin, Maunders, Botton and Adronov17
Likewise, patterning of biomolecules, such as DNA, has been shown to produce the self-assembly of nanotubes in patterns ordered by electrostatic and specific base-pairing interactions. Reference Tasis, Tagmatarchis, Bianco and Prato1,Reference Imin, Imit and Adronov12–Reference Imin, Cheng and Adronov16 Moreover, the selective binding of nanotubes covalently functionalized with organic acids (hydroxamic acid) to lithographically patterned basic metal oxides has resulted in the fabrication of patterned, aligned nanotube devices with high spatial resolution. Reference Tasis, Tagmatarchis, Bianco and Prato1,Reference Imin, Imit and Adronov12–Reference Abdiryim, Jamal, Zhao, Awut and Nurulla35 Although these methods allow parallel, high-throughput fabrication of nanotube patterns, it can be argued that the complexity of the required equipment, nanotube functionalization, and limited surface compatibility may hinder the widespread adoption of these techniques. Reference Tasis, Tagmatarchis, Bianco and Prato1,Reference Imin, Imit and Adronov12–Reference Cheng, Imin, Maunders, Botton and Adronov17
Recently, it has been shown that conjugated polymers form strong supramolecular interactions with SWNTs, enabling their dissolution in organic solvents by using the supramolecular functionalization methodology. Reference Imin, Imit and Adronov4 Among all conjugated polymers, fluorene or thiophene containing conjugated polymers are of particular interest due to their good solubility and solution stability properties. Reference Imin, Cheng and Adronov16–Reference Singh, Bhatnagar, Mathur, Kaur, Bharadwaj and Pandey19 And in contrast to these conjugated polymers, the CT-type polymers containing electron deficient units such as pyridine and pyrimidine have received less attention.
During our work on conjugated systems, we became interested in pyrimidine based copolymers and their strong supramolecular composites with SWNTs. Compared to the previously reported alkyl thiophene-containing analogues due to the planarity of the fused thiophene rings, the noncovalent functionalization of CNTs with a 2-amino-pyrimidine-containing conjugated polymer has not been reported. It is therefore desirable to develop a detailed understanding of how variations in the backbone or the side chain of a conjugated polymer can affect the interactions between the polymer and the SWNT surface.
In this communication, the selected conjugated polymer (poly(2,5-dihexyl-1,4-phenylene-alt-2-amino-4,6-pyrimidine)) to be the solubilizing agent because the polymer highly soluble in organic solvents and noncovalent functionalization of CNTs with 2-amino-pyrimidine-containing conjugated polymer has not been reported.
Poly(2,5-dihexyl-1,4-phenylene-alt-2-amino-4,6-pyrimidine) exhibits not only strong supramolecular binding to the nanotube surface (wrapping with polymer) which was caused by the synergistic effects of π–π stacking interactions between the SWNT surface and the polymer chains but also the polymer chains were ordered one-dimensionally on the SWNT surfaces in organic solvents. Reference Ikeda, Nobusawa, Hamano and Kikuchi20–Reference Fujigaya, Okamoto and Nakashima37 The imparted solubility and solution-stability properties even after excess polymer is removed from solution.
Compared with common organic solvents such as chloroform, tetrahydrofuran, and n-hexane, DMAc is more environmentally friendly due to its low toxicity. Meanwhile, polyaniline, polythiophene, and polypyrrole could be solved by DMAc to prepare polymer–SWNT–Pt nanoparticle composites for some polymer electrolyte fuel cell (PEFC) systems. Reference Fujigaya, Okamoto and Nakashima37 We believe that it would be also worth understanding the solubility of the polypyrimidine–SWNT composite in DMAc and gathering fundamental information on interactions, since the selected polypyrimidine–SWNT composite contains 2-amino-pyrimidine unit which is probably able to form an electrocatalyst composed of the CNTs, polypyrimidine, and platinum (Pt) nanoparticles, in which polypyrimidine serves as glue for the Pt loading onto the pristine CNTs through the coordination mechanism between the PBI and Pt salt. Reference Fujigaya, Okamoto and Nakashima37
In addition, we further investigate the electrochemical performance of this composite and the effect of the SWNT on capacitance. The polymer was synthesized by the Suzuki reaction between 2-amino-4,6-diiodidepyrimidine and 2,5-dihexyl-1,4-benzenediboronic acid ethylene glycol ester in the presence of (PPh3)4Pd, as depicted in Scheme 1.
The synthetic procedure of the polymer.

II. EXPERIMENTAL
A. Materials
Purified grade SWNTs, prepared by the Hipco method, were purchased from Carbon Nanotechnologies, Inc. (Houston, TX), and used without any further treatment. All other reagents and solvents were purchased from commercial suppliers and used as received.
B. Characterization
Transmission electron microscopy (TEM) analysis was performed on a Hitachi 2600 electron microscope (Tokyo, Japan). Thermogravimetric analysis (TGA) was carried out on a NETZSCH STA 449F3 instrument (Werksbüro Hamburg, Germany) under nitrogen with a temperature range from 30 to 1000 °C and a temperature gradient of 10 deg min−1. Ultrasonication was done in a KQ5200B bath sonicator (KUN SHAN JIANG SU, CHINA). Filtration was done through a 200 nm-pore Teflon membrane (Millipore). UV–Vis spectra were recorded by using a Shimadzu UV-2450 spectrophotometer (Kyoto, Japan). Photoluminescence and excitation spectra were recorded on a HITACHI F-4500 spectrophotometer. Standard four-point-probe measurements were performed under ambient conditions to determine resistance values (resistivity). The working electrode was prepared by mixing the composite, pure polymer, and pristine SWNTs (3 mg) with acetylene black and polytetrafluoroethylene (PTFE) with the weight ratio of 85:10:5, respectively. Reference Zhang, Jamal, Shao and Abdiryim21 The mixture was homogenized, then pressed on a graphite current collector (area: 1 cm2) and dried at 60 °C for 24 h. The working electrode was immersed in 1 M H2SO4 and taken for measurement, the reference electrode was SCE, the counter electrode was Pt, and the supporting electrolyte was 1 M H2SO4 solution. The cyclic voltammetry (CV), galvanostatic charge/discharge tests and cycle stability tests were done in the potential window ranging from −0.2 to 0.8 V in a conventional three-electrode cell using a CHI660C electrochemical workstation. Electrochemical impedance spectroscopy (EIS) was performed by using a Zennium 40084 under the following conditions: AC voltage amplitude 5 mV, frequency range 10−1 to 105 Hz, and open circuit potential.
III. EXPERIMENTAL PROCEDURE
A. The synthesis of copolymer
A solution of 1 (102.79 mg, 0.2936 mmol), 2 (114.41 mg, 0.2936 mmol), Pd (PPh3)4 (17.02 mg, 0.0148 mmol), and Cs2CO3 (481.49 mg, 1.4815 mmol) in 14/7 mL of DME and water was stirred for 6 h at 80 °C under argon. The reaction mixture was cooled to room temperature and precipitated into methanol. The precipitate was filtered, dried, dissolved in chloroform, then re-precipitated from methanol, washed with acetone and isolated in 33.4% yield. 1H NMR (CDC13) d: 6.84–7.90 (m, 3H), 5.04–5.36 (br, d, 2H), 2.79 (br, m, 4H), 1.10–1.76 (m, 22H), 0.86 (t, 6H). UV–Vis (CHC13) λmax: 319 nm.
B. Preparation of polymer–SWNT composite
The supramolecular interaction of the polymer with SWNTs was studied using previously reported methods. Reference Cheng, Imin, Maunders, Botton and Adronov17 In a typical experiment, a SWNT sample (5 mg) was added to a solution of polymer in DMAc (7 mg/3 mL), and the mixture was sonicated for 1 h. Then, the supernatant was filtered through a 200 nm pore diameter Teflon membrane and repeatedly washed with DMAc (5 × 25 mL) to remove all excess polymers. Polymer removal was monitored by measuring the fluorescence of the filtrate, which decreased dramatically with continued washing. Once no fluorescence from the filtrate was observable, it was deemed that all free polymers had been washed out of the nanotube sample. The nanotube residue was then peeled away from the Teflon membrane, added to DMAc (1 mg/0.5 mL), followed by sonication for 30 min to disperse the nanotubes. After sonication, the resulting dark suspension of nanotubes was centrifuged at 5000 rpm for 20 min and allowed to stand undisturbed overnight. Again, the supernatant was carefully transferred by a pipette to a clean vial, and the nanotube solubility in this solution was measured.
IV. RESULTS AND DISCUSSION
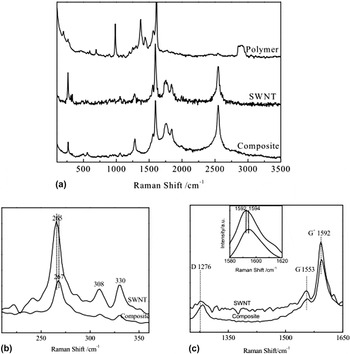
Raman spectra of the polymer, pristine SWNTs and SWNT–polymer composites (Fig. 1) were measured for evaluating the effects of the functionalization. Raman spectra of Hipco SWNTs have been reported by many researchers, and every peak was well assigned. Reference O’Connell, Sivaram and Doorn22–Reference Alley, Liao, Andreoli, Dias, Dillon, Orbaek, Barron, Byrne and Curran24 The presence of a radial breathing mode (RBM) band (265 cm−1), D band (1276 cm−1) and G band (1592 cm−1) confirms the presence of SWNTs inside the composite [Fig. 1(a)]. Due to higher Raman intensity of SWNT bands, typical Raman bands of the polymer (e.g., C=N vibration 1369 cm−1, C–C vibration 1610 cm−1) are not observed in SWNT–polymer composites. Reference Balachandran, Lakshmi and Janaki25,Reference Bibekananda, Ajeong and Yung26
Raman spectra of pure polymer, pristine SWNTs, and SWNT–polymer composites. (a) Signals of the samples between 100 and 3500 cm−1; (b) magnified view of the RBM signals between 210 and 360 cm−1; (c) magnified view of the signals around the D peak and G peak, inset is a magnified view of the signals between 1580 and 1620 cm−1.

It is well known that noncovalent sidewall functionalization of nanotubes results in the upshift of the RBMs. Reference Panhuis, Kane, Moulton, Innis and Wallace27 The degree of the upshift depends on whether the nanotubes are separated (de-bundled) or in contact with each other. Reference Kerry, Simon and Gordon28 SWNT–polymer composite spectra show a slight upshift of RBM frequencies of approximately 2 cm−1 compared to the pristine SWNT [Fig. 1(b)]. Upshifts in the RBM of SWNT dispersions have been observed for polymers Reference Dalton, Stephan, Coleman, McCarthy, Ajayan, Lefrant, Bernier, Blau and Byrne29 and peptides Reference Dieckmann, Dalton, Johnson, Razal, Chen, Giordano, Muñoz, Musselman, Baughman and Draper30 and are attributed to the partial intercalation of these molecules into the SWNTs. Reference Kerry, Simon and Gordon28
When comparing the D and G bands of SWNT–polymer composites with those of pristine SWNTs [Fig. 1(c) and inset], no new bands are formed, but it is observed that in the presence of polymer, the intensity of the most intense peak at the higher frequency (G+) decreases and shows a slight blue shift (from 1592 to 1594 cm−1), the peak of G− shows a blue shift of 3 cm−1 (from 1554 to 1557 cm−1) and the peak of D shows a blue shift of 7 cm−1 (from 1276 to 1283 cm−1). This is expected as it is consistent with other results for SWNT/polymer, such as SWNTs in epoxy and polyurethane acrylate matrices. Reference Zhao, Wood and Wagner31–Reference Zhao, Tannenbaum and Jacob33 Meanwhile, the l(G)/l(D) of the composite (1.24) was lower than pristine SWNTs (1.62), which indicated that noncovalent functionalization of SWNTs probably damaged the nanotube structure to some extent (maybe caused a short-cutting of nanotubes) and decreased its conductivity.
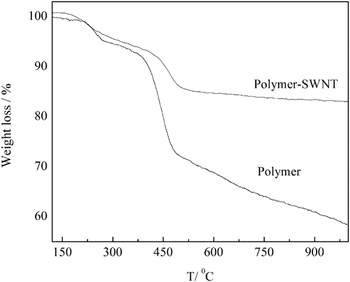
The polymer content was calculated by TGA, which provided the weight fraction of the polymer. TGA data for the free polymer, as well as the corresponding polymer–nanotube composite, are provided in Fig. 2.
TGA data of pure polymer and polymer–SWNT composite.

The polymer depicted good thermal stability with an onset of degradation greater than 210 °C. The first mass loss for the polymer occurs at 210–280 °C, corresponding to the loss of NH2 within this polymer. Indeed, the observed mass-loss value of 4.9% is in agreement with calculated weight percentage for the NH2 within this polymer of 4.7%. The major mass loss occurs at 280 ∼ 1000 °C, however, the observed mass-loss values of 36.8% were not in agreement with calculated weight percentages for the alkyl side chains of 48.4% and which indicates that the alkyl side-chains adjacent to phenyl did not gradually thermally break down completely and the char yield of polymer in a nitrogen atmosphere was high even at 1000 °C, due to the stability of the conjugated backbone. The remaining weights at 1000 °C of the pure polymer and composite were about 58.4 and 83.1%, respectively. On the basis of the observed thermograms, the polymer content in the polymer–nanotube composite could be calculated to be 40.6%.
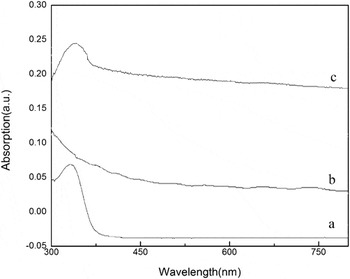
The supramolecular interaction of the polymer with SWNTs was further investigated by UV–Vis absorption spectroscopy.
Figure 3 depicts the spectra of the polymer [Fig. 3(a)], SWNTs (measured in an aqueous solution using sodium dodecyl sulfate as a surfactant) [Fig. 3(b)] and the polymer–SWNT composite [Fig. 3(c)] measured at room temperature in DMAc. From comparison, it is clear that the absorption characteristics of both polymer and SWNTs are evident in the polymer–SWNT absorption spectra. The polymer and composite exhibited an absorption maximum (λmax) of 332 nm and 339 nm in DMAc, respectively, and the composite depicted a bathochromic shift. This shift may arise from an increased effective conjugation length within the polymers, caused by a more planar structure of their backbone after they have interacted with the SWNT surface. Alternatively, the bathochromic shift may also be due to the π-stacking interaction, resulting in delocalization of π-electrons onto the SWNT surface. Reference Cheng, Imin, Maunders, Botton and Adronov17 It was found that, using polymer, it was possible to produce a homogeneous and dark solution even after removal of the excess free polymer, as described above. This indicates that the majority of adsorbed polymer does not desorb from the nanotube surface once it is bound, and the π-stacking interaction between the polymer and the nanotube surface is strong enough to prevent reaggregation of nanotubes into large bundles. Nanotube solubility was initially quantified using a spectrophotometric method in which a specific extinction coefficient for SWNTs at 700 nm (ε700 = 2.35 × 104 cm2 g−1) was utilized. Reference Ikeda, Nobusawa, Hamano and Kikuchi20 From these measurements, it was found that the polymer–SWNT composite exhibited certain solubility in DMAc, where the solubility in the absence of excess free polymer solution (78.7 mg L−1) was lower than the fluorene-based conjugated polymer–SWNT composite (603 mg L−1). Reference Cheng, Imin, Maunders, Botton and Adronov17 It should be noted that other carbonaceous materials (amorphous carbon, turbostratic graphite, etc.) may be present in these solutions, augmenting our solubility values. However, the purified grade of the SWNT sample used, our TEM and scanning electron microscopy (SEM) data, and relevant reports suggest the amount of such nonnanotube material is negligible. Reference Cheng, Imin, Maunders, Botton and Adronov17
UV–Vis absorption spectra of pure polymer (a), pristine SWNTs (b), and composite (c).

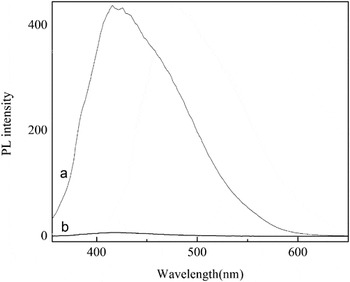
The fluorescence spectra of the pure polymer (a) and polymer–SWNT composite (b) were also measured (Fig. 4).
Emission spectra of pure polymer (a) and polymer–nanotube composite (b).

According to the literature, the quenching efficiency was measured to be 98% which again indicated that the polymer exhibits a strong interaction with CNTs. The fluorescence quenching is likely a result of photo-induced energy or electron transfer between the excited conjugated polymer and the SWNTs. Reference Cheng, Imin, Maunders, Botton and Adronov17 Meanwhile, there were no obvious shifts in the λmax values of emission spectra from the polymer–nanotube composite relative to the free polymer and it is consistent with previously reported literature. Reference Cheng, Imin, Maunders, Botton and Adronov17 The small amount of free polymer that has desorbed from the nanotube surface and likely formed a dynamic equilibrium with bound polymer is the main cause of producing the emission of the polymer–nanotube composite. Reference Cheng, Imin, Maunders, Botton and Adronov17
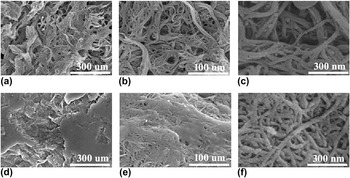
Microstructural characterization of pristine SWNTs and polymer–SWNT composites was performed using SEM. From Figs. 5(a) and 5(b), the SWNTs exhibit an entangled network structure composed of many flexible nanofibers. From Figs. 5(d) and 5(e) the surface of the composite became smoother and the diameters were larger than SWNTs because there were certain polymers on the SWNTs. From Figs. 5(c) and 5(f) diameter analysis indicated that most of the SWNTs in the bundle state and composite have mean diameters of approximately 12–22 and 26–31 nm, respectively.
SEM images of pristine SWNTs (a–c) and composite (d–f). Magnification times of images vary from 15 (a and d) to 45 (b and e), and to 150 (c and f).

From Figs. 5(a) and 5(c), it is possible to observe Fe catalyst particles on the bare SWNTs and from Figs. 5(d) and 5(f) it is clearly seen that SWNTs as well as Fe catalyst particles are underneath the polymer coating, the large amount of polymer present hinders our ability to discern Fe catalyst particles on nanotubes.
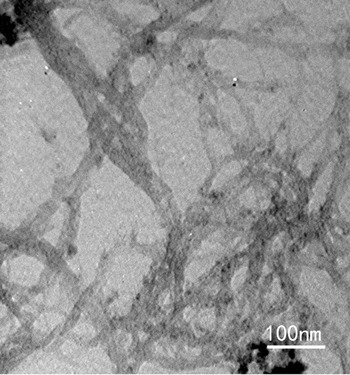
The composite was also observed by TEM. The sample was prepared by dispersing suspensions of the polymerized nanotubes onto a holey carbon-coated copper grid, diminishing the contrast between the nanotube features and the carbon background. Using TEM, it is also possible to observe features corresponding to nanotube fibers that are coated with the polymer and revealed that the SWNT surface was coated by several polymer chains (Fig. 6).
TEM image of the polymer–SWNT composite.

These images provide evidence that the composite fibers observed by SEM and TEM were composed of single SWNTs coated with the polymer.
The conductivity properties of the polymer–SWNT composite were evaluated by measuring the resistance of thin films made from this material. According to previously reported methods involving vacuum filtration of the nanotube solutions through a 200 nm pore diameter Teflon membrane, Reference Cheng, Imin, Maunders, Botton and Adronov17 the thin film was prepared. Briefly, the purified polymer–SWNT composite in DMAc solution was carefully poured into the filtration apparatus, avoiding bubble formation on the solution surface. Each solution was filtered and washed with THF (5 × 25 mL), after which the residue was allowed to air-dry while pulling vacuum on the sample for 24 h. The film was then subjected to further drying in a vacuum oven at 50 °C for 3 days. Standard four-point-probe measurements were performed under ambient conditions to determine resistance, which could be converted to resistivity after determination of film thickness and surface area according to Eq. (1), and converted to conductivity (σ) according to Eq. (2),
 $$\rho = {{RS} \mathord{\left/ {\vphantom {{RS} t}} \right. \kern-\nulldelimiterspace} t}\quad {\rm{,}}$$
 $$\sigma = {1 \mathord{\left/ {\vphantom {1 \rho }} \right. \kern-\nulldelimiterspace} \rho }\quad {\rm{.}}$$
where R is the resistance in Ω (R = 12.63 Ω), S is the surface area in cm2 (S = 0.2778 cm2), and t is the film thickness in cm (t = 0.018 cm), ρ is the resistivity in Ω cm, and σ is the conductivity in S cm−1. The SWNT composite exhibited a conductivity of 0.005 S cm−1 which was lower than fluorene-based conjugated polymer–SWNT composite (34 S cm−1) and this may indicate that the electrochemical performance of the present composites was mainly affected by the polymer inherent electrochemical activity. Reference Tasis, Tagmatarchis, Bianco and Prato1,Reference Imin, Imit and Adronov12–Reference Cheng, Imin, Maunders, Botton and Adronov17 On the basis of this measurement, it was found that the supramolecular polymer–nanotube composite can be used to produce a homogeneous film having conductivities. The lower conductivity of the polymer–SWNT composite is not surprising, considering that these samples are composed of approximately 41% polymer.
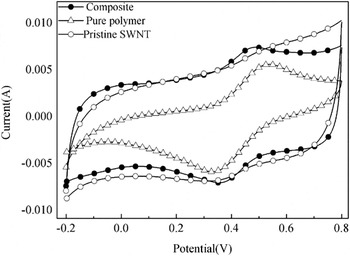
Figure 7 shows CV curves of the composite, pure polymer and pristine SWNTs at the scan rate of 50 mV s−1 in 1 M H2SO4. From the comparison of cyclic voltammograms, the anodic and cathodic peak potentials of the pure polymer and composite were observed at almost the same position (0.47 and 0.37 V, respectively) and no obvious peaks were observed for pristine SWNTs. It was found that the composite has a larger rectangular area which suggests that the composite has better electroactivity and higher capacitance than the polymer.
Cyclic voltammograms of pure polymer, pristine SWNTs, and composite at a scan rate of 50 mV/s.

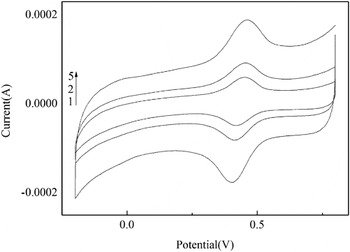
In detail, CV of the composite was performed from −0.2 to 0.8 V at different scan rates in 1 M H2SO4. The cyclic voltammograms of the composite clearly exhibit the reversible characteristic broad redox wave at 0.47 V (broad, oxidation), and 0.40 V (broad, reduction) as shown in Fig. 8. The electrochemical behavior of the composite depicts facile p-doping and good charge transport properties attributable to the presence of the easily protonated pyrimidinyl unit. Reference Mamtimin, Matsidik and Nurulla34 It is seen that electro-chemical oxidation (or p-doping) starts at about 0.28 V versus SCE and the anodic peak for the composite in the 0.2–0.5 V region is similar to that previously reported for polypyrimidine. Reference Mamtimin, Matsidik and Nurulla34
Cyclic voltammograms of the composite at different scan rates. From inside to outside, scan rates are 1, 2, and 5 mV/s, respectively.

This also indirectly proved that the composite contained a certain amount of pyrimidine based copolymer. The p-doping state was correlated with the protonated pyrimidine ring induced by electron-deficient nature (Scheme 2).
p-doping and n-doping of the copolymer.
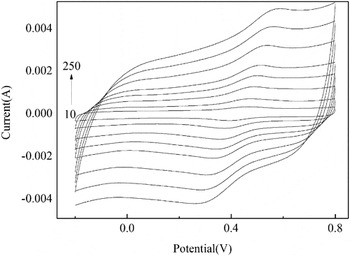
Cyclic voltammograms of the SWNT composite were obtained at different scan rates. The dependence of the anodic peak currents on the scan rates (between 10 and 250 mV s−1) is shown in Fig. 9.
Scan rate dependence of the composite in 1 M H2SO4 solution. From inside to outside, scan rates are 10, 25, 50, 75, 100, 150, 200, and 250 mV/s, respectively.

The composite is electrochemically active in anodic regions. The current was proportional to the scan rate indicating that the film was well adhered and the charge transfer process was not dominated by diffusion.
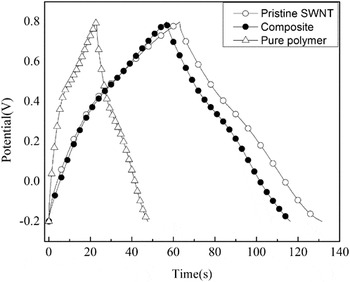
Figure 10 shows the galvanostatic charge/discharge curves of the composite, pure polymer, and pristine SWNTs at a current density of 3 mA cm−2. The specific capacitance of the electrode material can be calculated by means of SC = (I × Δt)/(ΔV × m), I is the charge/discharge current, Δt is the discharge time, ΔV is the electrochemical window (1 V), and m is the mass of the active material within the electrode (3 mg). Reference Abdiryim, Jamal, Zhao, Awut and Nurulla35 The specific capacitances of the electrode calculated from Fig. 10 are as follows: 24.7 F g−1 (polymer), 59.5 F g−1 (composite), and 67.9 F g−1 (SWNTs). It is observed that the composite had good electrochemical capacitance performance than the polymer. This is in good agreement with CV results.
Galvanostatic charge/discharge curves of the pure polymer, pristine SWNTs, and composite at the current density of 3 mA cm−2.

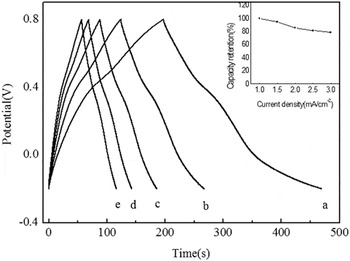
Figure 11 displays the galvanostatic charge/discharge curves of the SWNT composite at current densities of 1 mA cm−2, 1.5 mA cm−2, 2 mA cm−2, 2.5 mA cm−2, and 3 mA cm−2 in a three-electrode system between −0.2 V and 0.8 V; the supporting electrolyte is 1 M H2SO4.
Galvanostatic charge/discharge curves of the composite at the current densities of 1 mA cm−2, 1.5 mA cm−2, 2 mA cm−2, 2.5 mA cm−2, and 3 mA cm−2.

In Fig. 11, the curves behave as a mirror-like during the charge–discharge process at various current densities; it means that the composite modified graphite electrode has good electrochemical capacitance performance in acidic electrolytes. Reference Abdiryim, Jamal, Zhao, Awut and Nurulla35 The specific capacitances of the electrode calculated from Fig. 11 are as follows: 90.7 F g−1 (1 mA cm−2), 71.6 F g−1 (1.5 mA cm−2), 64.9 F g−1 (2 mA cm−2), 61.8 F g−1 (2.5 mA cm−2), and 59.5 F g−1 (3 mA cm−2). The variations in the capacity retention as a function of the current density are plotted in the inserted image. Although the SC of this composite slowly decreases with the increase of current density in 1 M H2SO4 shown in Fig. 11, the corresponding capacitance retention ratio still reaches approximately 79% with the increase of current densities from 1 to 3 mA cm−2, indicating this composite electrode material can be maintained under high power operations. It can be seen that all the charge–discharge curves are not ideal straight lines, indicating the process of a faradic reaction. Reference Abdiryim, Jamal, Zhao, Awut and Nurulla35
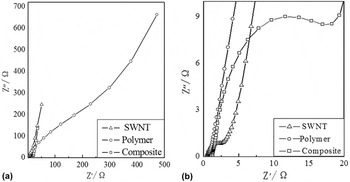
EIS has been widely used to study the electrochemical behavior of the electrode at the electrode/electrolyte interface. Typical Nyquist plots for the pure polymer, pristine SWNTs and composite are shown in Fig. 12. At high frequencies in the impedance spectra of the polymer, there was a large deviation from the capacitive line (Z″ axis) that resulted in the low conductivity of the polymer [Fig. 12(a)]. It can be seen from Fig. 12 that the impedance spectra of the composite and pure SWNTs are composed of two well-separated patterns. One semicircle at high frequency end is followed by a linear part at the low-frequency end. Reference Aminam, Ruxangul, Adalet, Awut, Nurulla and Abdiryim36 Firstly, in high frequency intercept of the semicircle with the real axis, an internal resistance (Rs) can be observed; it can be used to evaluate the value of internal resistance, which includes the resistance of the electrolyte solution, the intrinsic resistance of the active material, and the contact resistance at the interface active material/current collector. Reference Aminam, Ruxangul, Adalet, Awut, Nurulla and Abdiryim36 Its values are approximately 1.307 Ω (composite) and 0.475 Ω (SWNTs). It is clear that the internal resistances of the SWNTs are relatively lower than the composite. Clearly, the introduction of a nonconducting polymer has decreased the conductivity of the composite electrode and the resistance of the composite was increased. This is in good agreement with conductivity measurements. Secondly, in the medium-to-low frequency region, the semicircle can be discovered, as shown in Fig. 10, the radius of the semicircle expressing the electron conductivity of the electrode, and the values of the samples are 9.02 Ω (composite) and 0.856 Ω (SWNTs), revealing Faradic charge-transfer resistance (Rct). It can be seen that the composite shows a better capacitive behavior than the polymer.
The Nyquist plots (a) and enlarged figure (b) of pure polymer, pristine SWNTs, and composite electrode in 1 M H2SO4 solution.

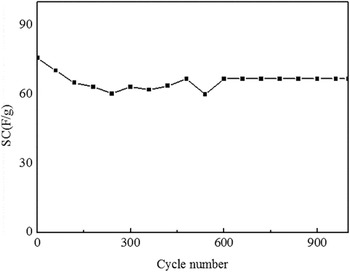
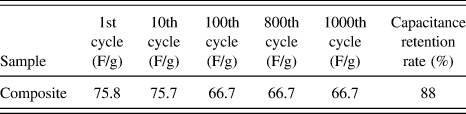
Galvanostatical charge/discharge tests were also used to investigate the cycle stability of the polymer–SWNT composite examined for up to 1000 cycles at a current density of 1 mA cm−2. The discharge specific capacitance as a function of cycle number is given in Fig. 13. And the specific capacitance and retention rate of the composite at given cycles are listed in Table I. A rapid change in SC was observed during the initial 100 cycles, the capacitance value of 75.8 F g−1 at the beginning of cycling gradually decreases to 66.7 F g−1 at the 100th cycle, the SC decreases to 88%, and the value of 66.7 F g−1 remains stable over further cycling to 1000 at a current load of 1 mA cm−2. The excellent cycle stability of the composite was attributed to the strong interlayer interaction between the SWNTs and the conjugated polymer chains. Due to synergistic effects of SWNTs and polymer, the composite has certain electrochemical activity. Reference Zhang, Jamal, Shao and Abdiryim21
Cycle stability curve of the composite in 1 M H2SO4 at the current density of 1 mA cm−2.

The specific capacitance of the composite at given cycles and retention rates.

V. CONCLUSIONS
In conclusion, a pyrimidine-based conjugated polymer was synthesized and used to prepare the polymer–SWNT composite. The conjugated polymer was found to form a strong supramolecular composite with SWNTs. The composite exhibited certain solubility in DMAc, where the solubility in the absence of excess free polymer solution is 78.7 mg L−1. TGA indicated that the polymer–nanotube composite was composed of 41 wt% polymer. SEM and TEM demonstrate that SWNTs were uniformly coated with the polymer. The introduction of SWNTs made a contribution to improving the electrochemical properties of the polymer. It was shown that the noncovalent functionalization did not damage the nanotube structure and almost retained its inherent properties. The high solubility of the supramolecular polymer–nanotube composite opens the door to their application in a variety of fields.
Supplementary Material
To view the supplementary material for this article, please visit http://dx.doi.org/jmr.2014.318.
ACKNOWLEDGMENTS
The authors gratefully acknowledge the support from the Key Laboratory of Oil and Gas Fine Chemicals, Ministry of Education and Xinjiang Uyghur Autonomous Region, College of Chemistry and Chemical Engineering, Natural Science Foundation of Xinjiang University and National Natural Science Foundation of China (Grant Nos. 21164012, 51363020, XJDX0908-2010-07, BS110116).