I. INTRODUCTION
Recently, long persistent phosphors (LPP) have attracted a lot of attention due to their interesting optical phenomenon that can emit light for a long time after removal of the excitation source. Reference Bessière, Sharma, Basavaraju, Priolkar, Binet, Viana, Bos, Maldiney, Richard, Scherman and Gourier1–Reference Matsuzawa, Aoki, Takeuchi and Murayama3 Such a unique phenomenon possesses many advantages such as energy saving, environmentally friendly, and recyclable; therefore, it can be widely applied in various fields, such as but not limited to, decoration, emergency signs, traffic signs, emergency exit indicators, low level lighting, imaging storage, detection of high energy rays, etc. Reference Sun, Xie, Guan and Zhang4–Reference Allix, Chenu, Véron, Véron, Poumeyrol, Kouadri-Boudjelthia, Alahraché, Porcher, Massiot and Fayon9 Generally, emitter and trap are the most important functional centers in LPP. Traps are produced by the defects in the doping and synthesis process, usually do not emit radiation by themselves, instead they store excitation energy which can be gradually released under thermal or other physical stimulations and then be transferred to the emitters. Emitters are mostly rare earth ions or transition metals ions such as Pr3+, Tb3+, Eu3+, Eu2+, Sm3+, Dy3+, Ce3+, Mn2+, and Cr3+, etc., Reference Fu, Zhou and Zhang10–Reference Yukihara and McKeever12 which are capable of emitting radiation after being excited. Herein, Pr3+ ions, which can produce light emitting or long afterglow (LAG) via f–f transition in the blue, green, red regions depending on the crystal lattice of hosts for luminescence materials, were chosen as the luminescence activators for LPP in this work.
With the exploration of luminescent materials, more and more matrixes have been reported, consisting of silicates, aluminum, stannates, borates, phosphates, titanates, sufides, molybdates, tungstate, and vanadates etc. Reference Qi, Shi, Liu, Zhou, Luo, Zhang and Xie13–Reference Kang, Yang, Peng, Wondraczek, Ma, Zhang and Qiu16 But there are few related reports about tantalite. The tantalite compound is currently playing an important role in the field of photocatalysis, where it is used to decompose water molecules into H2 and O2 molecules. Reference Zhang and Zhu17–Reference Noto, Yagoub, Ntwaeaborwa and Swart19 Recently, layered perovskite Sr2Ta2O7 has attracted much attention owing to its excellent photocatalytic performance. Reference Liu, Nisar, Ahuja and Pathak20,Reference Mukherji, Seger and Lu21 However, to the best of our knowledge, researches on the luminescence of Sr2Ta2O7 have never been reported yet.
Therefore, in this paper, we are reporting the photoluminescence and LAG properties of blue emission LPP of Pr3+ by using Sr2Ta2O7 as host material for our phosphor.
II. EXPERIMENTAL SECTION
A. Sample synthesis
A serial of Sr2(1−x)Ta2O7:xPr3+ (x = 0, 0.001, 0.0025, 0.005, 0.0075, 0.01, 0.02, 0.025, 0.03, and 0.035 mol, which were denoted as samples S0–S10, respectively) samples were synthesized via a solid-state reaction method. Initially, stoichiometry amounts of SrCO3 (Aladdin, A.R), Ta2O5 (Aladdin, A.R), and Pr6O11 (Aladdin, 99.99%) were weighed out according to the formula above, and meanwhile 3 mol% H3BO3 was used as flux. And then the powders were mixed thoroughly in an agate mortar for 1 h. After that, the homogeneous mixtures were transferred into corundum crucibles and calcined at 1250 °C for 6 h in a tube furnace under ambient atmosphere. After cooling to room temperature naturally, the as-obtained samples were ground into powder for the consequent measurements.
B. Characterization
The crystalline structures of all prepared samples were identified by means of a XD-2 x-ray diffractometer (PGENERAL, Beijing, China) with Cu Kα irradiation (λ = 1.5406 Å) at a scanning stepping of 0.02° in the 2θ ranging from 10° to 70°. The absorption spectra were measured by U-3900 Spectrophotometer (Hitachi Corporation, Tokyo, Japan). The photoluminescence excitation (PLE) and emission (PL) spectra were measured by a F-7000 Fluorescence Spectrophotometer (Hitachi Corporation) with 2.5 nm slit width and 1200 nm/min scanning rate under 400 V. The afterglow spectrum of typical sample was also measured with the Hitachi F-7000. The decay curves were obtained with a GFZF-2A single-photon counter system (CNNC Beijing Nuclear Instrument Factory, Beijing, China). A FJ427A1 thermoluminescent dosimeter (CNNC Beijing Nuclear Instrument Factory) was applied to measure the thermoluminescence (TL) glow curves. All samples to be measured in decay and TL measurements were weighed in 0.2 g and 0.005 g, respectively. Prior to the TL measurements, each sample was excited for 1 min with a low pressure mercury lamp (254 nm) followed with different delaying time in dark.
III. RESULTS AND DISCUSSION
A. Phase identification
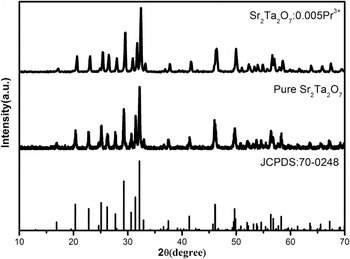
Figure 1 shows the typical X-ray diffraction (XRD) patterns of Sr2Ta2O7:Pr3+ (x = 0, 0.005) samples. Clearly, the main diffraction peaks could be exactly indexed to the phase of Sr2Ta2O7 registered in JCPDS file No. 70-0248. No detectable impurity phases were observed in all obtained phosphors, indicating that the Pr3+ has been successfully incorporated into the host lattice and without significantly changing the crystal structure.
XRD patterns of samples Sr2Ta2O7 and Sr2Ta2O7:0.005Pr3+.

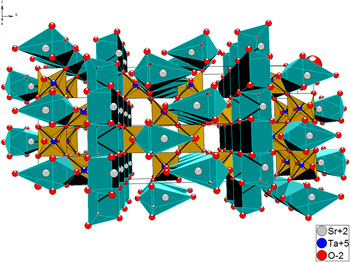
The crystal structure of Sr2Ta2O7, shown in Fig. 2, was covered to be orthorhombic system [space group Cmcm (63)] with lattice constants a = 3.937 Å, b = 27.198 Å, c = 5.692 Å, V = 609.49 Å3, and Z = 4. Reference Ishizawa, Marumo, Kawamura and Kimura22,Reference Ishizawa, Marumo and Iwai23 As shown in Fig. 2, both the Sr2+ and Ta5+ site is coordinated with six oxygen ions. This structure is formed by SrO6 4− and TaO6 6− octahedron in which TaO6 octahedron is connected by corner sharing and there are two symmetrically different sites for strontium. The ionic radii of Sr2+ and Ta5+ are 1.18 Å and 0.64 Å, respectively. The ionic radii for six-coordinated Pr3+ is 0.99 A. Considering the ionic radii and valence between the doped and substituted ions, the trivalent praseodymium ions replaces the divalent Sr2+ ions with the charge imbalance, and resulting in the generation of vacancies.
The crystal structure of Sr2Ta2O7.

B. Absorption spectra and photoluminescence properties of undoped Sr2Ta2O7
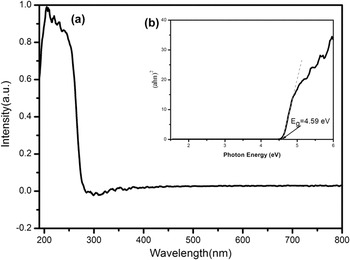
Figure 3(a) presents the absorption spectra of pure Sr2Ta2O7. In the spectra of Sr2Ta2O7, there appears a strong absorption in the wave length range of 190–300 nm. This band is due to the host absorption. The optical band gap of Sr2Ta2O7 can be calculated according to the following equation:
 $${\left( {\alpha h\nu } \right)^2} = A\left( {h\nu - {E_{\rm{g}}}} \right)\quad .$$
(a) Absorption spectrum of undoped Sr2Ta2O7; (b) (αhν)2 versus photon energy hν.

In which α is absorption coefficient, A is the absorption constant, ν is the light frequency, h is Planck's constant, E g is the optical band gap, and hν is the photon energy. The α and ν values at the steep edges of the absorption spectra are used to construct the plots of (αhν)2 against hν. As depicted in the inset of Fig. 3(b), the curve for Sr2Ta2O7 shows a linear region and a tangent line is drawn in the near edge region of the obtained curve. The band gaps of samples can be determined by intersection of the tangent line with the energy axis, and the value is calculated to be E g = 4.59 eV.
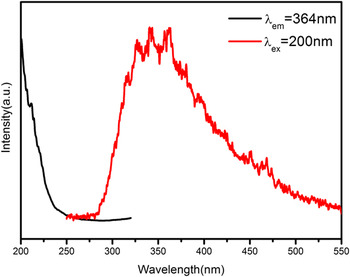
Figure 4 shows the PLE (λem = 364 nm) and PL (λex = 200 nm) spectra of undoped Sr2Ta2O7. There can be seen a broad nonsymmetrical band range from 200 to 400 nm in the PL spectrum, which can be ascribe to the defects in host lattice. It indicates that Sr2Ta2O7 is a self-activated luminescent matrix. The PLE spectrum was not measured completely because it is beyond the detectable wave length range of the spectrometer.
PL and PLE spectra of pure Sr2Ta2O7 (λex = 200 nm, λem = 364 nm).

C. Luminescence properties of Pr3+-doped Sr2Ta2O7
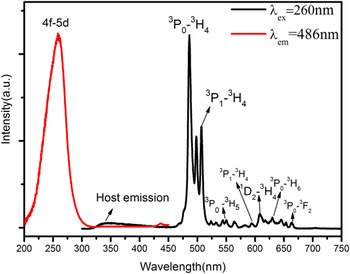
As an example, the PLE and PL spectra of Sr2Ta2O7:0.01Pr3+ are presented in Fig. 5. The PLE spectra exhibit a broad band ranging from 200 to 300 nm peak at 260 nm which is attributed to the 4f–5d transition of Pr3+ when monitoring emission at 486 nm. Another is in the wave length range of 420–440 nm with a very weak sharp peak which is due to the 4f–4f transitions in Pr3+. When excited by 260 nm, it is obvious that the emission spectrum is composed of a weak broad band in the wave length range of 300–400 nm and several stronger sharp peaks between 450 and 700 nm. It is evident that the weak broad band ultraviolet emission is in agreement with the Sr2Ta2O7 host emission mentioned above. While several sharp emission peaks can be observed which are attributed to the characteristic 4f–4f transitions of Pr3+. The blue spectral lines observed at 486 and 498 nm are attributed to two manifolds of 3P0–3H4 level, Reference Noto, Chithambo, Ntwaeaborwa and Swart24 which can be ascribed to the crystal field interaction. The green emission is observed at range from 500 nm to 578 nm, which are assigned to 3P1–3H4 and 3P0 → 3H5 transitions, respectively. The peak at ∼507 is assigned to 3P1–3H4 transition, while those at 533, 547, and 566 nm are attributed to three manifolds of 3P0–3H5 level. The red emission lines observed at 594, 608, 630, and 657 nm can be designated to transitions of 3P1–3H6, 1D2–3H4, 3P0–3H6, and 3P0–3F2, respectively. Apparently, the blue emission from the 3P0–3H4 transition is glowing brighter than the red emission from 1D2–3H4, 3P0–3H6, and 3P0–3F2 transitions.
PL and PLE spectra of the Sr2Ta2O7:0.01Pr3+ phosphor obtained by solid-state reaction.

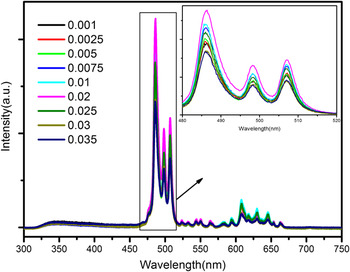
Figure 6 depicts the PL (λex = 260 nm) spectra of the Sr2Ta2O7:xPr3+ phosphors with different concentrations of Pr3+ (ranging from 0.001 to 0.035) at room temperature. As presented in Fig. 6, the emission spectra of all samples have no obvious changes in the spectral configuration except for the emission intensity. As shown in the inset, it is noticeable that the PL intensity of Sr2Ta2O7:xPr3+ reaches a saturation point at x = 0.02 mol. After that, the PL intensity begins to decline dramatically owing to the concentration quenching effect.
PL spectra for the Sr2Ta2O7:xPr3+ (x = 0.001, 0.0025, 0.005, 0.0075, 0.01, 0.02, 0.025, 0.03, and 0.035) phosphors, and the inset shows enlarged excitation spectra in the range from 480 to 520 nm for samples S1–S9.

To investigate the concentration quenching effect, the critical distance (R c) between Pr3+ ions can be rough estimated using concentration quenching method proposed by Blasse and Grabmaier as follows Reference Blasse25 :
 $${R_{\rm{c}}} \approx 2{\left( {{{3V} \over {4\pi {x_{\rm{c}}}N}}} \right)^{{1 \mathord{\left/ {\vphantom {1 3}} \right. \kern-\nulldelimiterspace} 3}}}\quad ,$$
where V is the volume of the unit cell, x c is the critical concentration, and N represents the formula units in the unit cell. In this work, the values of V and N for Sr2Ta2O7 are 609.49 Å3 and 4, respectively. And x c is experimentally to be 0.02 mol. Therefore, the critical distance R c was calculated to be 24.41 Å.
It is accepted that concentration quenching can be ascribed to energy transfer that include two main aspects: one is the exchange interaction, and the other one is multipolar interaction. It is known that if in the case of the exchange interaction between Pr3+ ions, the critical distance between the sensitizer and activator should be shorter than 5 Å. Since the critical distance calculated is considerably greater than 5 Å in the crystalline Sr2Ta2O7 host. Consequently, the concentration quenching mechanism may take place by electric multipolar interaction among Pr3+ ions.
Thus, the electric multipolar interaction is dominant between Pr3+ ions. According to Dexter's energy transfer formula of multipolar interaction, the following equation can be given Reference Dexter and Schulman26,Reference Ozawa and Jaffe27 :
 $${I \over X} = {K \over {1 + \beta {{\left( X \right)}^{{\theta \mathord{\left/ {\vphantom {\theta 3}} \right. \kern-\nulldelimiterspace} 3}}}}}\quad .$$
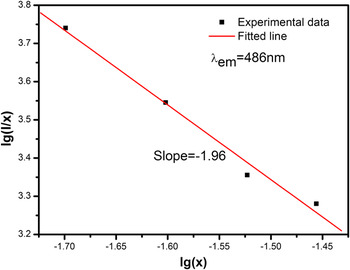
Here, I is the emission intensity, X is the concentration of activator, K and β are constants under the same excitation condition in the same matrix. The value of θ equals to 6, 8, or 10 corresponding to the dipole–dipole, dipole–quadrupole, or quadrupole–quadrupole interactions of the concentration quenching mechanism, respectively. The log(I/X)/log(X) plot was depicted in Fig. 7. The dependence of log(I/X) on log(X) was found to be linear, and the slope of the straight line is −1.96. Thus, the value of θ is found to be very close to 6, which indicates that the dominant concentration quenching mechanism of Pr3+ emission in the Sr2Ta2O7:Pr3+ phosphor is dipole–dipole interaction.
The dependence of log(I/x) on log(x) based on Eq. (3).

D. LAG decay characterization of Sr2Ta2O7:Pr3+
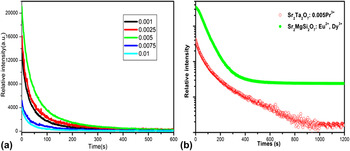
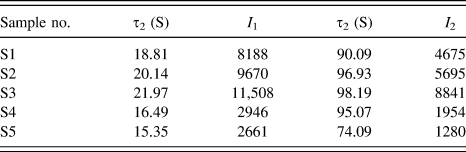
The afterglow decay curves of samples S1–S5 are presented in Fig. 8. As displayed in Fig. 8, the decay speed was very fast at the initial state, which mainly ascribe to the shallower traps release the carriers with a faster rate, and later a slow decay process was achieved owing to charge carriers in traps with deeper depth released at a slower rate. In this work, the experimental decay curves can be well fitted with a biexponential Eq. (1) as follows:
 $$I = {I_1}\,\exp \left( { - {t \over {\tau {}_1}}} \right) + {I_2}\,\exp \left( { - {t \over {{\tau _2}}}} \right)\quad ,$$
where I is phosphorescence intensity; I 1 and I 2 are constants; t represents the decay time; τ1 and τ2 that determine the rapid and slow decay process, respectively, are decay times for the exponential components. The fitting results are listed in Table I. Obviously, S3 shows the best LAG performance. It can be concluded that the optimal concentration of Pr3+ is 0.5 mol% judging from the highest emission intensity and slowest decay rate. To measure the LAG properties of Sr2Ta2O7:Pr3+ phosphor, the comparison with state of the art phosphor Sr2MgSi2O7:Eu2+,Dy3+ is made. As shown in Fig. 8(b), both the initial brightness of LAG and duration of Sr2Ta2O7:Pr3+ cannot be comparable to that of commercial Sr2MgSi2O7:Eu2+,Dy3+. Indeed, further studies to optimize preparation conditions to improve the initial brightness and duration of this phosphor are under our consideration.
(a) LAG decay curves for samples S1–S5. (b) The LAG decay curves of Sr2Ta2O7:0.005Pr3+ and the commercial phosphor Sr2MgSi2O7:Eu2+,Dy3+ in exponential axis.

Simulated result for the afterglow curves of samples S1–S5.

E. TL properties analysis
Theoretically, LAG is attributed to the presence of traps, which are capable of capturing charge carriers (electron or hole trap) under UV-irradiation and then immobilizing these trapped charge carries under thermal disturbance or other physical stimulation for appropriately long time after the removal of UV-irradiation. Reference Che, Liu, Li, Xu, Liu and Wang28 Generally speaking, LPP with suitable trap depth and high trap density usually exhibit excellent LAG performance. As known, LAG is a temperature-dependent process and traps play an important role in LPP materials. Therefore, to further investigate the trapping centers, TL technique, one of efficient ways to detect some valuable information about the nature of traps, was performed. TL glow curve was often used to analysis of the trap depth and concentration of carriers that are the main determinants of LAG behavior. Typically, the intensity of the TL glow curve is related to the amount of trapped charge carriers, and the maximum temperature of the TL peak provides information on the depth of the charge carriers trap. Reference Guo, Wang, Chen, Zeng, Han, Li and Li29
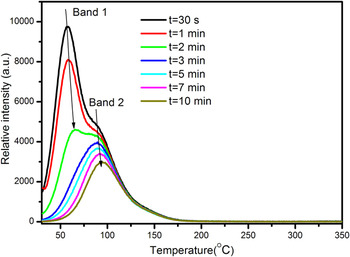
The LAG phenomenon can be observed after being irradiated by 200–300 nm wave length. The TL curves of a typical sample Sr2Ta2O7:0.001Pr3+ at different delay time (t = 30 s, 1, 2, 3, 5, 7, and 10 min) were also recorded to clarify the trap types and completely understand the kinetic processes of traps generated in Pr3+-doped Sr2Ta2O7 host. As shown in Fig. 9, it indicates that at least two different kinds of traps with different depths are generated by the incorporation of Pr3+ ions because there are two obvious TL peaks. The position of TL peak corresponding to band 1 and band 2 have an obvious shift to high temperature with longer delay time. A reasonable reason is that the trapped electrons/holes escape from shallower traps much faster than those in deep ones. Generally, it is not beneficial for shallow traps to stabilize the charge carriers, which caused extremely short afterglow duration due to the charge carriers escaping too rapidly. Vice versa, the charge carriers in deep depths are very difficult to be released because the activation energy is too high to achieve at room temperature. Empirically, the optimized TL peak is situated slightly above room temperature (320–420 K) for better LAG properties. Reference Trojan-Piegza, Niittykoski, Hölsä and Zych30,Reference Sun, Zhang, Zhang, Luo and Wang31
TL glow curves of sample Sr2Ta2O7:0.001Pr3+ at different delay times (t = 30 s, 1, 2, 3, 5, 7, and 10 min).

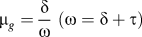
The TL peak corresponding to band 1 and band 2 are situated ∼330 K and ∼360 K, respectively. Therefore, two kinds of traps corresponding to two peaks are suitable for the room temperature LAG luminescence. As shown in Fig. 9, the peak intensity of band 1 decreases with a rapid speed, while that of band 2 decreases more slowly. It proves that trapped charge carriers escape from shallower traps much faster than that in deep ones which is consistent with the above. These TL curves with delay time from 3 min to 10 min are analyzed by Chen's peak shape method, which mainly depends on the geometrical form factor µg [
 ${\mu _g} = {\delta \over \omega }\;\left( {\omega = \delta + \tau } \right)$
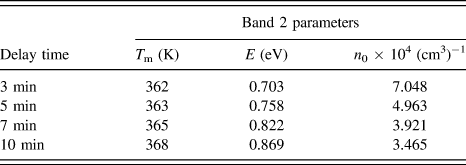
, ω is the full width at half maximum of the TL band, τ is half the width toward low-temperature side, δ is the half width toward high-temperature side]. The values of µg with delay time from 3 min to 10 min are calculated about 0.52. Therefore, according to Chen's theory, this case belongs to the second-order kinetic, which means the possibility that electrons once released from traps may be retrapped by traps. To sum up, the trap depth and trap density of TL glow curves for different delay times (3–10 min) of Sr2Ta2O7:0.001Pr3+ samples can be roughly calculated according to the following two Eqs. (5) and (6), respectively:
Reference Chen32,Reference Chen33
 $$E = 3.5\left( {{{{k_{\rm{B}}}{T_{\rm{m}}}^2} \over \omega }} \right) - 2{k_{\rm{B}}}{T_{\rm{m}}}\quad ,$$
 $${n_0} = {{\omega {I_{\rm{m}}}} \over {\beta \left[ {2.52 + 10.2\left( {{\mu _{\rm{g}}} - 0.42} \right)} \right]}}\quad .$$
In Eq. (5), E is the trap depth; k B is Boltzmann's constant; T m is the temperature (in Kelvin) corresponding to the TL glow peak. In Eq. (6), n 0 is the trap density, I m is the TL intensity of each glow peak and β is the heating rate (1 K/s). The calculated values of E and n 0 are presented in Table II. For TL band 2, the trap depth becomes deeper with longer delay time. It may be caused by release of charge carriers from trap centers. Furthermore, it can also be proved from the trap density decrease with the increase of delay time. Obviously, the value of t = 3 min is much smaller than that of t > 3 min, which is mainly because the peak is formed by overlapping band 1 and band 2 and the contribution of band 1 is quite large.
Estimated trap depths (E) and densities (n 0) of sample S1 with different delay times.

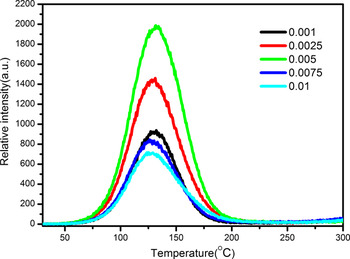
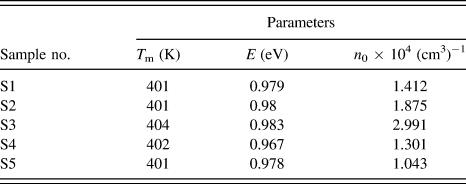
Furthermore, to better study the band 2 and avoid the impact of band 1, the TL curves of samples S1–S5 were recorded after being preheated at 70 °C for 5 min. The glow curves of samples S1–S5 are illustrated in Fig. 10. These TL curves with different concentration are analyzed by the same method as mentioned above. The calculated values of E and n 0 are presented in Table III. It can be seen that the trap depth corresponding to different samples are about 0.98 eV. The trap density approaches the maximum at x = 0.5 mol%.
TL curves of samples S1–S5.

Estimated trap depths (E) and densities (n 0) of samples S1–S5.

IV. MECHANISM OF LAG IN Sr2Ta2O7:Pr3+
At the moment, the origin of the defects needs further studies to further investigate the mechanism of LAG in Pr3+-doped Sr2Ta2O7. The generation of defects may be caused by two aspects: firstly, the intrinsic defects (e.g., strontium, tantalum, and oxide vacancies created by the evaporation of Sr or Ta in the reaction process at high temperature).
 ${\left[ {{V_{{\rm{S}}{{\rm{r}}^{2 + }}}}} \right]^{\prime \prime }}$
and
 ${\left[ {{V_{{\rm{T}}{{\rm{a}}^{5 + }}}}} \right]^{\prime \prime \prime \prime \prime }}$
can serve as hole trap centers. And the oxygen vacancies
 $\left[ {{V_{{\rm{\ddot O}}}}} \right]$
which are generated for charge compensation can be regarded as electron trap centers. Secondly, charge compensation defects related to the presence of Pr3+ substituted Sr2+ sites and produced defects via the process
 $2{\Pr ^{3 + }} + 3{\rm{S}}{{\rm{r}}^{2 + }} \to 2{\left[ {\Pr _{{\rm{S}}{{\rm{r}}^{2 + }}}^{3 + }} \right]^ \bullet } + {\left[ {{V_{{\rm{S}}{{\rm{r}}^{2 + }}}}} \right]^{\prime \prime }}$
in Sr2Ta2O7 host lattice. The defects
 ${\left[ {\Pr _{{\rm{S}}{{\rm{r}}^{2 + }}}^{3 + }} \right]^ \bullet }$
can act as electron traps.
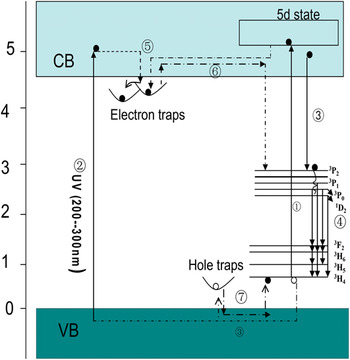
To understand the LAG of Pr3+-doped Sr2Ta2O7 or Pr3+-doped any host, the entire mechanism must be constructed. Based entirely on the above descriptions and analysis, a possible mechanism of LAG in Pr3+-doped Sr2Ta2O7 can be proposed and intended to explain the LAG phenomenon. As illustrated in Fig. 11. On the one hand, under UV excitation (200–300 nm), electrons in ground state 3H4 are excited into 4f 15d states (process numbered ①). On the other hand, electrons can be excited directly from valence band into conduction band (process ②). The majorities of excited electrons will move to 3P2 level and then they will relax to 3P1, 3P0, 1D2 levels with nonradiation relaxation (process ③). Subsequently, the electrons jumping from 3P1, 3P0, and 1D2 levels to ground levels of 3H j (j = 6, 5, and 4) results in the characteristic emission of Pr3+ ions (process ④). Meanwhile, part of excited electrons can be captured by shallower traps rather than the process mentioned above, then be captured by deep traps through tunneling (process ⑤). Therefore, after cutting off the ultraviolet light, those charge carriers (electrons or holes) trapped in shallower traps can be released gradually from the trapping centers with rapid speed, while the those in deep traps can be released with slow speed (process numbered ⑥). Then the motion process as that described in PL occurs, which leads to the characteristic emission of Pr3+ ions as blue emissive LAG. Finally, the motion process of recombination between electrons and holes occurs (process numbered ⑦).
A schematic diagram of LAG mechanism for Sr2Ta2O7:Pr3+.

V. CONCLUSION
In summary, the novel blue emitting Pr3+-doped Sr2Ta2O7 phosphors with persistent emission properties were synthesized successfully through a solid-state reaction. The blue LAG phenomenon was observed after being excited by UV-light. The mechanism of concentration quenching is studied systematically. The optimal Pr3+-doping concentration for the best photoluminescence and LAG properties were experimentally to be 2 mol% and 0.5 mol%, respectively. Furthermore, to explain the motion of charge carriers and clarify the generation mechanism, a simplified model for the illustration of LAG mechanism was also proposed.
ACKNOWLEDGMENT
The authors acknowledge the financial support from the National Natural Science Foundation of China (No. 21471038).