Today sub-Saharan Africa is the world's poorest region. In international comparisons of GDP per capita, life expectancy, adult literacy, and infant mortality, a large group of African countries lingers at the bottom of the rankings.Footnote 1 In recent years, a number of scholars have stressed that African poverty has been persistent over time because of structural growth impediments including geographic and demographic conditions,Footnote 2 precolonial state weaknesses, extractive colonial institutions, or the intensity of historical slave exports.Footnote 3 Albeit emphasizing different origins and channels of causation, these studies rest upon the shared belief that the effects of adverse geographical or historical conditions persisted over time, keeping African economies behind ever since they appeared on the scene.
But to what extent have African countries suffered from structural growth disadvantages? Have material living standards in Africa consistently been lower than in other parts of the world in the past centuries? The lack of pre-1950 African GDP per capita estimates leaves these questions unanswered. To repair these lacunae and check for the persistence of poverty, we reconstruct and compare real wage levels and trends for nine British African colonies over their period of colonial rule (ca. 1880–1965). We present urban unskilled real wages of male workers extracted from colonial statistical abstracts, and show that these were well above subsistence level, rose significantly over time, and were, in some places, considerably higher than in major Asian cities. This provides new insights into long-term African growth trajectories and places us in a better position to evaluate the path-dependent nature of Africa's proclaimed historical growth failure.Footnote 4
Real wage series offer an attractive alternative to historical national accounts data for places and periods with otherwise scarce statistical information. Real wages have the disadvantage that they do not capture total economic performance, but the advantage that they better reflect the living standards of ordinary African workers than per capita GDP. Indeed, they focus on the purchasing power of African laborers leaving aside the significantly higher income levels of European settlers and/or Asian migrant workers. Our series add to the set of historical real wage series that have been assembled over the last decade. These are all comparable across time and space, and cover all major world regions.Footnote 5 Sub-Saharan Africa has remained somewhat of an exception so far, and this article accommodates part of this gap.Footnote 6
We are not the first to present real wages for Africa. S. Bowden, B. Chiripanhura, and P. Mosley have constructed indices of rural wages for twentieth-century Ghana, Uganda, Kenya, Zimbabwe, and South Africa. Our series include a larger number of places for a somewhat different period of time (1880–1965) and differ from theirs in important respects. They are based on annual observations instead of decadal point estimates. They relate to urban unskilled instead of rural workers. Further, our data include the value of in-kind payments in addition to the cash component. Finally, our series are internationally comparable because they are based on standardized consumption baskets.
Our findings have implications for the methodological debate about African growth analyses. The overwhelming majority of recent African growth studies apply some form of cross-country regression analysis, in which a robust correlation is established between a proxy variable at some point in the past, and per capita GDP or a governance quality indicator at present.Footnote 7 Whereas proponents of this type of research design have lauded its ability to uncover causal relationships, skeptics have, amongst others, raised concerns about “compressing” history when jumping over several centuries.Footnote 8 Our reconstruction of African living standards scrutinizes the assumed persistence in the cross-country distribution of per capita income levels both within Africa, and between Africa and the rest of the world.
STRUCTURAL IMPEDIMENTS TO AFRICAN GROWTH?
The past decade has witnessed an encouraging increase in the number of studies trying to explain Africa's dismal growth performance in comparison to the rest of the world. Many arguments put forward lean on some form persistence established by cross-country regressions. Those who blame geography have almost exclusively focused on structural growth impediments. To explain why sub-Saharan Africa “has been the world's poorest and also its most slowly growing region” since the Industrial Revolution, David Bloom and Jeffrey Sachs have discussed the negative effects of tropical diseases (especially malaria), fragile ecosystems, and poor natural transportation networks on agricultural productivity growth and economic policy choices.Footnote 9
In his recent survey of Global Economic History, Robert Allen argues that hostile ecological conditions have hampered the development of advanced agricultural civilizations in Africa and claims that, “Sub-Saharan Africa was the poorest region of the world in 1500” and that this has “remained so” until the present.Footnote 10
Although proponents of institutional explanations have subordinated the role of geography to the role of history and human decision making, leading neo-institutionalist scholars share a similar perspective on the persistent nature of African growth impediments. Daron Acemoglu, Simon Johnson, and James Robinson have focused on the relationship between extractive colonial institutions and weak property rights systems, explicitly assuming that the effects of colonial institutions have been persistent until today.Footnote 11 Nathan Nunn has argued, against this view, that the impact of colonialism has been relatively small because of the relative short period of effective European occupation, in contrast to nearly five centuries of precolonial slave trading. He establishes a robust negative correlation between slave export intensity and current levels of GDP per capita in African countries. According to Nunn, the slave trades had “long-term effects” on economic development, possibly channeled via weak precolonial state formation and ethnic fragmentation, which have deterred social cohesion and reduced the ability of states to provide for growth-enhancing public goods.
These are just a few examples of a large set of studies using cross-country regression techniques to underpin the significance of the correlation between a distant explanatory variable and current income levels, under the assumption that slow growth has been a persistent feature of African economies. In fact, if one would put all the “proven” impediments to African growth together, it is hard to escape a feeling of deep pessimism regarding Africa's chances to escape poverty in the future. However, linking two moments in time without reviewing possible changes during the centuries in between, a phenomenon coined by G. Austin as the “compression of history,” ignores the fact that we still know very little about Africa's comparative growth performance before 1950. And the lack of a longer-term perspective preempts a more nuanced view of Africa's growth potential in the future.Footnote 12
In fact, even with the little data we have such a blithe approach to history seems unwarranted. Africa has not been the poorest region in the world since the Industrial Revolution, as Bloom and Sachs argue, or even since 1500 as Allen claims. If we turn back again to the A. Maddison data—which Bloom and Sachs also use—we see that between 1950 and 1964 regional GDP per capita estimates for Africa are higher than those for Asia.Footnote 13 François Bourguignon and Christian Morrisson observe that, “In 1950 only 12 percent of world inhabitants with incomes of less than half the world median income lived in Africa. By 1992, 30 percent did. Poverty, largely an Asian problem until just after World War II, is fast becoming an African problem.”Footnote 14 As pointed out by William Easterly and Ross Levine, leading economists in the early 1960s “ranked Africa's growth potential ahead of East Asia's.”Footnote 15 African income levels started to fall behind since the 1960s, and particularly after 1973.
This leaves room for different interpretations of long-term African growth, such as the “lost decades” perspective recently put forward by Robert Bates, John Coatsworth, and Jeffrey Williamson. These scholars draw an analogy between the half a century of political instability and economic stagnation after decolonization (ca. 1820–1870) in Latin America and post-1960 Africa. In Latin America, the “lost decades” were followed by a “Golden Age” of export-led growth between 1870 and 1914.Footnote 16 To which extent the similarities between postcolonial Africa and mid-nineteenth century Latin America outweigh the differences remains open to discussion, but at least it restores the concept of historical change at the heart of long-term African welfare analysis. Understanding how African income levels compared to the rest of the world before 1950 is something that would be very valuable.
WAGE DEVELOPMENTS IN BRITISH AFRICA, 1880–1965
We collected wage and commodity price data for nine cities in nine British African colonies: four in the west, these are Bathurst (The Gambia), Accra (The Gold Coast), Lagos (Southern Nigeria), Freetown (Sierra Leone), four in the east, Nairobi (Kenya), Zomba (Nyasaland), Dar es Salaam (Tanganyika), Kampala (Uganda), and Port Louis on the island of Mauritius.Footnote 17 We focused on urban male wages guided by six considerations. First, we preferred urban wages since these could be matched with urban retail prices. Second, urban unskilled adult male wages are the most useful for international comparisons. Third, the limited variation in wage levels across unskilled workers (relative to that among skilled artisans) reduces the potential error margin in our wage series. Fourth, we made sure that our wage data refer exclusively to African workers, because Europeans and Asians were normally paid higher wages. Fifth, we opted for private sector wages to avoid potential biases in public sector remunerations. In case we had no other choice, we used public sector wages to extrapolate or interpolate private market wage series.Footnote 18 Sixth, although adult male wages do not equal total household income, we excluded other income sources (self-employment and the income of women and children) to maintain the international comparability and temporal consistency of our real wage series. We retrieved wage and price data from colonial blue books, sessional papers, and a wide range of administration reports that are available in the archives of the Colonial Office in London. The use of different sources allowed us to cross-check our wage and price series. The Colonial Office in London asked colonial governments to fill out questionnaires about daily, monthly, and/or annual wages including payments in kind, such as food rations, housing, or clothing, if they were provided.Footnote 19 In some cases, monetary value and material contents were reported separately. Annual reports from colonial labor departments, which become available in the 1920s, offer annual surveys of wage movements and, occasionally, surveys of wage earners’ cost of living. The reported wages refer to adult males and more than 90 percent of our urban wages are daily wages. Wages are either reported in terms of minimum and maximum rates, indicating the boundaries of wage dispersion for specific groups of workers, or as an estimated average rate. In case of minimum and maximum wage data, we calculated a lognormal distribution of wages (biased towards the minimum). We have assessed the plausibility of this assumption on the basis of years for which a minimum, maximum, and average wage rates were available. This confirmed that the lognormal assumption yields results very close to the stated average.
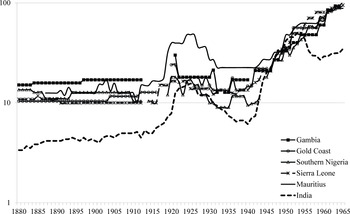
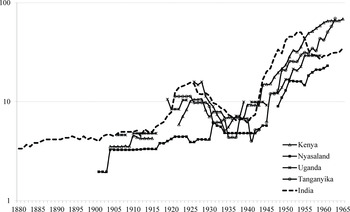
Our nominal wage series are presented in Figures 1A and 1B. The online Appendix Tables 1A–1C offer the underlying data. All of the wage series are stated in British pence per working day. For comparative purposes, we include a wage series for unskilled urban workers in British India.Footnote 20 Three conclusions are important for our overall argument.
First, nominal wage differentials were surprisingly large across British Africa. A male unskilled worker in West African cities such as Accra, Bathurst, Lagos, or Freetown would command more than twice the wage of his counterpart in East African cities such as Kampala, Nairobi, Zomba or Dar es Salaam. In Mauritius, the nominal wage levels of urban wage workers (but also on the sugar estates) were even higher than in West Africa.
The West African advantage in nominal wages was already present at the start of the colonial era and remained in place until independence. Nominal wage levels in Nairobi and Dar es Salaam only began to converge with those paid in the West African capitals in the 1950s. Moreover, wages in West Africa and Mauritius were considerably higher than in British India. In East Africa, wages remained slightly lower than the Indian wages throughout the interwar era, with the exception of Zomba, where wages remained lower until the end of the period under consideration. It also appears that West African wages were higher than in many British Asian colonies.Footnote 21
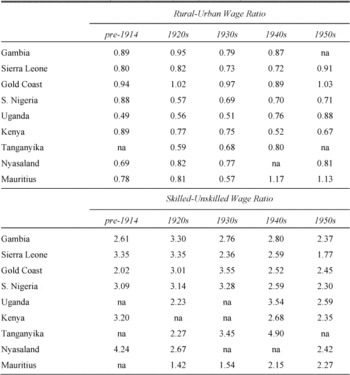
Although we focus on urban unskilled labor wages in this article, we have collected nominal wage series for rural unskilled and urban skilled labor as well. These series allow us to assess the reliability of our urban unskilled wage series as we expect the rural-urban and unskilled-skilled wage ratios to move within certain plausible margins. Table 1 suggests that this was the case for all of the colonies incorporated in this article. Rural wages (including payments in kind) ranged roughly between 50 and 100 percent of urban unskilled wages. Table 1 shows that the skill-premium ranges mainly between a factor 2 to 4 and was stable over time.
NOMINAL WAGES OF URBAN UNSKILLED WORKERS IN BRITISH WEST AFRICA, MAURITIUS, AND BRITISH INDIA, IN PENCE PER DAY, 1880–1965

NOMINAL WAGES OF URBAN UNSKILLED WORKERS IN BRITISH EAST AFRICA AND BRITISH INDIA, IN PENCE PER DAY, 1880–1965

AVERAGE UNSKILLED RURAL-URBAN WAGE RATIO AND URBAN SKILLED-UNSKILLED WAGE RATIO IN BRITISH AFRICA DURING THE PRE-1914 YEARS (the 1920s, 1930s, 1940s, and 1950s)

Sources:
See the online Appendix.
The wage increases observed in the major African cities also appear in the countryside. This is not surprising, as more Africans started to combine urban and rural jobs during the colonial era (whereby they switched regularly between wage labor and subsistence farming) and previously separated labor markets became increasingly integrated.Footnote 22 In the Gold Coast, workers on the cocoa plantations earned nearly the same wage as their urban counterparts, and might have even been better off if we take into account the generally lower rural price levels and the ability to substitute wage income with yields from a small plot of land. In other words, the real wage developments that we present below were not confined to the colonial capital cities in British Africa. But of course, for the majority of people living in the hinterlands at a large distance from urban commercial centers, it was the size of their harvest or cattle herd, rather than market wages and retail prices, which determined their economic standing.
The skill premiums presented in the right-hand part of Table 1 are mainly based on the wages of skilled construction workers such as carpenters, masons, and plumbers; they range from 200 to 400 percent of an unskilled urban wage. African skill premiums were high relative to major Latin American and Asian cities where skill premiums in the building industry were less than 200 percent during the interwar era.Footnote 23 The wage data we collected thus confirm the countless colonial reports complaining about the lack of skilled African workers.
COMMODITY PRICES AND CONSUMPTION PATTERNS
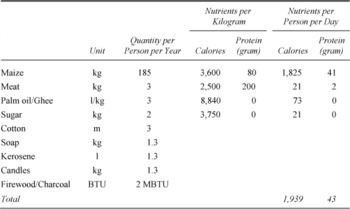
We adopt Allen's concept of the “bare-bones subsistence basket” to compare the purchasing power of wages over time and across countries. Table 2 presents the contents of this basket. It keeps an average working family alive, but offers nothing more than that.Footnote 24 It includes a minimum amount of daily calories (1,940) and proteins (43 grams), which barely suffice to replenish a male adult body after a day of physical labor without losing muscular strength in the long run. Our sources provide detailed information on retail prices recorded in the major cities of the British colonies which allowed us to construct long-term price series of major staple crops (maize, rice, millet, and cassava), meat (beef, mutton), sugar, and palm oil or ghee. To value imported commodities such as cotton cloth, soap, and candles, we used British trade statistics and local wholesale export statistics to extrapolate scattered retail price observations. In case the latter were entirely absent, we adopted a markup rate of 20 percent to adjust for additional taxes, transportation costs, and retail services. We derived this markup rate from years for which we had both retail and wholesale export price data.
AFRICAN SUBSISTENCE BASKET BASED ON THE ANNUAL CONSUMPTION OF ONE ADULT MALE

Note:
For comparisons of this basket with a European or Asian subsistence basket, see Allen, British Industrial Revolution, pp. 33–42.
Given the large number of staple crops grown in Africa (maize, rice, millet, cassava, yams, sweet potatoes, and plantain), the possibility of commodity substitution is an important concern for real income estimation. Historical studies on African consumption patterns stress the large variety of food crops and the common practice of crop rotation, for instance, of maize and cassava.Footnote 25 Cost of living surveys conducted by the British and dietary tables of people in prisons, hospitals, and lunatic asylums indeed reveal considerable variety in dietary habits. In order to accommodate the possibility of commodity substitution, we have calculated basket prices of different staple crops using an “envelope approach,” selecting for each year the particular staple crop that offered the required calories and proteins the cheapest.Footnote 26 The price series are presented in the online Appendix Table 1B.
Since maize offers more nutritional value per unit of land and labor than any other staple crop, it is not surprising that the maize basket offered the highest caloric value-price ratio in most of our series.Footnote 27 Maize had become a major food crop in Africa during the nineteenth century.Footnote 28 The crop served as a basis for major dishes like kenkey (the Gold Coast, Nigeria), ugali (Kenya), or nzima (Nyasaland). In some countries, though, there were good alternatives for subsistence consumers. In Mauritius, for example, per calorie prices of rice and maize were more or less at par. In Uganda, millet and cassava offered a higher nutritional value-price ratio. In Nairobi, the millet basket was cheaper until the 1910s.
The case of Uganda illustrates the potential importance of staple crop substitution in the short run. In terms of cassava, one of Uganda's primary staple crops, real wages increased between the start of the colonial period and World War II, but the crop was plagued by heavy price fluctuations. Big spikes in cassava prices in the years 1930–1932 and 1938–1940 reflect the harvest failures caused by the cassava mosaic virus disease, which took on endemic forms in parts of East and Central Africa ever since the virus was first discovered in the late nineteenth century. These harvest failures turned millet into a more attractive substitute.
Our most important omissions are price series for beans and peas, which were consumed in considerable quantities across the African continent (as well as protein-rich substitutes such as groundnuts, peanuts, and pecans). Because pulses constituted a cheap source of protein, these crops combined well with high-caloric staple crops such as maize to obtain a balanced diet at low costs. We compensated this omission by assuming higher quantities of staple crop consumption. We also lack data on the price series of fuel used for cooking, heating, and lighting. Most African households used firewood, charcoal, and/or kerosene as the main supply of energy. Candles or lamp oil were generally used for lighting. Despite some scattered price observations for firewood and candles, we were unable to construct solid time-series for these commodities. We used the scattered price information in combination with figures of the average thermal value of firewood and charcoal to calculate the relative weight of these commodities in the overall basket and added this percentage to the total basket price. For firewood/charcoal, we add 7.5 percent, for candles we add 2.5 percent. A similar strategy compensates for the lack of rental prices. Allen adds 5 percent to each Western European and Asian subsistence basket and we adopt his estimate.
It appears that the intra-African variation in basket prices was considerably smaller than the variation in nominal wages. The coefficient of variation for the price baskets of the different colonies fluctuated around 0.2. That for the nominal wage rates was much higher, around 0.5. Overall, East African basket prices tended to be ca. 30 percent lower than in West Africa up to the early 1930s. After the mid-1930s the intra-regional price gaps started to diminish. The real wage gaps between West and East Africa shown in the next section were thus exclusively driven by nominal wage differences, and they would have even been greater if cost of living disparities had not partially offset them.
An important limitation of real wage studies is that sustained changes in real income tend to alter people's consumption preferences, while the commodity basket (the denominator) has to remain constant to guarantee temporal and spatial comparability. The consumption pattern of a subsistence income earner typically contains no alcohol, barely any meat, and is primarily based on the most economical carbohydrate-rich staple crop. As real wages rise above subsistence, it is likely that households substitute away from the “inferior” staple crop for a more luxury variant, such as oats or barley for wheat, or maize for rice. Therefore, it is important to consider real wage trends in relation to evidence on changing consumption patterns.
To date, we have mostly qualitative evidence from cost of living surveys suggesting changes in consumption in response to rising living standards in several urban and rural areas during the colonial period. The evidence refers mostly to West Africa. A 1936 survey of what native working-class families in Lagos consumed lists a selection of 14 most important products. As expected for a welfare ratio well above subsistence, the most economical staple crop, maize, does not dominate the diet.Footnote 29 Two other things stand out as well. First, the actual consumption basket includes a fair amount of fruit and vegetables (oranges, coconuts, okra, and onions), which are nutritional “luxury goods.” Second, monthly meat consumption was much higher than needed for pure subsistence. If we convert the meat and fish listed in the survey into daily protein portions, it appears that ordinary working class families consumed at least 2–3 times as much protein as the amount provided for in a bare-bones subsistence basket (43 grams).Footnote 30
We also have occasional reports on the rations provided in lunatic asylums and prisons. They show similar dietary patterns, albeit slightly lower in daily proteins, suggesting that, overall the consumption basket we chose was a minimum standard. The transition to rice consumption and production in the 1920s in and around Kumasi, the center of the booming cocoa industry in Asante, suggests a fundamental historical change in living standards. As will be shown below, the welfare ratio for a maize basket in Accra rose from 1.7 in 1920 to 3.5 in 1929, while for the rice basket the ratio increased from 0.5 in 1920 (still too expensive) to 1.5 in 1929 (feasible). It is no coincidence that, exactly in this decade, food consumption and production in Kumasi shifted towards rice as well.Footnote 31 Cost of living surveys in Sierra Leone and The Gambia suggest that a similar shift from maize to rice occurred in these colonies as well, where rice is even considerably cheaper than maize during the 1920s.
AFRICAN REAL WAGES IN GLOBAL PERSPECTIVE
To convert wages into individual incomes we follow Allen's assumptions for Asia: 52 working weeks of 6 days or 312 days per year. Labor reports for the interwar and postwar period state that monthly labor wages were usually based on 25 or 26 working days. The “average number of hours per week worked without overtime” for each colony comes to between 48 and 54 hours implying a six-day week. Finally, if we divide annual or monthly wage rates by daily ones when both observations are available, the implied working year is consistently around 312 days per year and 26 days per month. In line with Allen, we also assume that the average family (two adults and two to three children) requires three subsistence baskets. Allen refers to this as the “family subsistence basket.” The number of such family subsistence baskets that can be obtained from an adult male wage (controlled for nonworking days) is referred to as the welfare ratio. A welfare ratio of one is considered to be the absolute subsistence income level. We are aware that these assumptions are somewhat arbitrary and that the purchasing power of African households depends on a large range of additional and often changing conditions, such as the earnings from female and child labor, seasonal unemployment, household's own subsistence food production, and so on. Yet, these assumptions are necessary to compare the purchasing power of wages paid in different cities around the world.
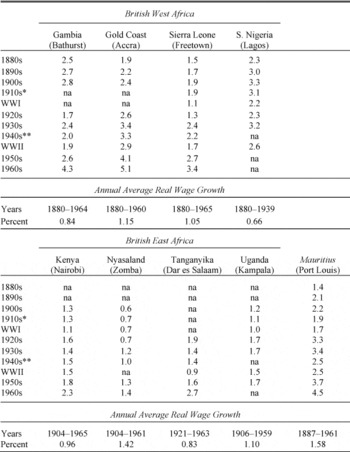
Table 3 shows our main results. It displays the welfare ratios in nine major British African cities by decade and in annual average growth rates. With the notable exception of Zomba (Nyasaland), over the whole period, urban male adult wage incomes could buy at least one family subsistence basket per day, indicating that in nearly all the African cities unskilled workers could support a family of five. Moreover, welfare ratios rose over time everywhere. The most impressive rise occurred in Accra (from 1.9 to 5.0), indicating that the economic dynamics generated by the cocoa export boom spilled over to broad layers in Ghanaian society, including unskilled urban wage workers and rural workers (whose nominal wages were almost at par during most of the period).Footnote 32
The rise in real wages in British Africa occurred in a context of urbanization. Despite their limited reliability, it is clear from colonial population census that urban populations grew faster than total populations. The West African commercial centers drew large flows of economic migrants year after year. In Bathurst (1911–1951) and Freetown (1921–1931), the urban population grew at an average annual percent of 2.36 percent and 2.45 percent respectively, versus 1.56 percent for Gambia and 1.38 percent for Sierra Leone as a whole.Footnote 33 In Zomba, where urban real wages only started to rise in the course of the 1930s, population grew at an average annual rate of 2.49 percent for the period 1925–1940, whereas the colony at large grew with 1.51 percent. For Nairobi (1925–1945), we even obtained a growth rate of 6.41 percent versus 1.95 percent for Kenya at large (excluding European settlers). By the early 1930s nearly 60 percent of Lagos’ inhabitants had been born elsewhere. Most of these migrants were adult males in their twenties and thirties, who were drawn to the opportunities of earning higher wages in the city.Footnote 34 In the Gold Coast, population growth rates for both Accra and the colony at large exceeded 3 percent per annum (1911–1931).Footnote 35
WELFARE RATIOS AND WELFARE GROWTH RATES OF UNSKILLED AFRICAN WAGE WORKERS IN MAJOR BRITISH AFRICAN CITIES, 1880–1965

* Excludes World War I.
** Excludes World War II.
Notes:
Annual average growth rates were computed by using the average values of the first and last five years of the mentioned period to reduce the impact of coincidental outliers.
Sources:
See the online Appendix.
So there seems to be a rather straightforward economic explanation for the real wage rise: high land-labor ratios and open land access, especially in comparison to large parts of Asia where population densities were much higher, lifted rural and urban incomes of able-bodied workers above subsistence level. The increasing demand for urban labor during the colonial era, put upward pressure on real wage levels, while land abundance kept relative prices for agricultural commodities low as food production could easily rise to match demographic growth without declining marginal productivity. Indeed, even in relatively heavy populated areas such as Kumasi, the Asante capital, the available resources of land were not exhaustively used to feed the city in the early twentieth century.Footnote 36
However appealing this simple explanation may be, it doesn't account for the remarkable intra-African gap in real income. Between 1900 and 1940 the unweighted average real wage level in West Africa (2.7) was almost twice as high as in East Africa (1.4),Footnote 37 and because real wage growth was not distinctively higher in East Africa, West Africa maintained considerably higher levels of welfare throughout the colonial era. As noted in our discussion of the price baskets above, this intra-African real wage gap should be attributed to the persistence of nominal wage differentials. The next section will be entirely devoted to explore the East-West gap.
Table 3 also indicates that the First and Second World Wars were devastating for living standards in all British African colonies. Price hikes as a consequence of war rationing schemes and a collapse of international trade dramatically reduced the purchasing power of sticky nominal wages. The slow adjustment of wages to prices worked in both directions: while the inflation in the early 1920s caused a temporary decline in real wages, the deflation during the Great Depression of the early 1930s lead to a temporary rise in purchasing power of wage workers. In Zomba, real wages even rose faster in the 1930s than in any other decade of colonial rule. Yet, real wages in Zomba were clearly below the threshold level before 1930. Urban workers in Nyasaland needed additional sources of family income (in money or kind) in order to survive. Labor reports of Nyasaland indeed indicate that most families were engaged in subsistence farming and only entered the labor market in the slack season. Many young native males in Nyasaland migrated long distances seeking dangerous work in the mining areas of Southern Rhodesia and South Africa, in search of higher wages.Footnote 38
After the Second World War, the growing political influence of trade unions, independence movements, and changing views on “the labor question” in metropolitan Britain reversed the traditional wage-price response.Footnote 39 During the war, wages increased because of inflation, but after 1945 wages in all colonies started to rise independently from price changes, in part due to minimum wage legislation. In some cases, such as Freetown, wages rose so fast that they set a wage-price spiral in motion, which was only brought under control after 1960.
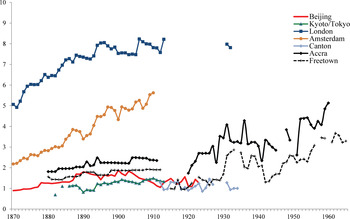
A global comparison of African real wages shows that improvements in West African living standards were impressive. In Figure 2A, we place the real wage series of Accra and Freetown in a global comparative perspective. Asian welfare ratios in the period 1880–1930 suggest that wage workers in Beijing, Shanghai, and Canton were significantly worse off.Footnote 40
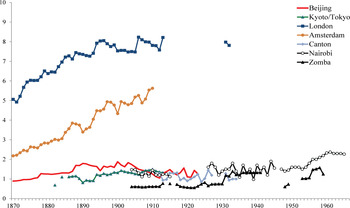
The welfare ratios of urban unskilled workers in late nineteenth-century London and Amsterdam were obviously higher than in British West Africa. However, the average annual growth rates in Accra between 1900 and 1960 were comparable to the average growth rates in nineteenth-century London (1840–1900), although it has to be said that growth rates were affected by very low starting points. The comparison between East Asian and East African cities, as shown in Figure 2B, is different. Subsistence ratios in Nairobi were more or less equal to the long-term levels in Asia. In Kampala, real wages fluctuated considerably, but were not distinctively higher.
In sum, we find little evidence that suggests that four generations of African urban wage workers in the colonial period were trapped into persistent, structural poverty. Welfare improvements were certainly not confined to specific regions in British Africa or brief periods of time (such as 1945–1960). In fact, the whole idea that Africa has been the poorest and most slowly growing region since the Industrial Revolution, let alone 1500, is based on a backward extrapolation of post-1960 growth experiences without a solid empirical foundation. If anything, our results reveal a rather dynamic picture of African living standards, including a remarkable degree of intra-regional variation that warrants further explanation.
WELFARE RATIO IN ACCRA AND FREETOWN IN GLOBAL PERSPECTIVE, 1870–1965

WELFARE RATIO IN NAIROBI AND ZOMBA IN GLOBAL PERSPECTIVE, 1870–1965

THE INTRA-AFRICAN WAGE GAP
Controlling for time effects, West African real wage levels were on average 88.5 percent higher than those in the East Africa. This difference is highly statistically significant and large enough that it is not the product of the varying composition of countries in each decade. A convincing explanation for this wage gap should address at least two issues. First, why did this gap exist already at the start of the colonial era in the late nineteenth century (see Table 3)? As this suggests that part of the explanation resides in precolonial labor market conditions. Second, why did real wages under colonial rule not convergence until after the Second World War, when trade unions and independence movements started to play a serious role in collective wage negotiations?Footnote 41
To understand the origins of the observed intra-African income gap we need to acknowledge that British West Africa had developed far more intensive trade relationships with the major European powers before the onset of colonization, than British East Africa. Europeans had established (slave) trading stations along the West African coast from the fifteenth century onwards and, from these strongholds, stepwise expanded their territorial control into the interior during the nineteenth century. Indeed, the estuary of the Gambia and Niger Rivers and the area around Freetown—which served as a new hometown for freed slaves—were under formal British control more than a century before the British started to challenge Arab footholds on the East African coast.
Consequently, West Africa had virtually completed the transition from the prohibited slave trade towards “legitimate trade” by the 1880s, while in East Africa the Arab slave trades dominated international exchange until the start of the twentieth century, despite British attempts to put a halt to this practice. The gradual encroachment of British power in West Africa enabled emerging colonial states to build upon their existing commercial relations and administrative structures. In East Africa, such preexisting structures were near absent. East African areas were annexed at once in the 1890s, but territorial occupation preceded the development of a colonial bureaucracy taking care of trade regulation, taxation, and the securing of law and order. Moreover, in East Africa chartered private companies such as the Imperial British East Africa Company (IBEAC) and the British South Africa Company (BSAC) took the lead.
The different degree and nature of commercial development in the late nineteenth century affected real wage levels in several ways. First, the indigenous controlled export of tropical cash crops such as palm kernels, palm oil, rubber, groundnuts, and cocoa in West Africa raised the demand for seasonal workers in the countryside, as well as urban workers in transport, communication, and construction activities. It took several decades before similar forces operated in some parts of East Africa, the best example being African cotton exports from Uganda.Footnote 42 Second, different trajectories of commercial development affected the transition from the use of indigenous slave labor and labor pawning practices, towards the emergence of a market for free wage labor.Footnote 43 The wider and longer experience of West African laborers with the concept of wage labor made their labor input more effective, and therefore more valuable. Part of the economic surplus created by legitimate trade thus trickled down to the urban and rural wage workers engaged in the expanding market economy. And consequently, the British were less inclined to intervene in African labor markets in order to enhance trade.
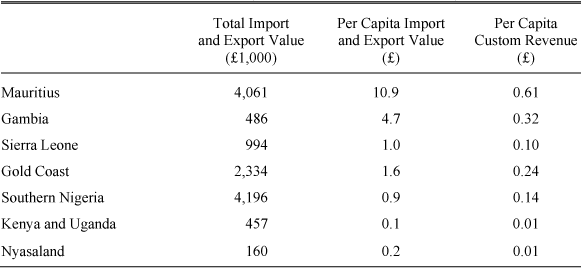
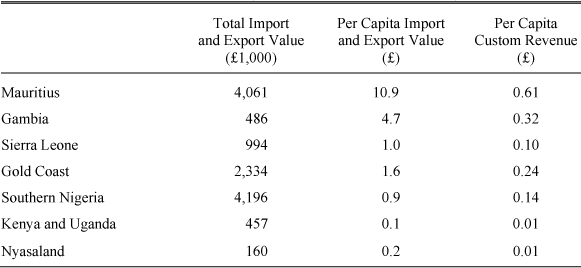
Table 4 shows the varying levels of commercial development at the start of the twentieth century. The average per capita value of international trade in British West Africa was at least a factor 10 larger. Moreover, while exports paid for imports in West Africa, the balance of trade in East Africa was still extremely skewed: in 1901 imports accounted for 92 percent of total trade in the customs union of Kenya-Uganda and 86 percent in Nyasaland. Table 4 illustrates how the fiscal options of the emerging colonial states were affected by varying degrees of commercial development. British West African colonies financed between 50 and 90 percent of their annual government expenditures from custom revenues (mainly import duties).Footnote 44 In the East African colonies, this share never exceeded 35 percent of total state revenue before 1940, even though per capita Kenyan exports rapidly caught up and overtook West African exports during the interwar era, except for the Gold Coast.
VALUE OF INTERNATIONAL TRADE AND CUSTOM REVENUES IN MAURITIUS, BRITISH WEST AFRICA, AND BRITISH EAST AFRICA, 1901
Notes:
The year 1901 was selected because of the population census conducted in the British Empire in that year. We used these census estimates to compute per capita trade and custom revenue. We are aware of the fact that these census estimates underestimate total population, but since this applies to all colonies (with the possible exception of Mauritius) and have no solid ground to make differentiated upward adjustments, we accept that the per capita trade and custom revenue estimates reflect an upper bound. Yet, even if we would adjust population figures with 10 to 30 percent, it would not change the comparative picture. For an extended discussion of African colonial census data, see Manning, “African Population.”
Sources:
Trade data, population estimates, and custom revenues taken from the Blue Books of 1901 listed in the last section of the online Appendix.
Because trade flows were too small in the early years, colonial governments in East Africa turned to direct native taxes as an alternative means of financing a rudimentary colonial state.Footnote 45 Income or land taxes require an elaborate system of assessment, and would have taken years to develop. As such, they were not considered a feasible alternative until decades later. The direct taxes were mostly a flat rate per (male) adult, household head, or native dwelling (hut, house, or yard tax). The rates, however, varied considerably across tribes, communities, and districts as governments preferred to spread the tax burden according to varying income-earning capacity and prevent social upheaval as a result of taxation whenever possible. In some occasions, such as in Tanganyika, a “plural wives tax” was levied to raise additional revenue from wealthier households.
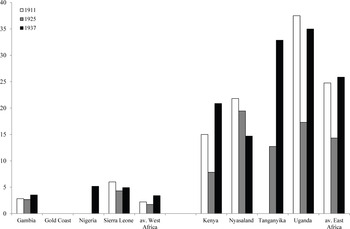
Different tax systems are part of the reason why real wages did not converge after 1900. By raising the supply of native African labor in search of cash-earnings, direct native taxes reduced the upward pressure on wages.Footnote 46Figure 3 expresses the fiscal burden of the official native direct tax rate as the amount of days that had to be worked by an urban unskilled wage earner for the benchmark years 1911, 1925, and 1937. The figure shows that East Africans had to work a much larger number of days to meet their direct tax obligations than West Africans.
Government revenue accounts enable us to calculate an upper-bound labor supply effect of direct native taxation. In Uganda, £591,395 were collected from native poll taxes in 1938. With an annual wage income of £9.30, one would need 64,000 full-time jobs to cover this sum. If every wage worker would spent the estimated 7.8 percent of his wage income on the native poll tax, 788,000 wage workers would be required, which constituted more than half of the estimated adult male labor force of 1.4 million! For Nyasaland, Tanganyika, and Kenya, comparable figures can be obtained. Obviously, this is an upper-bound estimate; in reality, the wage labor supply effect was much lower, since farmers could generate cash income by selling their surplus produce to local or international markets. But even if the estimated effect would just have been a quarter of this upper-bound estimate, it was still substantial.
In West Africa, direct taxes were either absent, or far too low to have a real impact on the labor market. In the Gold Coast, the colonial government had considered but never effectuated the implementation of direct native taxes. In Nigeria, a native income tax was only introduced in the 1920s, but this one remained exclusively targeted at higher income segments of the population. In The Gambia, a flat tax was imposed, but its impact on purchasing power was negligible. In Sierra Leone, the introduction of a hut tax in the protectorate areas provoked violent resistance (the Hut Tax War 1898/99). The head tax system that was eventually adopted proved rather ineffective though and the colonial administration was only able to raise hut tax revenues after 1930 when custom revenues declined sharply and balancing the budget became problematic. However, in Sierra Leone hut taxpayers were permitted to settle their obligation in kind, which preempted any possible attempt at labor market regulation.Footnote 47 The key reason why direct taxes were considered but never implemented in the Gold Coast or Southern Nigeria is that they eventually proved unnecessary for the development of trade, nor were they needed to “create” a market for wage labor.Footnote 48
PER CAPITA TAX PRESSURE EXPRESSED AS THE NUMBER OF WORKING DAYS REQUIRED TO MEET ANNUAL DIRECT TAXATION OBLIGATION

Differences in labor migration patterns further corroborate this point. One of the peculiarities of the East African labor market was the proximity of a vast reserve supply of unskilled and skilled labor on the Indian subcontinent. Indian immigrants accommodated demand for labor in various parts of the British Empire. Semi-skilled and skilled Indians established commercial and industrial businesses and occupied a substantial share of the skilled jobs in the public and urban private sectors. They became railway employees, carpenters, or engineers in urban construction activities, harbor tax collectors, or clerks in government service. The population census of 1931 of Kenya enumerates 57,133 Asians, ca. 2 percent of the population. Although this may not seem impressive, it should be kept in mind that they were mainly concentrated in the larger cities, which gave them a strong position in the higher segments of the urban labor market.
The permanent migration of skilled Indian workers was complemented by temporary flows of Indian coolies who worked on large infrastructural projects such as the construction of the Uganda railway, connecting the center of the Buganda Kingdom at the shores of Lake Victoria with the port city of Mombasa in Kenya. This project involved about 30,000 Indians who were recruited (often by force) and shipped to Kenya specifically for this purpose.Footnote 49 The access to a superfluous pool of Indian coolie workers implied that unskilled urban wages for native African workers did not exceed the rates paid to Indian immigrants, especially not when these workers were considered to be more malleable to the conditions of heavy and dirty manual work than local Africans. If we take a look again at Figure 1B, we see that not only the nominal wage levels, but also the nominal wage trends in Nairobi, Kampala, and Zomba are closely in line with the average trend in the major Indian cities. To which extent the urban labor markets at both sides of the Indian Ocean were integrated is a question that requires additional research beyond the scope of this article, but our nominal wage data offers an interesting hypothesis: African unskilled wages may have been set in Bombay, Karachi and Madras!
West African colonial governments did contemplate attracting Chinese indentured workers at some point. The idea was that the Chinese would be willing to work for lower wages and accept harsher labor conditions than native Africans, especially in the mines.Footnote 50 However, these initiatives never bore fruit and met with great resistance from the (West) African intelligentsia and the population at large. In West Africa labor migration patterns remained dominated by people who moved from the interior to the coastal areas. The classic example is the seasonal labor migration from the Northern Territories (Ghana) and Upper-Volta area to the cocoa areas in Asante. Similarly, expanding cities such as Freetown, Kumasi, Accra, and Lagos attracted thousands of able-bodied workers from the hinterlands in search for urban occupations paying comparable real wages as offered in the more dynamic parts of the countryside.
Bowden, Chiripanhura, and Mosley argue that long-term trends in African living standards during the twentieth century are primarily determined by the decision of colonial governments to allow or prohibit the occupation of agricultural land by European settlers. In settler economies such as Kenya—and to a lesser degree Nyasaland—Africans were pushed out of traditional income-earning opportunities through land alienation and unequal competition from European farmers, which reduced their bargaining power in the rural and urban labor market. In colonies where land alienation was explicitly forbidden by the government, the open land frontier put a floor under the market for indigenous wage labor. Bowden, Chiripanhura, and Mosley argue that the legal protection of indigenous land tenure systems produced a more equitable distribution of income based on smallholder profits and comparatively high rates of market wages.Footnote 51
However, unlike the colonial tax and migration regimes, land tenure regimes do not neatly separate West from East African colonies. In West Africa, land alienation was prohibited, but this was also the case in Uganda. Land tenure policies do offer a crucial additional explanation though for the question why real wages in some parts of East Africa did not convergence to West African levels until after the Second World War. Kenyan per capita government revenue, which had still been negligible in 1900, rapidly caught up with levels in the Gold Coast and not only exceeded the levels of Nyasaland and Uganda, but also those of Nigeria and Sierra Leone by a factor 3 in 1940.Footnote 52 Per capita exports followed a similar pattern. Indeed, the colonial economy of Kenya expanded much faster in the 1900–1940 era than most of the West African economies, with the likely exception of the Gold Coast. That real wages do not reflect rapid growth in Kenya can only be understood in the context of the uneven distribution of income and assets between native Africans and European settlers.
In Kenya, ca. 7 percent of the agricultural land was transferred to European farmers. This may seem a modest share compared to other settler colonies, such as Southern Rhodesia (49 percent) and South Africa (87 percent), but the alienated lands in the Kenyan Rift Valley were clearly the “high-potential” areas.Footnote 53 The native Kikuyu were pushed off their land into specially allocated “reserve lands” and forbidden to own land in what became known as the White Highlands. The owners of livestock among the Kikuyu, who needed grazing lands for their cattle, were the first who had to give up their traditional way of life. The reserves were unfit for large herds and the livestock farmers had little other choice than to lease land from European farmers to herd their cattle or reenter the Highlands as contract workers. The large size of European farms (over 5,000 acre on average in 1905) suggests that the reallocation of land through large concessions was not primarily motivated by maximizing productive efficiency, but rather by deliberate attempts to change the production relationships between settlers and natives.Footnote 54 Part of the displaced Kikuyu turned to the labor market in the largest cities such as Mombasa and Nairobi. It is therefore not surprising to find that the native population in Nairobi grew at an average annual rate of 6.41 percent between 1925 and 1945 (versus a 1.95 percent for Kenya at large) and that urban wages remained close to subsistence up to 1940.
In sum, the initial (precolonial) differences in commercial development between West and East Africa not only made the comparative returns to wage labor in West Africa larger, but also determined the institutional design of the emerging colonial states. East African colonial governments opted for more direct intervention in the labor market because they believed that laissez-faire policies would not solve the chronic labor shortages. In West Africa, workers were not forced to enter the wage labor market, they were attracted by the prospect of wages exceeding their opportunity costs in subsistence farming activities. The increasing integration of labor markets in the Indian Ocean under British rule, was a direct result of the problems that various colonial governments faced with a lack of skilled African labor as well as a widespread resistance among local Africans to work for wages. Finally, additional coercive colonial institutions, such as land alienation programs in Kenya, enhanced income inequality between European settlers and native Africans.
CONCLUSION
This article has shown that the annual wages earned by native unskilled male adult workers in the major urban centers of British Africa could sustain a nuclear household at subsistence level for the entire colonial period, with the exception of pre-1930 Nyasaland. Real wages increased during the colonial era in all of the countries we studied. To be sure, during and shortly after the First and Second World Wars wages fell, but they recovered relatively soon thereafter. In the 1930s real wages continued to rise in most cities, as prices tended to decline faster than nominal wages.
On a global level, welfare levels in West Africa and Mauritius were surprisingly high. Material living standards of West African urban dwellers were two to three times as high than those in major East Asian cities. From a historical point of view, real wage growth rates were respectable during the colonial era as well: they were in line and sometimes even outpaced the growth rate of real wages of unskilled workers in London during the nineteenth century. In East Africa, the increase in real wages mainly occurred during the postwar period and prewar levels were more in line with Asian levels. The contrast in real wages between British East and West Africa was remarkably persistent. Nominal wage gaps were entirely responsible for this gap, as price levels tended to be ca. 30 percent higher in West Africa until the 1930s. The Kenyan case has made it clear that the East-West gap is not only the result of a different type of economic dynamics (commercialization), but also the result of varying degrees of income inequality, especially between European settlers, Asian migrants, and native Africans.
The recorded differences in long-run trajectories of wage income growth call for a reinterpretation of the path-dependence nature of African economic development. Future research in African economic history should concentrate more than it has done hitherto on charting and explaining differences in long-term growth trajectories. It should also aim for a deeper understanding of the determinants of the real wage divergence across British Africa and explore how these relate to other parts of colonial Africa. A better grasp of the long-term picture of economic development, including the distribution of income, will help us to assess the possibilities of future growth and the extent to which specific historical or geographical conditions have cast a temporary, or a structural, effect on long-term African welfare development.