Introduction
Hundreds of thousands of individual acts of signing petitions amounted to the phenomenon of the first modern social movement—for the abolition of the slave trade. These waves of petitions, organized in campaigns, came in an unexpected moment, at a surprising scale, and swept to success over the brief, three-decade history of the movement from 1787 to 1807. The petitioning campaigns united Britons from all walks of life (Drescher Reference Drescher1994) under a shared template of action, expressing a set of ideas and emotions on behalf of people whose suffering was far removed from those petitioning.
It is impossible to trace the inception of antislavery thought in each and every Englishman’s mind who considered the question of the slave trade and concluded that it was “a great evil.” What might, however, be possible is to trace how the movement for the abolition of the slave trade got off the ground, and to pin down the sociostructural conditions that enabled its spread. In this article, I shift the emphasis from individual characteristics and religious piety to the structure of social relations, and the institutions providing the foci for discussion and debate on questions regarding the slave trade to make sense of the dynamics of the popular movement (Feld Reference Feld1981). Doing so, I build the microfoundations of macrolevel change (Hedstrom and Bearman Reference Hedstrom, Bearman, Hedstrom and Bearman2009) laying out mechanisms that made abolitionist petitioning possible. Theoretically, I build on recent work that highlighted the role of institutions outside of the state for political action: a role that they played in unification, rather than the creation and reinforcement of boundaries (Parigi and Bergemann Reference Parigi and Bergemann2016).
Historians of British abolition used overwhelmingly top-down lenses to understand the inception and unfolding of the movement (Anstey Reference Anstey1976; Brown Reference Brown2006; Cotter Reference Cotter1994; Davis Reference Davis1975; Hague Reference Hague2007; Hochschild Reference Hochschild2005; Jennings Reference Jennings1997), while paying less attention to the popular campaign (exceptions include d’Anjou Reference d’Anjou1996 and Oldfield Reference Oldfield1995). From this work, it would appear that the series of petitioning campaigns were a necessary consequence of sermons, shifts in literary text, and newspaper propaganda.
When considering the acts of individuals situating the popular movement in these frameworks, however, is challenging. Understanding petitioning in the relevant context of actors—ordinary men, often without voting rights in the British Isles—gives way to a set of explanations that seeks to make sense of abolitionism through the patterning of relations instead of sweeping change in collective consciousness (Erikson and Bearman Reference Erikson and Bearman2006; Gould Reference Gould1993, Reference Gould1995; Hillmann Reference Hillmann2008a, Reference Hillmann2008b), and how the emergence of new institutions shaped these patterns. Therefore, I depart from an individualistic view of moral action, and pivot to one that is formed in interaction (McAdam Reference McAdam1986; McAdam and Paulsen Reference McAdam and Paulsen1993; Snow et al. Reference Snow, Louis and Ekland-Olson1980; Tilly Reference Tilly2005). I focus on Manchester, one of the hotbeds of British abolitionism, and use primary source historical documents to demonstrate the importance of a set of necessary structural conditions for people signing an abolitionist petition.
Furthermore, I shift the focus of scholarship on industrialization that emphasizes the development of the middling classes and class consciousness to the development of new institutions of industrializing towns. This early period of industrialization when factory towns were only starting to emerge saw a remarkable increase in the creation of voluntary associations: clubs and societies with regular meetings at coffeehouses, inns, and taverns (Clark Reference Clark2000). Even if the voluntary organizations were short-lived, the brick-and-stone buildings remained, providing the places to meet, read, and activate sentiments through discussion (Clark Reference Clark1983; Everitt Reference Everitt and Milner1973; Green Reference Green2015; Money Reference Money1971). Just as boarding houses were instrumental in shaping voting, and the patterning of co-residency was able to unite, rather than reinforce, party factions during the periods of most acute polarization (Parigi and Bergemann Reference Parigi and Bergemann2016), these emerging secular institutions were equally important for expressions of political opinion by ordinary people during the campaigns for the abolition of the slave trade.
The data and analytical strategy used in this article deviates from the classical regression framework (Abbott Reference Abbott1988), while adopting causal thinking (Winship and Morgan Reference Winship and Morgan1999). I exploit the temporal ordering of signatures—with no panel data at hand—to ask and answer what micromechanisms may have been at play to generate the petition that I analyze. I use the spatial locations of people and institutions to generate inferences about how Manchester residents signed the petition. I use computational experiments to rule out competing explanations for the spatial concentration of petitioners induced by institutions, such as population density, family, religious congregations, or the concentration of occupational groups. This way the null models that I contrast empirical evidence with already take historically grounded features of the data into account and make critical tests possible. Using these lenses, the article makes a contribution to historical social science as it “[links] the particularities of time and space with an analysis of causal relationships or mechanisms” (Clemens Reference Clemens2007: 528).
To anticipate the main finding, I show that petitioners clustered in neighborhoods and centered around gathering places: inns and taverns that housed traders from other communities that have already engaged in the movement. This finding sheds light on the institutions that were necessary to scale mobilization within communities, and helps us understand how abolitionism was able to garner nationwide support cross-cutting class lines (Brewer Reference Brewer1986). Also, I show that although religious ideology played an important role, it exerted much of its influence through kinship ties on petitioning. The family and the church as primary foci for social relationships shaping action, however, are unable to account for the emerging geographic pattern of support for abolition.
This article is organized as follows: first, I briefly summarize the unfolding of the campaign for the abolition of the slave trade and introduce the most important arguments that have explained it. Second, I turn to the empirical context and describe my data on abolitionist petitioning in Manchester. I make inferences about the social relationships supported by the institutional context that made this petition possible. In conclusion, I return to the historiography of abolition as well as to the broader implications of this study.
The Chronology of British Abolition
The battle for British abolition was fought in Parliament, with the petitioning campaigns providing some of the “raw material” for debates. How impactful petitions were in bringing about change in legislation is not at issue in this article. The debate in Parliament, and other events that got associated with the abolitionist campaign, however, give important background for understanding how historians have explained the movement. For this reason, a brief review of the movement’s chronology is warranted.
A detailed summary of the relevant events for British abolition can be found in Drescher (Reference Drescher[1977] 2010). The first attempt to put abolition on the political agenda was a Quaker petition from 1783.Footnote 1 It was swiftly dismissed on the grounds that the practice of the slave trade and slavery was so integrated into the customs of the colonies and ingrained in the relationship between the motherland and the new territories that members of Parliament saw no reason for change. A small religious sect’s ideas of social justice and moral right and wrong were pitted against broad-stroked national interests.
The Society for Effecting the Abolition of the African Slave Trade (hereinafter Society) was founded in 1787 and pledged to pursue the cause of abolition inside and outside of Parliament. This organization was overwhelmingly Quaker. Leaders of the Society forged close ties to political allies, which were often made possible by their shared religious ideology, while not necessarily sharing a denomination. For instance, to William Wilberforce, a member of Parliament, who together with William Pitt, prime minister at the timeFootnote 2 led the abolitionist debates in Parliament (Hague Reference Hague2007). Unrelated to the activities of the central committee, the Wesleyan Methodist church was also involved in spreading a message in opposition of the slave trade. A demonstrative example of this engagement was John Wesley’s visit to Manchester in 1787 where he preached to the Methodist congregation, and any townsfolk who came to listen, on the issue of evils of slavery.
The 1788 petitioning campaign was an important reference in the first debate in Parliament in May 1789, which considered total abolition. This debut lay the foundations of a new domestic and, later on, worldwide policy (Quirk and Richardson Reference Quirk and Richardson2010). The Manchester petition, emblematic of this campaign, bore 11,000 signatures, a fifth of the city’s population. On the occasion of the second campaign in 1792, the order of magnitude of public support was greater than for any other issue, and it also exceeded all other concerns of British subjects (Drescher Reference Drescher1986: 59).Footnote 3
As a result of the dynamic in Parliament—where reference to petitions was mostly used as a rhetorical trope—the first slave-carrying act was passed in 1789. This became known as the Dolben Act, which regulated the trade to improve the conditions of the African slaves during the middle passage. Soon after, the macropolitical landscape changed: the French Revolution turned into terror, and news arrived about the St. Domingue slave uprising, which altered the dynamics of the debate in Parliament (Porter Reference Porter1970). All these factors contributed to the slowing down of progress in legislation, though the Society continued to organize petitions. These macropolitical events shifted the meaning of abolitionist petitioning, which became associated with rebellion and dissent, and thus was a less favored as a tactic in the eyes of the Society’s leadership past 1792 (Jennings Reference Jennings1997).
Slow progress characterized the coming years. Although Parliament, despite multiple attempts, did not pass the abolition bill, it did decide to develop the newly acquired territories at a slower pace than the old ones. In 1804 the Commons passed a general abolition bill the first time that the Lords tabled on grounds of late arrival. The foreign and general abolition bills were finally passed in 1806 by both houses and took effect on January 1, 1807. Past this act the campaign against the slave trade opened a new chapter: that of international pressure and diplomacy, to compel other nations—the Dutch, the Portuguese, the Swedish, and the French—to abolish their slave trades.
These salient events, the activities of the Society, and the biographies of prominent figures influenced the understanding of British abolition in important ways, without much careful attention to the participation of the masses. I now turn to review the historical arguments that attempt to answer the questions of “why” and “how” abolitionists emerged.
Drivers of Abolitionist Petitioning
Antislavery action by most historians have been either theorized from the perspective of beliefs and sentiments, or from the perspective of interests. Specific theories are discussed in the text that follows, but their causal structure follows similar general patterns. On one hand, antislavery beliefs and sentiments were seen to have emerged from shifts that occur in the “shared consciousness” of a nation or a smaller group. The rise of the print media, and the increased availability of literary texts, sermons, and information about the slave trade moved the needle in individual minds from support of the slave trade to inculcating antislavery views (d’Anjou Reference d’Anjou1996). On the other hand, it has been argued that interests for maintaining the slave trade shifted with changing economic circumstances. These shifting economic interests implicated certain individuals and groups to fight for abolition.
The construction of the interim steps that have the potential of building these macrolevel shifts from the ground up is necessary (Hedstrom and Bearman Reference Hedstrom, Bearman, Hedstrom and Bearman2009) to understand the behavior of those who signed antislavery petitions, that is, the acts of ordinary men that made this movement extraordinary. In what follows, I first construct three primary hypotheses, and then review the historical arguments that account for abolition, and the challenges they pose to each of these arguments. Constructing these hypotheses I focus on where beliefs, sentiments, and interests would coalesce in such a way to produce successful collective action. What is common to all is the attention to the physical architecture punctuating and structuring everyday life, giving rise to uneven distributions of social contact among people is key to understand abolition. I see “the relevant aspects of the social environment … as foci around which individuals organize their social relations” (Feld Reference Feld1981: 1016), foci like voluntary organizations and hangouts. If sentiments and beliefs are to be translated into action, petitioning needed to be made salient in relationships through sharing information about the petitioning campaign (see also Erikson and Samila Reference Erikson and Samila2015), or through discussing its stakes.
At this historical period most every day interactions would take place in one’s neighborhood. It is no coincidence that the Clapham Sect, a network of friends and families that founded the Society, was referenced by the place where members of this group often met, rather than its leader or pivotal issue. This, now London neighborhood was where these families formed their shared moral and spiritual values in discussion and translated these into social activism. Therefore, I hypothesize that
H1: A person will be more likely to petition if his neighbors also petition. Furthermore, neighbors are more likely to petition together.
British neighborhoods were defined increasingly by their voluntary organizations and gathering places from the 1780s. For ordinary men, inns and taverns provided locations for public meetings and gatherings organized by voluntary organizations and, thus, focused their social lives. They were also locations where the local as well as national newspapers circulated (Aspinall Reference Aspinall1946). Besides the already-mentioned social and economic functions of inns they were places for auctions and sales, the cornerstones of transport networks, and the mail coach system (Green Reference Green2015, Jennings Reference Jennings2011). Green concludes that “inns and not coffeehouses [were the] venues for societal integration, rational debate and for clubs and societies” in provincial England, and that “inns seem to have played a major part in the transformation of the public sphere” (ibid.: 70).
John Brewer describes the period of the petitioning campaigns as the one when politicians came in interaction with the public, and these interactions took place in such newly emerging institutions—see for example, the print titled the Coffeehouse Politician (Brewer Reference Brewer1986: 128). Inns, however, differed from one another in terms of their audience, and each housed different kinds of associations. Around those inns where discussions about the slave trade were more likely, or whose audience was likely sympathetic to abolition, I expect more petitioners. In particular, traveling merchants, who were important carriers of information and news, coming from communities with successful campaigns were more likely to inform and influence locals about and in favor of abolition. Therefore, I hypothesize that
H2: Petitioners will cluster around inns and taverns where traveling merchants, who came from communities with previous participation in the movement, stayed.
Even though voluntary organizations were ephemeral, and faced substantial challenges in the 1790s, the leadership of the abolition movement and institutions where sympathizers met exhibited remarkable continuity (Clarkson Reference Clarkson1836). Therefore, it is probable that the families and institutions involved early in the movement stayed sympathetic to abolition and were able to activate social relationships and organizational knowledge in drafting petitions and collecting signatures. Therefore, I hypothesize that
H3: Petitioners will cluster around inns and taverns with institutional legacies of participation in abolitionism.
The historical narrative poses numerous challenges to these arguments and offers various alternatives to the impact of neighborhoods and gathering places, most importantly it focuses on family, religiosity, and occupation. I turn to reviewing these arguments and articulate them from the point of view of individuals. I hypothesize that the preceding hypotheses (H1–H3) withstand these challenges, that is, the spatial clustering as described previously cannot be induced by these alternatives. Importantly, in this article I am not testing the validity of the arguments previously put forth, rather, I show that the spatial patterning of petitioning cannot be reduced to them.
The upsurge of evangelicalism and the emergence and dissemination of secular social philosophy provided individuals with ample material to draw upon (Davis Reference Davis1966) and to ponder about matters of the slave trade. Antislavery activism was first apparent among Quakers, who banned and sanctioned slave holding through resolutions brought at their yearly meetings. Unsurprisingly, the historiography of abolition focused closely on prominent Quakers as highly visible political, or moral, entrepreneurs (Jennings Reference Jennings1997) and the way in which they made sense of their actions. Given this evidence, historians often locate the movement’s drivers in the religious sphere, and abolitionism has been described as the necessary consequence of moral progress (Anstey Reference Anstey1976; Klingberg Reference Klingberg1968 [1926]).
Projecting these arguments to the microlevel of individual actors, they explain abolitionist action well within Quaker religious communities. The tightly knit groups of congregations provide the loci for public deliberation about the issues of the slave trade. An increased sense of morality and interest taking in the well-being of others, fostered by sermons, literary texts, and potential sanctions leading to taking part in petitioning, is the obvious micromechanism at play. Quakers, however, were not particularly well positioned to initiate and sustain mobilization nationwide, given their small number and relationship to traditional sources of political influence. From this follows that, relative to their population share, Quakers would disproportionately participate in the abolition movement and would petition together as a group. These ideas pose a significant challenge to H1–H3, as religious communities, if spatially segregated, could have produced the hypothesized spatial clustering. Therefore, I test if the geographic patterns remain and cross-cut religious communities.
The understanding of the movement as a religious one remained unchallenged up to the 1940s when Eric Williams advanced the “decline thesis” (Williams Reference Williams1994 [1944]). This states that the slave trade’s abolition was a direct consequence of shifting economic interests, as the British West Indies were on an irreversible economic decline both as tropical producers and importers of British goods due to “inefficient slave labor, white population loss, chronic indebtedness, soil exhaustion, and plantation bankruptcies” (Drescher Reference Drescher[1977] 2010: xiv). Although these specific claims have all been refuted (Jennings Reference Jennings1997: vii; Thomas Reference Thomas1997: 541),Footnote 4 Williams’s argument replaced the “moral progress” logic with the logic of shifting economic conditions and brought the concept of interest to the fore.
The most influential treatment of the abolition movement in this perspective in modern historiography was written by Davis who focused on the interests of the emerging middle class (Davis Reference Davis1975) and linked this to the flourishing of the movement. Davis argued that the movement set the morally accepted boundaries for the relationship between employer and laborer, regulated by nothing but the wage. He suggested that the movement “reflected the ideological needs of various groups and classes” (Davis Reference Davis and Bender1992: 19) and may have served as a tool for legitimating the unregulated labor market in nineteenth-century England.
Projecting these arguments to the microlevel of individual actors, they implicate a model in which actors who could benefit from abolition—factory owners and independent businessmen—would support the movement. From this follows that participation in petitioning will be more likely among those who are manufacturers and run their own businesses.
An alternative way of conceptualizing economic interest is to link them to the production and sale of cotton. From this follows that manufacturers and traders directly involved in retailing and manufacturing of cotton would refrain from petitioning. Contrary to this expectation, Haskell argued that “a change [occurred] in the perception of causal connection and consequently a shift in the conventions of moral responsibility—that underlay the new constellation of attitudes and activities” (Haskell Reference Haskell and Bender1992: 111). Projecting these arguments to the microlevel of individual actors all individuals close to “the market”—including those trading cotton—would support abolition due to a shift in cognition and causal reasoning. From this follows that merchants and traders, but not manufacturers, would be more likely to participate in abolitionist petitioning.
Ashworth, argued that the rise of capitalism produced social problems first, which threw individuals in a state of crisis about morality, from which the movement for the abolition of the slave trade emerged (Reference Ashworth and Bender1992). In other words, participating in the abolition movement became a sort of identity-redeeming activity, or a device to produce social status in local communities.Footnote 5 Although providing a different mechanism-based argument, this theory anticipates that the newly emerging elite in manufacturing and trade would be supporting the movement with a high likelihood.
Though some of these arguments have contradictory expectations, they would all challenge the primary hypotheses of H1–H3 in the following, uniform way: they all may induce special clustering of petitioners. First, occupational groups may have been spatially clustered, as well as could have formed the base audience of specific gathering places. Second, kinship structures were the first layer for association among individuals and were important for political action. Prominent leaders of the movement became engaged through their “bloodline,” for example, James and Richard Phillips who were both founding members of the Society were cousins. Third, religious congregations may have also drawn their audience from specific neighborhoods. Obviously, kinship, occupation, and religious background are not independent, especially at this historical junction. In the analysis I develop in the article, I test spatial clustering of petitioners against each of these alternative explanations in turn.
Data
I use six sources of primary data: (1) an abolitionist petition signed by residents of Manchester and its vicinity currently at the British Parliamentary Archives (HL/PO/JO/10/8/106); (2) Dean’s Trade Directory of Manchester and Salford (Dean Reference Dean1807); (3) Laurent’s historic map of Manchester from the Harvard historic map collection; (4) burial records of the Quaker congregation in Manchester from Ancestry.com; (5) records from the Manchester Mercury documenting the 1788 petitioning campaign for abolition; and (6) the Journals of the House of Commons.
These sources are used to identify Manchester residents, with their occupations, addresses, the physical location of where they lived and worked, whether they petitioned, and whether they likely belonged to the Quaker congregation. Furthermore, these sources also identify how close residents lived to one another, to the multiple inns and taverns in Manchester housing traveling merchants, and to other institutions that were active in the abolition movement from its inception. Moreover, they allow me to differentiate between inns and taverns in terms of exposure to merchants coming from communities with previous successful abolitionist petitions. Finally, the sources also reveal the temporal distance between signatures on the petition. I discuss each measure I constructed in turn, and the materials necessary to construct these measures as hardly any of them come from a single source.
Measures
A Sample of Manchester Residents
I used Dean’s Trade Directory of Manchester and Salford (Reference Dean1807; hereinafter Directory) to gather information about a sample of the population: names, addresses, and occupations. The Directory contains 10,059 entries (14 percent of the population); 775 of these entries (8 percent of the entries) are records of companies and 1,079 (11 percent of the entries) belong to females. Of all the entries, 697 (7 percent) do not have an address listed.
Petitioners
I capture participation in the abolition movement with the act of petition signing for the abolition of the slave trade. This is an excellent measure of movement participation for two main reasons. Petitioning required deliberate effort and was a public act. During the major abolitionist campaigns petitions were displayed at various locations in the communities that initiated them (Oldfield Reference Oldfield1995).Footnote 6 As a consequence, petitioners had to make a deliberate effort to sign and walk to where the petition was displayed. The act of signing the petition was witnessed and scrutinized by others. During the time of the public campaigns, participation in the slave trade became especially socially salient, an act that was much less exposed to the public eye (Ingram and Silverman Reference Ingram and Silverman2016). Furthermore, multiple petitions were printed by the local newspaper that explicitly mentioned (at least some of) the individuals by name who signed them. This opened up individuals to public scrutiny much wider than the audience of signing the petition, and this scrutiny indeed characterized contemporary press (Hunt Reference Hunt1977).
I use data from a Manchester petition, which is the only surviving complete petition that allows the attribution of participation in the British abolition movement to ordinary individuals using their signatures. While newspapers at the time also publicized petitions, sometimes including the names of individuals who signed them, these lists are incomplete and usually contain only names of the elite signers. The document I analyze survived the 1834 London fire that destroyed all other petitions for and against abolition from this period.Footnote 7 The petition was signed by 2,348 residents (about 3 percent of the population) and was sent to the House of Lords in 1806. Not only the list of names but also their exact placement on the petition is recorded as well.Footnote 8 Of the 2,348 petitioners 52 (2 percent) did not have a legible/complete last name. These were dropped from the analyses as the identity of these petitioners could not be ascertained with any degree of confidence. The remaining 2,296 signatures break down into 2,269 individuals and 27 companies. Of the 2,269 individuals only 5 were female, who were also dropped.
I identify petitioners among the sample of Manchester residents by matching the names appearing in these two documents, and assuming that names uniquely identify individuals.Footnote 9 The procedures I used for matching are summarized in the Supplementary Materials on Data Sources. In the analyses that relies on such additional information I only use exact matches (approximately 50 percent of the petitioners), that is, I only link names on the petition to individuals in the Directory if these names were exactly the same.
Quakers
At this time no church was keeping a member registry of their congregations in Manchester. For this reason, to construct a measure of congregational belonging, I collected data on all registered burial between 1770 and 1830 to identify the prominent Quaker families in Manchester.Footnote 10 These data contain information on 456 burials. I used the burial records to identify Quakers by matching the last names to the sample of the Manchester population. Those whose last names matched one of these last names, I call Quakers for ease of presentation. Note, however, that these last names do not identify Quaker families with complete certainty.Footnote 11
Distance Measures among Individuals
I measure the physical distance of Manchester residents to one another, as well as to focal points: inns and taverns housing traveling merchants and historic venues involved in the movement. To be able to calculate these distances, I constructed a historic GIS of Manchester. I started with the image scanned from the Harvard Map CollectionsFootnote 12 in high resolution. First, I digitized each feature on the map including streets, lanes, and allies labeled on the map. Thankfully, the street names changed relatively little, so did the layout of the city center over the past two centuries, which allowed me to position the historic map over the contemporary map relatively easily. I used the following reference points: the intersection of Green-gate and Gravel Lane (53° 29′14.536″N, 2° 14′55.349″W), the intersection of Shudehill and Hanover Street (53° 29′8.142″N, 2° 14′13.834″W), and the intersection of Quay Street and Byrom Street (53° 28′43.385″N, 2° 15′6.545″W).
Having digitized each feature of the historic map using the name indicated by Laurent, I ascertained the directions of the streets by checking them against today’s map and using the rule of thumb that side streets radiated out from the main streets. I assigned the range of addresses by using the range found in the Directory for that street as a proxy, and cross-checked that range with other streets of similar length. Following this, I conducted searches using today’s map for the features listed in the Directory but not found on the historic map. Note that street names could have changed between 1794 when the map was created and 1808 when the Directory was compiled, and that new streets were added in between these years. I digitized all other features that I found on today’s map, which were listed in the Directory and were located around the center of Manchester or Salford. Finally, I assigned street numbers to the streets by starting on one side up and down on the other. Street numbering generally followed this rule before the modern numbering system, with odd numbers on one side of a street and even on the opposite side, which was introduced in the 1830s (Shaw, Reference Shaw1982).
I geolocated individuals and firms from the Directory using their business addresses. Of the 9,362 entries from the Directory with addresses, 7,356 (79 percent) could be geolocated using the procedure described in the preceding text. A total of 721 (8 percent) were linked to features found on the contemporary map. Also, 1,066 (11 percent) of entries in the Directory lacked house numbers; these were assigned to the center of the features. These coordinates allowed me to measure distances between individuals.
I also measured the distance between petitioners based on when they signed the petition. Because door-to-door canvassing was not the way in which signatures were gathered, the ordering of names on the petition reflects the temporal ordering of individuals signing it. Consequently, the distance between the names on the petition measured by the number of other names in between them is a monotone function of the time elapsed between signatures. Those who signed their names close to each other on the petition co-occurred in time and space, and vice versa.Footnote 13
Distance Measures among Individuals and Focal Points
The locations where the petition I analyzed were displayed are unknown. However, the Directory lists all merchants who regularly came to sell their merchandise in the city, their trade, the cities or towns they came from, and the inn or tavern where they lodged. Furthermore, the Manchester Mercury published the locations where an earlier petition was hung in the month of January of 1788.Footnote 14 I treat all these institutions as focal points (Liu and Bearman Reference Liu and Bearman2015; Liu et al. Reference Liu, King and Bearman2010) of social life where politics and contemporary events were discussed.
The Directory identifies 58 inns in Manchester where traveling merchants lodged on a regular, weekly basis, some only housing 1, and 5 of them housing more than 20 such travelers at a time.Footnote 15 I use these data to differentiate inns and taverns based on the communities they drew their traders from. I categorized these communities based on their previous activity in the abolition movement using the Journals of the House of Commons that lists all abolitionist petitions, therefore giving me the ability to assess if an inn housed merchants from a previously active abolitionist community.
Furthermore, I cross-referenced all the institutions listed in the Manchester Mercury with the Directory that were mentioned in connection with the abolition movement previously. They all persisted in the interim period,Footnote 16 and their precise addresses were recovered through finding the keepers of inns in-residence, as well as tracing the family and street names listed in association with them. The geographic coordinates of institutions established this way allowed me to measure the distances between these and individuals.
Analytical Strategy
The petition from Manchester shall provide insights into the social positions that made individuals more likely to petition compared to others, as well as the social relationships that drew people to signing it. The analyses in this article proceed in three steps. First, it establishes that petitioners clustered in physical space more than population density would suggest. Then, I establish that this clustering is not due to religion, family, and occupations but rather is associated with the location of key institutions.
The underlying logic behind the critical tests for the outlined hypotheses is to construct strategic comparisons to answer “how would petitioners distribute in Manchester” or “what would the petition look like” if well-defined behavioral mechanism governed petition signing. In some of the analyses I compare many samples of individuals from the Directory to those who petitioned to answer the latter. In another set of analyses I leverage the ordering of names on the petition, providing an even more rigorous test of the structural processes of petitioning to answer the former.
Note that no direct measure of social relationships could have been collected at the population level, instead, relationships are inferred from the location of names on the petition, physical proximity, shared occupation, or family name. The motivating idea behind making this inference is straightforward: if interactions were decisive for petitioning one should be able to trace the “signature” of these interactions in the data, increasing the chances of co-occurrence of the kinds of individuals who likely interacted. One can imagine individuals seriously considering the question of the slave trade, and going with purpose to sign the petition with like-minded others, or, a more spontaneous scenario, individuals conversing at a tavern or inn, and out of that interaction the desire emerging to weigh in on the question of the slave trade. In either scenario, these interactions were nonrandom (Blau Reference Blau1977; McPherson and Smith-Lovin Reference McPherson and Smith-Lovin1987; McPherson et al. Reference McPherson, Smith-Lovin and James2001), nor was the process that led to convergence in behavior.
The Prominence of Focal Points for Mobilization
Spatial Clustering of Petitioners
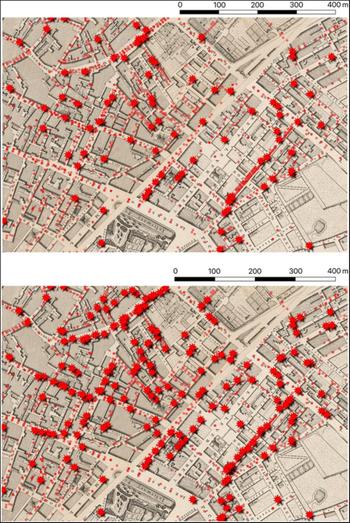
I mapped petitioners and nonpetitioners in Manchester and surroundings using the self-built historic GIS of the city described previously. These data are represented in Figure 1 where the dots symbolize nonpetitioners and the stars symbolize petitioners. The subfigures represent petitioners using the two thresholds to establish who signed the petition. In the map on top I use exact matches of petitioners to individuals in the Directory, and randomly select individuals from the Directory when multiple matches are available—a less conservative approach. In the map at the bottom, I only represent individuals as petitioners who have a unique exact match in the Directory—a more conservative approach.
Map of Manchester centered on High-street.

I first establish that meaningful spatial clusters existed, identifying them net of variation in population density, and therefore show that petitioning was neighborhood based. Then, I show that focal points are indeed in the clusters I identify. Furthermore, I demonstrate that clusters withstand the challenges that kinship, occupation, and religiosity pose. I consider multiple different ways of clustering petitioners to conduct robustness analyses. I rely on the sample of petitioners with unique exact matches from the Directory, but additional robustness checks on a sample of petitioners with multiple exact matches show a pattern similar to the one reported here.
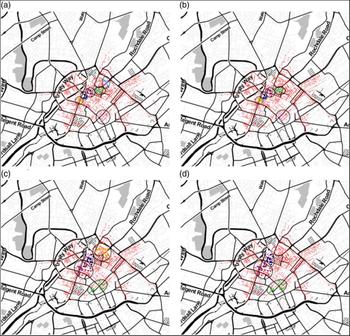
I identify clusters of petitioners proceeding in two steps. First, I identify petitioners who were surrounded by other petitioners more densely than the surrounding population,Footnote 17 whom I call high-density petitioners, then I cluster these individuals in groups. I use hierarchical clustering methods on the petitioner-to-petitioner distance matrix, where distances are calculated between geographic coordinates of petitioners.Footnote 18 I identify two sets of clusters with different “cutoff” points to delineate clusters—a more, and a less, conservative approach for groupings, yielding clusters of different sizes and radii. I select the clusters based on size, within-cluster distance among petitioners, and the share of high-density petitioners. Based on these parameters, Figure 2 contains four solutions. Not surprisingly, there is considerable overlap between the petitioners identified who belong to these clusters. For the analyses that follows, I used the stricter selection criteria of picking clusters, that is, I require clusters to contain at least 80 percent of high-density petitioners explained previously, but robustness analyses yield similar results when relaxing this criterion.
Clusters of petitioners over population density.

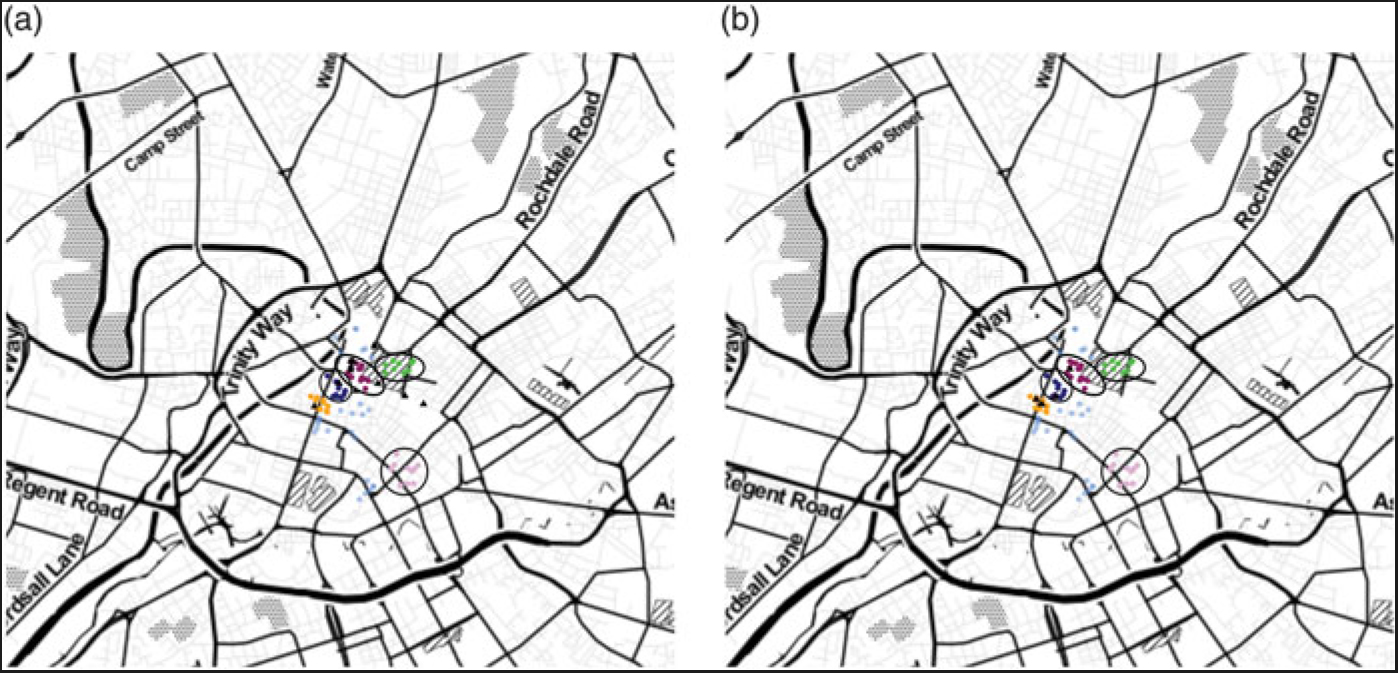
Two sets of institutions distinguish the significant clusters from other areas of the city where the spatial clustering of petitioners is not apparent: the location of institutions that were historically involved in abolitionist petitioning, as well as inns and taverns housing merchants who came to Manchester on a weekly basis from communities that had previously petitioned for abolition. Figure 3 shows the locations of the two sets of focal points and the clusters selected by the stricter criteria, respectively.
Clusters of petitioners containing at least 80 percent high-density petitioners.

To identify the inns that were in the clusters of petitioners, I considered petitioner density around the inns using various radii (50m, 100m, 200m, 300m), and only including petitioners who belonged to the significant clusters, otherwise, the inns with the highest population densities (and highest number of petitioners on that token) would be identified. The inns in the clusters were identified based on how extreme the density of petitioners around them was: at least a standard deviation away from the mean based on at least two of the four radii considered.
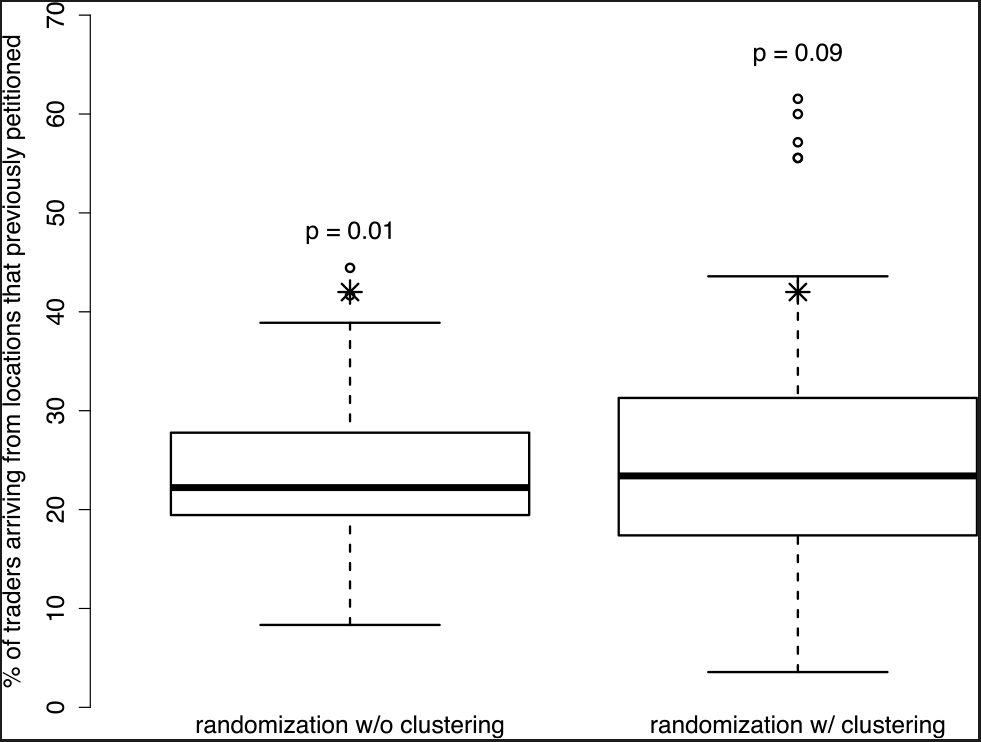
Of the traveling merchants housed in these inns 40 percent came from communities that had sent a petition in one of the two major petitioning campaigns taking place earlier compared to the expected 23 percent. This difference seems substantively large, but is this statistically significant? To establish this, I constructed confidence intervals and p-values around the expected share of merchants coming from towns that previously petitioned using Monte Carlo experiments. First, the merchants were randomized across inns, keeping the number of merchants per inn constant, respecting the architecture and the way in which space was organized in Manchester, but ignoring the obvious clustering of individuals in inns coming from the same location (Figure 4a). Second, the entire population of inns were randomized across inns, respecting the clustering of merchants in inns, but compromising architecture and the carrying capacity of buildings (Figure 4b). This reveals the difficulty of constructing counterfactuals, but it also helps clarify the meaning of this finding. Petitioners cluster around institutions that hosted merchants coming from communities that actively organized for abolition in the form of petitioning at a previous time point. Robustness checks yield results consistent with the analyses presented in Figure 4.Footnote 19
Percentage of traders from locations previously petitioned for abolition.

This provides suggestive evidence so far for H1–H3. I tested if these clusters contained no fewer family names than expected by chance sampling from the family names on the petition, as well as from the occupations of the petitioners identified by the Directory, suggesting that these clusters were not clusters of particular families or occupational groups. These analyses suggest that H1–H3 withstand these challenges.
I turn next to a set of analyses that exploits both the spatial and temporal dimensions. I ask if petitioners whose signatures followed one another also lived and worked near each other. I then further the robustness of this finding to family, religiosity, and occupation.
Spatial and Temporal Clustering of Petitioners
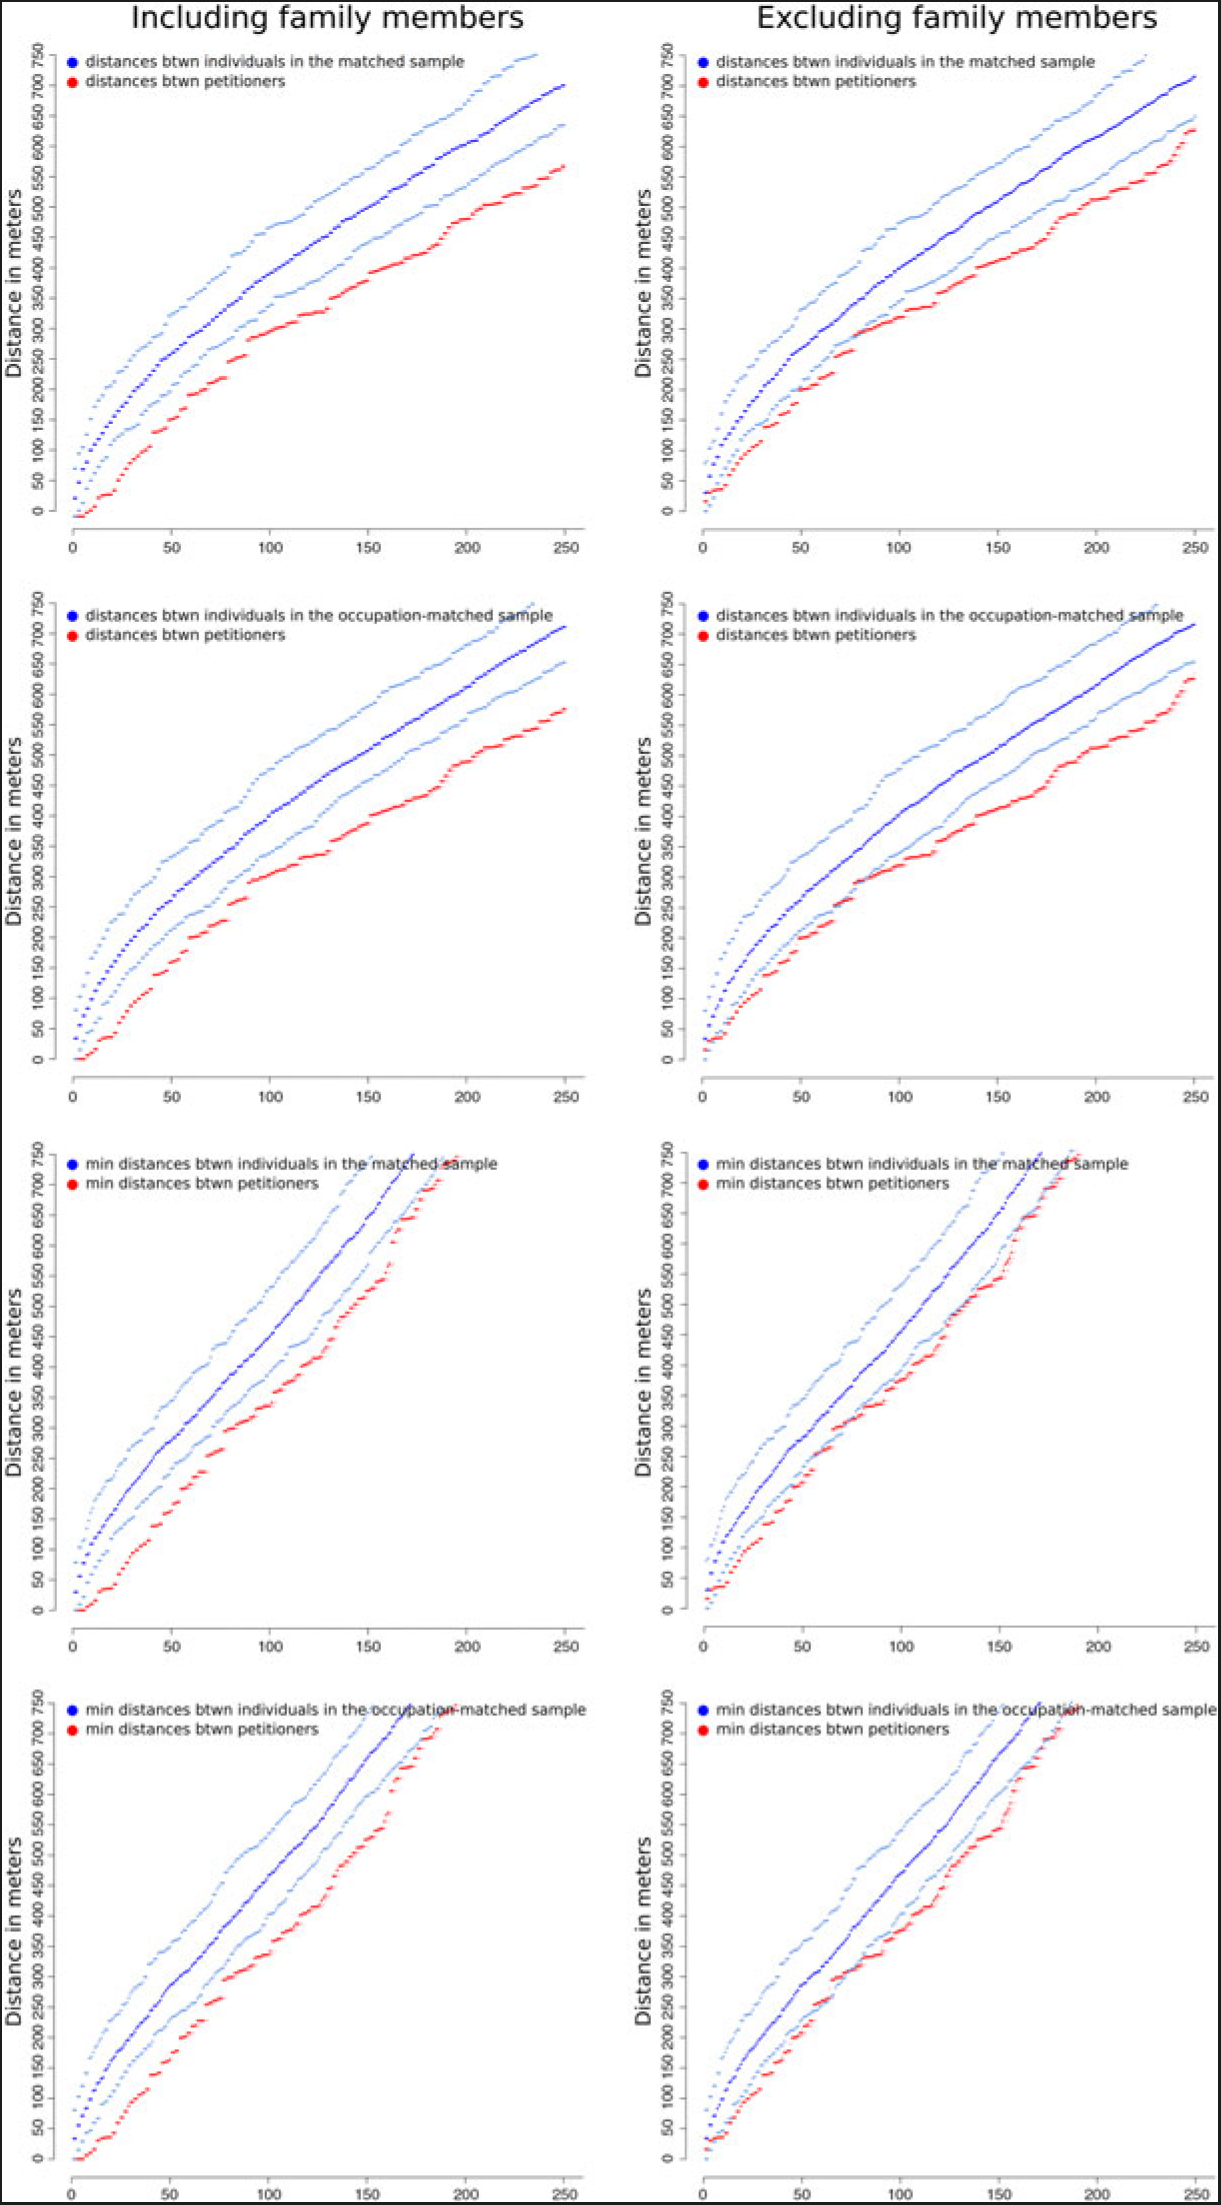
First, I define a “neighborhood” on the petition, where petitioners within the same neighborhood are “close,” and in different neighborhoods are “far.”Footnote 20 I selected two thresholds: 5 and 10 signatures before and after the focal petitioner and call them “neighborhoods” on the petition. Some families represented themselves with multiple members, in fact, sometimes with more than 5 signing consecutively, but never more than 10. I measure the physical distance of the focal petitioner to others in her neighborhood on the petition using the geographic coordinates of petitioners. I consider all the distances in one set of analyses, and only a minimum of them in another, and compared the empirically observed data to what would be expected by chance, sampling “would-be petitioners” from the Directory. One could think of this strategy as a matched-pair analysis. I repeat the procedure based on occupational category,Footnote 21 when would-be petitioners are only selected from those sharing an occupation with the petitioner, keeping the occupational distribution of the petition constant. I perform these calculations including, as well as leaving out, family members to control the impact of kinship on geographic clustering.
The results can be seen in Figure 5. In this figure, the first column contains distances calculated between petitioners in the five individual radius neighborhoods, using the sample of petitioners with unique exact matches in the Directory. On all subfigures, the points at the bottom show the empirical data and the confidence interval around it.Footnote 22 Similarly, on all subfigures the points forming the top three lines show distances among would-be petitioners who are sampled from the Directory, and are assigned to a position on the petition, along with the respective confidence intervals. The subfigures in the rows differ as the assignment strategy, as well as the distances, displayed change. In the first row, would-be petitioners are randomly assigned from the Directory, and all distances are displayed for each focal petitioner. In the second row, I restrict the assignment procedure to those with the same occupational categories. The third and fourth rows differ in including only the minimum distance for each petitioner, that is, each petitioner contributes only a single distance here. The same emerges when changing the radius of the neighborhood on the petition to 10 (not shown).
Comparing distances between petitioners and “would-be petitioners” in physical space.

The gap between the empirical distances and the distances arising from the matched samples noticeably close when family members are excluded, that is, some of the spatial clustering of petitioners driven by family members living under the same roof or nearby. Most importantly, however, the difference is not accounted for entirely by family members’ clustering, that is, petitioners from different families are still closer to one another than what chance would predict. Additionally, the results are not driven by occupational clustering of individuals in the city. This set of analyses bolsters the confidence in H1–H3 and provides further evidence that family and occupation does not challenge the results. Now, I turn to further examine the impact of kinship and the Quaker congregation on petitioning.
Activist Families
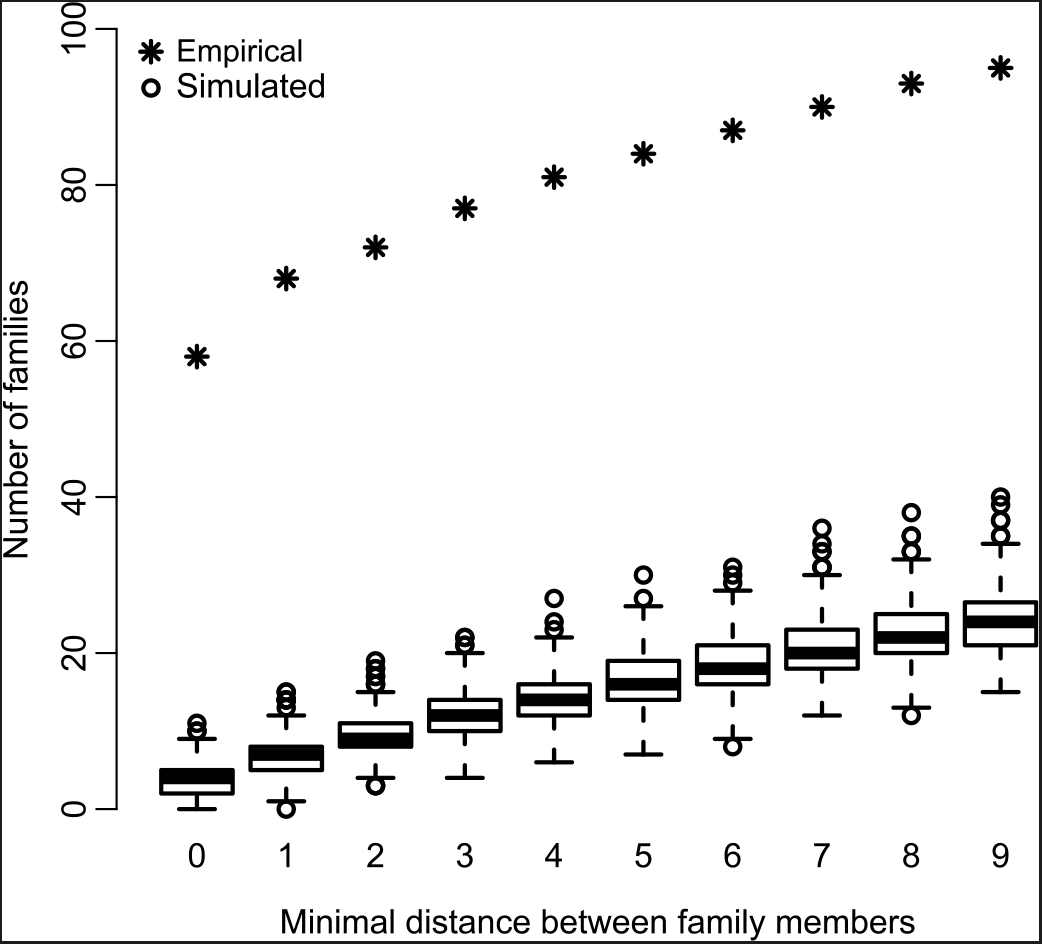
An implication of the previous set of analyses is that family members signed close to one another on the petition. The analyses presented here next demonstrates this finding, and further tests if this is caused by Quaker families, and if different Quaker families petitioned together. Of the circa 400 families whose multiple members figure on the petition, I measured the within-family distance on the petition for each family. Distance here is simply the number of signatures in between petitioners. I compute each distance and take the minimum of these. If the shortest distance between family members is zero, it means that there are at least two individuals sharing a last name who signed the petition one after the other. If it is one, it means that there are at least two individuals sharing a last name who signed the petition with only a single individual in between, but no two members signing consecutively and so forth. Each family is assigned only one number, so for instance, the fact that multiple family members signed the petition in a row does not inflate this statistic.
I count the number of families for whom the within-family distance stays at or is below a threshold using thresholds from 0 to 9. Then, I reshuffle the names on the petition 1,000 times, and compute the same set of statistics. The empirically observed statistics are displayed as stars and are compared to the simulated ones displayed as black box plots in Figure 6. This figure shows that 58 families have family members signing the petition one after each other, compared to an average of 4, which would be expected by chance, a meaningful and highly statistically significant difference. Note that this latter analysis does not rely on the Directory in any way; in other words, it only involves the individuals who petitioned. It reveals that about 15 percent of the families whose multiple members show up among the petitioners petitioned with a family member, thus, 85 percent did not.
Comparing within-family distances on the petition.

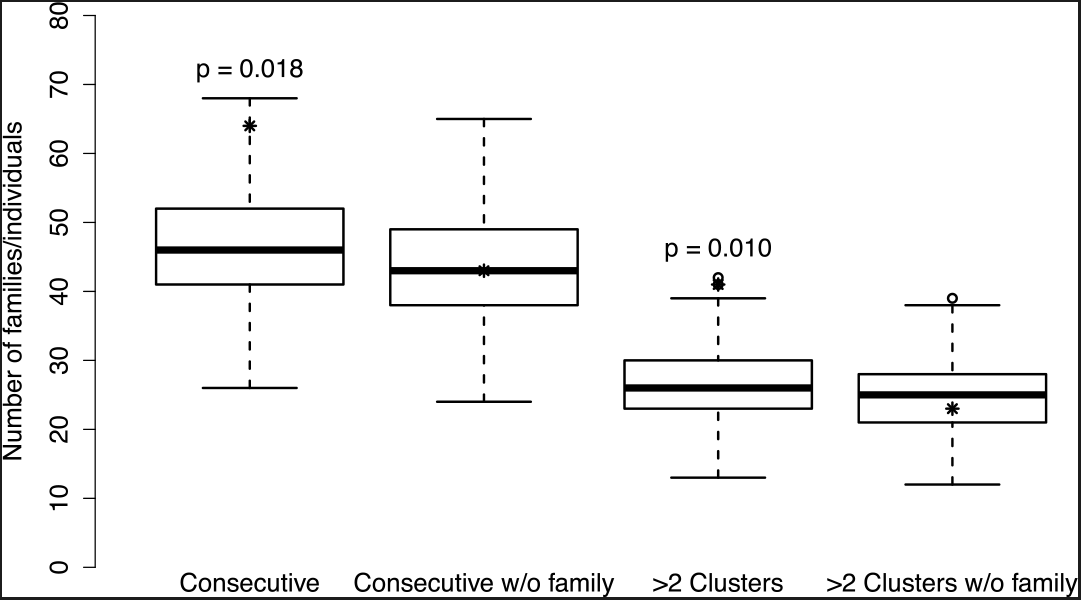
I conduct a very similar set of analysis, now focusing on petitioners whose last name also shows up in the Quaker burial registers. I measure the number of Quakers who signed their names consecutively, as well as the number of Quakers who signed consecutively with someone in a different Quaker family, and compare these statistics arising from the random ordering of petitioners. The clustering of Quakers is pronounced on the petition (compare the first box plot and the empirically observed statistic, the star, in Figure 7), but it arises from individuals signing their name in the same family consecutively, rather than different Quaker families signing the petition together.
Comparing Quakers signing the petition.

In fact, the number of empirically observed Quaker families signing consecutively does not differ from what would be expected by chance (see the second bar in Figure 4, and compare it to the empirically observed statistic). Note also that only about a third of families whose members signed consecutively on the petition were Quakers (compare the first bar on Figure 6, and the difference between the stars on the first and second bars of Figure 7)—which is also a clear indication that Quakers were more numerous among petitioners than their population share. Finally, I explore if Quakers have larger clusters on the petition, that is, not only two, but more than two Quakers signing their name consecutively. This is indeed the case, as evidenced by the third bar in Figure 7 but again, this is not driven by multiple different Quaker families’ clustering on the petition, see the last bar in Figure 7.
The takeaway of these analyses is that “belonging to the same family” played a role in drawing individuals to petition as suggested before, and that some families were particularly active in contributing signatures compared to others. The analysis also shows that only about a third of these families could have been Quakers. In other words, the bulk of clustering of petitioning within families cannot be attributed to the most active religious sect in the movement. Furthermore, the Quaker congregation did not petition together.
Limitations
Petitioning for abolition was only one tactic used in the movement (Tilly Reference Tilly1993). Given this, the analysis ignores other forms of abolitionist action, like the sugar boycott, and cannot incorporate women in the analysis (Clapp and Jeffrey Reference Clapp and Jeffrey2011; Midgley Reference Midgley1996). Therefore, the analytical lenses are restricted from finding spillovers of petitioning to other ways of participating in abolition and vice versa.
Moreover, some analyses only pertain to those who were matched to entries in the Directory. In other words, those who were at the lower end of Manchester’s socioeconomic ladder are missing from these analyses. The correlates of their participation may be different from those uncovered here, but the data and analysis presented here cannot uncover those differences. Furthermore, some of the mechanisms proposed for abolitionist petitioning that involves patronage and social influence of the more powerful over the less privileged, while unlikely, cannot be effectively evaluated.
Finally, Manchester is a single community, albeit a very important one in the abolition movement. Its role in industrialization, and special geographic location with access to the port of Liverpool makes it a unique case, but also a perfect natural laboratory. Quakerism and Methodism, and the rise of the associational life in provincial England, were largely similar elsewhere. The character of petitioning driven by local institutions cannot be fully assessed without a comparative case, but there is no theoretical reason that would suggest systematic differences. Such a comparative study is unlikely to surface, given the loss of petitions.
In various other contexts, peer influence is pitted against “environmental effects” or “common exposure” (An Reference An, Scott and Carrington2011). The analyses presented here cannot differentiate between direct peer influence and common exposure. At the same time, they are set to test if the spatial clustering could be accounted for by alternative explanations to focal points and demonstrate layers of evidence to the contrary. Given this snapshot in time, it is not possible to precisely tell apart to what extent the geographic clustering of petitioners is the result of the institutions with a developing orientation to reform, or, simply the flow of people who were more likely to bring certain kinds of ideas with them, giving their character at this time point. Deciding this, rather important historical questions fall outside of the scope of this single article.
Discussion
The abolitionist campaign was preceded and accompanied by various important shifts in intellectual though and political arrangements. The War of Independence ended in 1785, a few years before the first large-scale popular campaign leaving a scar on British national identity (Brown Reference Brown2006; Colley Reference Colley1992). The French Revolution was contemporary with the movement, and it is evident that ideas about freedom circulated among the movement leaders that were relevant for both causes. The Second Great Awakening gained momentum in the 1790s, and undoubtedly crossed geographic boundaries. Abolitionism was “in the air” in the late 1780s, but the scale and patterning of the popular action cannot be understood without a closer look at social structure, and mobilization dynamics within and across local communities.
Based on the evidence presented in this article, abolition involved Quakers in great numbers—a historic fact articulated by many. But the impact of belonging to an active congregation manifested itself through kinship ties, and the clustering of petitioners in families could only be accounted for through congregational belonging in part. This gives credit to explanations that implicated religious zeal in abolitionist action (Jennings Reference Jennings1997), but clearly sets its limits, showing that Quakers alone could not have sustained the levels of mobilization in Manchester at its observed scale, nor is there evidence of significant “block recruitment” (Oberschall Reference Oberschall1973).
The analysis also reveals a new set of structural factors driving petitioning, and necessary for laying the microfoundations of abolitionist action. Petitioners were more likely to sign with their neighbors. This is an observation not new to scholars of mobilization. However, the analyses uncover that neighborhood matters as a result of a set of institutions: gathering places, inns, and taverns, which emerge as points of information exchange, debate, and discussion around which petitioners clustered. Furthermore, petitioning can’t be comprehended from the perspective of interests—at least not proxied by occupation (Davis Reference Davis1975; Haskell Reference Haskell and Bender1992). These findings invite us to revise the understanding arising from the historical literature, that abolitionist ideology arose out of individual moral convictions of the masses (Stamatov Reference Stamatov2010, Reference Stamatov2013, Reference Stamatov2014). The cultural frames and abolitionist discourse available to individual actors took effect in interactions taking place in specific locations. These analyses uncover a missing bead on the necklace of a causal chain and expose a trace of institutions besides the family and church structuring informal idea exchange among ordinary men.
In the context of mass movements that swept the British nation in the 1830s local-level organizing often relied on “preexisting organizations [that] need not be formally constituted or created for the purpose of pursuing [a specific] collective good at hand. Rather, the informal bonds of community relationships may provide powerful selective incentives and a form of preexisting organization ready to mobilize in a variety of actions” (Calhoun Reference Calhoun2012: 98). This argument that highlights selective incentives relies implicitly on a specific set of theories of network formation and structural balance. Theories that potentially account for petitioning in families, congregations, and other organizations. It misses, however, the role of other institutions that were inclusive of various categories of people.
Not any institution, but specific ones that were the carriers of both information and ideology turned out to channel abolitionist action. Not any inn or tavern, but those historically involved with the movement, as well as housing traveling merchants from communities that already mobilized for abolition in previous years were found to matter. The findings contextualize the importance of the organizational infrastructure on which the movement must have relied, and draw attention to the local institutions, both religious and secular, that provided venues for social life.
Supplementary material
To view supplementary material for this article, please visit https://doi.org/10.1017/ssh.2019.25.