


1. Introduction
Numerous emergent diapirs are widespread within many ancient sedimentary basins throughout the Middle East. The largest and the best known occur in Iran. About 200 salt diapirs (Kent, Reference Kent1970) are known in the area of the Persian Gulf; of these about 150 appear in the Zagros belt (Kent, Reference Kent1958; Gansser, Reference Gansser1960) and 120 surface close to the Iranian coast of the Persian Gulf (Trusheim, Reference Trusheim1974). Blanford (Reference Blanford1872) introduced the name Hormuz Salt Formation for the entire complex of rock salt and associated sedimentary and igneous rocks occurring on Hormuz Island. Salt structures throughout the world have been studied intensively since the beginning of the twentieth century, if only because of their common association with hydrocarbon traps (e.g. Bahroudi, Koyi & Talbot, Reference Bahroudi, Koyi and Talbot2003; Hudec & Jackson, Reference Hudec and Jackson2007; Wagner & Jackson, Reference Wagner and Jackson2011). A distinguishing feature of the diapirs in the Hormuz series is the presence of felsic and mafic igneous inclusions. These inclusions, according to several workers, include granite, basic and ultrabasic rocks (Pilgrim, Reference Pilgrim1908; Harrison, Reference Harrison1930; Gansser, Reference Gansser1960; Haynes & McQuillan, Reference Haynes and Maquilan1974; Samani, Reference Samani1988; Darwishzadeh, Reference Darwishzadeh1990; Ahmadzadeh Heravi, Houshmandzadeh & Nabavi, Reference Ahmadzadeh Heravi, Houshmandzadeh and Nabavi1990; S. Taghipour, unpub. M.Sc. thesis, Univ. Isfahan, 2007). The magnetic fabric of the diapirs exposed on Hormuz Island (Smid, Schulmann & Hrouda, Reference Smid, Schulmann and Hrouda2001) indicates symmetrical outward flow of salt from near their centres to their marginal folded zones at exposed levels. Bosak et al. (Reference Bosak, Jaros, Spudil, Sulovsky and Vaclavek1998) interpreted the Hormuz series to represent the products of multicyclic deposition in evaporitic basins of beds of salts and other evaporites within a carbonate–clastic–volcano-sedimentary sequence. An increasing volume of potash is currently being discovered in a cluster of diapirs of Hormuz salt near Bandar Abbas, Iran (Talbot, Aftabi & Chemica, Reference Talbot, Aftabi and Chemica2009).
The present paper focuses on three inactive diapirs in the Zagros Mountains. These are: Kaj-Rostam Abad, Dashtak and Doab. The former two are located in the northwest of the town of Ardal in the High Zagros, and the latter lies in the east of the town of Lordegan, in the folded Zagros Mountain range (Fig. 1). The areas are centred at 32° 10′ E and 49° 50′ 20″ N on the district geological map (Alavi, Reference Alavi1996; Jamshidi, Ghomashi & Haddadan, Reference Jamshidi, Ghomashi and Haddadan1996). The principle objective of this study is to describe the petrographic and geochemical features of the igneous inclusions within the remnant evaporites exposed in the Kaj-Rostam Abad, Dashtak and Doab diapirs. The exposure of these diapirs provides an exceptional opportunity for analysing their components and understanding their structural relationships and history of development.
Geological map of the Kaj-Rostam Abad, Dashtak and Doab diapirs (after Alavi, Reference Alavi1996 and Jamshidi, Ghomashi & Haddadan, Reference Jamshidi, Ghomashi and Haddadan1996, with some modifications).

2. Geological setting and field relations
Piligrim (1908) named the evaporitic sequence exposed as diapirs in the south of Iran and the coast of the Persian Gulf. These salt deposits constitute part of the Precambrian–Cambrian sequence identified in basins of East Siberia, Iran and Pakistan (Stöcklin, Reference Stöcklin and Mattox1968a,Reference Stöcklinb). Trilobites in dolomitic debris of this sequence indicate accumulation in pre-Middle Cambrian or Early Cambrian time (R. A. Player, unpub. report, 1969). The whole Hormuz sequence dates from the Infracambrian (Neoproterozoic) period to Middle Cambrian Epoch (Kent, Reference Kent1970). From a structural standpoint, the diapirs of the Zagros Mountains are distributed along the Main Zagros Thrust and other parallel thrusts, as well as regional basement strike-slip faults that reactivated in the Precambrian basement (Falcon, Reference Falcon1967; Stöcklin, Reference Stöcklin and Mattox1968a,Reference Stöcklinb; Trusheim, Reference Trusheim1974; Talbot & Alavi, Reference Talbot, Alavi, Alsop, Blundell and Davison1996).
Lithologically, the Hormuz series originally formed as a multicyclic evaporitic sequence (Kent, Reference Kent1970; Trusheim, Reference Trusheim1974) including cherty dolomites, variegated shale, black laminated limestone, red sandstone and green micaceous siltstones, which are the most common non-evaporitic sedimentary rocks. Igneous inclusions typically comprise small volumes (< 10%) among the halite exposed in young extrusions of the Hormuz series (e.g. near the Gulf coast). However, they form increasingly higher volumes as first the halite and then the anhydrite is dissolved from diapirs that have been exposed for longer. Perhaps > 70% of exposures of the diapirs of the Hormuz series in the High Zagros now consist of igneous inclusions. The igneous inclusions found on the surface of the three diapirs studied in the High Zagros have been strongly concentrated by the dissolution of the huge volumes of salt and anhydrite that used to make up the diapirs. Igneous rocks within the Hormuz series are dolerite, altered diabase and rhyolites, ignimbrites and tuffs. Alternation of some volcanic rocks with various sediments suggests that some volcanic extrusions took place simultaneously with sedimentation of the evaporites (Davoudzadeh, Reference Davoudzadeh1990). The Hormuz series in the Zagros is interpreted as a stratigraphic equivalent of the Desu series in the Kerman region (Huckriede, Kursten & Venzluff, Reference Huckriede, Kursten and Venzluff1962), the Kalshaneh Formation of east Iran (A. Rutner, M. H. Nabavi & J. Hajian, unpub. report, 1963) and the Soltanieh Formation (Upper Precambrian–Lower Cambrian) of central and north Iran (Stöcklin, Reference Stöcklin1961).
The height of the diapirs studied from river level to summit is about 3–60 m. The surface of each diapir is rugged on scales from 2 m to 30 m owing to dissolution of former salt at the surface by the local rainfall (~ 400–800 mm yr−1), tens of saline springs and seeps on and bordering each diapir (Fig. 2a). The internal layers are intensively contorted by folds with steep axes (on scales ranging from millimetres (Fig. 2b) to hundreds of metres) and fractures associated with normal faults (Fig. 2c). The igneous inclusions of the Hormuz series range from basalt through to trachyte (1.5–3 m across), with small bodies of micro-gabbro to micro-diorite (1–2.5 m) and rare outcrops of micro-syenite and rhyolite. The occurrence of pahoehoe basaltic lavas with ropy flow tops on Doab diapir and calc-silicate xenoliths within volcanic tuffs on Dashtak diapir (Fig. 2d) can be taken as evidence of subaerial lava flows and the volcano-sedimentary environment during deposition, respectively.
(a) The existence of salt-bearing springs around the Kaj-Rostam Abad diapir is signalled by surficial deposits of white efflorescence. (b) Enterolithic structures, which may be formed by either hydration of anhydrite to gypsum or tectonic stress. (c) The 60 m relief of the Doab diapir bounded by a normal fault trending W–E, seen from the east. (d) Calc-silicate xenoliths within the Dashtak rhyolite tuff.

3. Sampling and analytical methods
A total of 290 rock samples were collected from the aforementioned diapirs. From these, 170 thin-sections were prepared. Petrographic studies were carried out under a polarizing Olympus microscope (model BH-2) at the University of Isfahan, Iran. Twenty-five representative samples were then selected for whole-rock analysis. Major and trace elements were determined by X-ray fluorescence spectrometry (XRF) by Amdel Ltd in Australia. Clinopyroxene, amphibole, feldspar and chlorite analyses were determined by an electron microprobe (Cameca SX-50) equipped with five synchronous wavelength dispersive spectrometers and a PGT PRISM2000 energy dispersive spectrometer at Oklahoma University, USA, by means of a dispersive X-ray detector. Analyses were performed by wavelength dispersive spectrometry. The analytical conditions were 20 kV acceleration, 20 nA sample current and 3 μm spot size. Counting times were 30 seconds on peaks for all elements, yielding calculated minimum levels of detection (at 3-sigma above mean background) of < 0.02 wt% of the oxide for all components. Doubly polished sections, approximately 100 μm thick, were prepared for fluid inclusion petrography and micro-thermometry. Micro-thermometric measurements were carried out at the University of Isfahan, Iran, using an English Linkam temperature control unit and a TG600 heating–freezing stage mounted on a Nikon Optiphot microscope equipped with an FX-35DX camera. Oxygen isotopic analysis of hydrothermal quartz veins was carried out at Southern Methodist University, USA. Quartz samples were dried in a vacuum for 14 hours at 400 °C. The 10 mg quartz separates were reacted with Ni and 170 torr of BrF5 to liberate O2. This was converted to CO2 by reaction with hot graphite and analysed isotopically with a mass spectrometer (model Finnegan MAT 251) (Clayton & Mayeda, Reference Clayton and Mayeda1963; Borthewick & Harmon, Reference Borthewick and Harmon1982). Oxygen isotopic compositions are reported as per mil (‰) deviations from the international standard SMOW.
4. Petrography
The petrographic characteristics of the samples are treated under two main headings: evaporitic and magmatic rocks.
4.a. Evaporitic rocks
Although the Hormuz series is known to have originally been rich in salt (halite, NaCl), no halite survives at the surface in the bodies studied. Instead, the major constituents of the evaporitic rocks are now gypsum and anhydrite, with small amounts of dolomite and calcite. Gypsum, as the predominant evaporitic mineral, occurs as greyish to whitish crystals (0.5–2 cm). Some grains, because of inclusions of clay and carbonaceous materials, are dark or turbid.
Gypsum and anhydrite layers are commonly contorted by enterolithic folds (Fig. 2b). Such structures are common in many ancient evaporites. They may develop very early, during evaporation in sabkha environments (Darbas & Nazik, Reference Darbas and Nazik2010) where the natural moisture content is high (Kinsman, Reference Kinsman1966), or very late, as a result of near surface hydration of old anhydrite rocks.
Anhydrite is present as lenticular bodies and porphyroblasts sporadically distributed within a groundmass composed of cloudy amoeboid (xenotopic) gypsum and fine-grained (0.05–0.15 mm) calcite and dolomite. These textures may suggest that the gypsum hydrated from the Hormuz anhydrite during one or more cycles of hydration ± dehydration. Euhedral dolomite crystals are common in the evaporitic rocks of the Hormuz series. Some grains are grey or turbid and stained with traces of iron oxides. Also, inclusions of rhombohedral dolomite are poikilitically enclosed by coarse-grained calcite (0.2–0.4 mm). Anhedral calcite with very fine-grained aggregates scattered within gypsum grains are a very common constituent of the Hormuz series. This may point to the conversion of calcite to gypsum with or without the dissolution of large volumes of halite (Fig. 3a).
(a) Porphyroblasts of lamellar gypsum are common in samples of the evaporitic rocks. (b) Chlorite pseudomorph after olivine. (c) A cluster of clinopyroxene grains define a glomeroporphyritic texture. (d) Apparent oscillatory zoning in a Ti-augite crystal. (e) Poikiloblastic needle of apatite in a plagioclase phenocryst; epidote is a marginal alteration product of the plagioclases. (f) Growth of albite within plagioclase is attributed to Na-metasomatism.

4.b. Igneous rocks
Petrographic and geochemical characteristics confirm field studies that the inclusion of magmatic rocks in the studied diapirs are mainly mafic (basalt and micro-gabbro) (1–3 m) and intermediate (andesite and basaltic-andesite) with some small felsic (20–25–35 cm) bodies of micro-syenite. Amygdaloidal texture is common in the basalts. Vesicles are filled by calcite, quartz, actinolite, chlorite and epidote. These minerals presumably crystallized at the expense of earlier amphiboles or pyroxenes. The primary igneous texture is commonly altered, although microgranular, intergranular, porphyritic and fluidic textures still survive locally.
Mafic rocks consist of clinopyroxene, plagioclase, amphibole and epidote with minor quantities of olivine, opaque minerals and apatite accompanied by metasomatic minerals (e.g. actinolite, albite, calcite, quartz, chlorite and garnet). The mineral assemblage developed in three stages: (1) magmatic, (2) late magmatic and (3) later vein mineralization.
Phenocrysts of olivine are bipyramidal, euhedral to subhedral. Reaction rims, a notable feature of alkaline basalts, are not present in these rocks (Fig. 3b). Glomeroporphyritic texture defined by phenocrysts of pyroxene can be recognized (Fig. 3c). Petrographic observations of euhedral–subhedral pyroxene indicate titanium-augite composition, normally zoned with sector zoning (Fig. 3d.). There are two generations of amphibole; one forms very long (2 mm), narrow needle-shaped crystals (0.2 mm) scattered through a variety of minerals such as clinopyroxene, plagioclase and apatite, while the other occurs as a metasomatic-type association with albite, epidote, quartz and calcite. Amphibole and more common biotite occur as primary and secondary minerals. Plagioclase forms the groundmass with microlites and phenocrysts enclosing apatite needles (Fig. 3e). Depending on the availability of post-magmatic fluids, these minerals were saussuritized to produce plagioclases enclosing blebs of zoisite, epidote, tiny flakes of sericite, calcite, quartz and newly formed albite (Fig. 3f). In a few samples, chlorite replaced olivine (Fig. 3b) and occasionally pyroxene and amphibole. A metasomatic chlorite veinlet displays low relief and greyish interference colours. Sub- to anhedral phenocrysts of sanidine are the most common K-feldspars in the trachyte rocks. Some sanidine grains are white or creamy due to the prevalent saussuritic alteration. Sub- to anhedral plagioclase is widespread throughout the samples, especially in the trachyte rocks. Opaque oxides and relics of pyroxene as inclusions are observed in some grains (e.g. actinolite).
5. Mineral chemistry
5.a. Clinopyroxene
Electron microprobe analyses of clinopyroxenes from 53 samples (Table 1) of the Hormuz series reveal that their composition ranges between augite to diopside (Fig. 4a) and some are enriched in Ti (titanaugite) (Deer, Howie & Zussman, Reference Deer, Howie and Zussman1991). The average TiO2 content in the clinopyroxenes varies from 0.51 to 3.32 wt%, corresponding to an average Al2O3 content of 2.93 to 9.03 wt% (Table 1). Le Bas (Reference Le Bas1962) suggested that Ti and Al contents in alkaline pyroxenes are higher than in tholeiitic pyroxenes. Al2O3 decreases as SiO2 increases in the studied pyroxenes (Fig. 4b, c). This relationship probably occurred as the Al2O3 content developed tetrahedral coordination during differentiation of tholeiitic magmas (Le Bas, Reference Le Bas1962).
Electron microprobe analysis of clinopyroxene

n = number of samples. WO – wollastonite; EN – enstatite; FS – ferrosilite
(a) Wo–En–Fs diagram for pyroxenes (Morimoto, Reference Morimoto1989). (b) SiO2–Al2O3 (Le Bas, Reference Le Bas1962) and (c) F1–F2 diagrams (Nisbet & Pearce, Reference Nisbet and Pearce1977) for clinopyroxenes from studied samples of basalt to alkali-basalt rocks of the Hormuz series. VAB – volcanic arc basalts; OFB – ocean-floor basalts; WPT – within-plate tholeiitic basalts; WPA – within-plate alkali basalts.

5.b. Amphibole
Several amphiboles from basaltic rocks from the target diapirs were analysed by electron microprobe. Two types of amphiboles are recognized. The first type is kaersutite with mean values of 4.3% TiO2, 3.77% Na2O and 9.9% Al2O3. The second type is actinolite depleted in TiO2 (0.001–0.1 wt%), Na2O (0.31–0.56 wt%) and Al2O3 (0.93–1.75 wt%) (Table 2; Fig. 5a, b). The differences in Al2O3 and SiO2 contents of amphiboles are attributed to the conditions under which these minerals developed. According to Harry (Reference Harry1950), higher temperatures of crystallization favour substitution of Al instead of Si, and therefore the high-temperature amphiboles are richer in aluminium than those crystallized at a lower temperature.
Electron microprobe analysis of amphibole

(a) Mg(Mg+Fe2+) v. TSi diagram (Leake et al. Reference Leake, Wolley, Arps, Birch, Gilbert, Grice, Hawthorne, Kato, Kisch, Krivovichev, Linthout, Laird, Mandarino, Maresch, Nickel, Rock, Schumacher, Smith, Stephenson, Ungaretti, Whittaker and Youzhi1997) for Ca amphiboles and (b) Ti amphiboles from the studied diapirs, Zagros belt, Iran.

5.c. Feldspar
Mean values of 34 microprobe analyses of plagioclases from the basaltic inclusions are listed in Table 3 and plotted on an Ab–An–Or triangular diagram (Fig. 6). They vary in composition from very low (Ab81.45–An15.78–Or2.77) to pure anorthite (Table 3). The higher albite content (> 98%) of the plagioclases may indicate that these minerals have been subjected to Na-metasomatism, probably associated with the dissolution of large volumes of the halite that originally surrounded these inclusions.
Feldspar classification on an Ab–An–Or triangular diagram for the basaltic rocks from the Kaj-Rostam Abad and Doab diapirs, Zagros belt, Iran.

Electron microprobe analysis of feldspar

n = number of analyses
5.d. Chlorite
Chlorite is widespread in a great variety of geological settings, including sedimentary, low-grade metamorphic and geothermal systems (Deer, Howie & Zussman, Reference Deer, Howie and Zussman1991; Caritas, Hutcheon & Walshe, Reference Caritas, Hutcheon and Walshe1993). Representative chlorite analyses are given in Table 4. All samples are significantly enriched in FeO* (17–19.9 wt%) and MgO (19.7–22.7 wt%), but are very low in K2O (< 0.03%). This implies that the parent magma was tholeiitic in nature. Although the ratios of some oxides vary, the sum of divalent cations remains constant. The number of tetrahedral aluminium atoms is 1.41–2.26 (Table 4). The investigated chlorites are characterized by 5.74–6.55 Si atoms (calculated on the basis of 28 oxygen atoms) and an Fe/(Fe+Mg) ratio of 0.30 to 0.34 (Table 4). On an Fe/(Fe+Mg) v. Si diagram (Hey, Reference Hey1954), almost all the chlorites are classified as pycnochlorite (Fig. 7).
Electron microprobe analysis of chlorite

n = number of analyses
Classification of chlorite from the Kaj-Rostam Abad, Dashtak and Doab diapirs on an Fe/(Fe+Mg) v. Si diagram.

6. Geothermometery
6.a. Chlorite
A number of methods have been suggested to determine the formation conditions of chlorite and to investigate its genesis in a given area. On the base of their experimental studies, Cathelineu & Nieva (1985) proposed a chlorite solid-solution geothermometer. They found that the value of tetrahedral AlIV is highly dependent on the temperature of chlorite crystallization. Cathelineu & Nieva (1985) derived the following relationship between temperature and AlIV:
 \begin{equation}
T{\rm (^\circ C) = 213}{\rm .3Al}^{{\rm IV}} {\rm + 17}{\rm .5}
\end{equation}
Cathelineu (Reference Cathelineu1988) studied the fluid inclusions in quartz crystals in association with chlorite and proposed a new correlation between temperature and AlIV:
 \begin{equation}
T{\rm (^\circ C) = - 61}{\rm .92 + 321}{\rm .98Al}^{{\rm IV}}
\end{equation}
 begin{equation}
T{\rm (^\circ C) = 319Al}_{\rm c} ^{{\rm IV}} {\rm - 69}
\end{equation}
Correlating the temperature deduced from the chlorite thermometer (Table 5) with other geological considerations suggests that most of the pycnochlorite precipitated at temperatures between 330 and 500 °C, those of a geothermal system (Fig. 8). According to Table 5, the studied diapir chlorites have been formed in three stages. Not only are these produced by alteration of olivine (stage I) and amphibole (stage II) but veinlet and metasomatic types are also found (stage III). On the basis of the chlorite thermometers three temperature ranges have been recognized (T1, T2, T3). Comparison suggests that T1 is a better match with other data (Fig. 8; Table 5).
Chlorite thermometry

Chlorite geothermometry calculated on the basis of Cathelineu & Nieva (1985) (T1), Cathelineu (Reference Cathelineu1988) (T2) and Jowett (Reference Jowett1991) (T3) from chlorites formed in three stages of the Kaj-Rostam Abad, Dashtak and Doab diapirs.

6.b. Clinopyroxene
Pyroxene thermometry has proved a powerful tool for determining the temperature conditions under which clinopyroxene crystallized. We calculated the crystallization temperature of clinopyroxene phenocrysts using Nimis & Taylor's (Reference Nimis and Taylor2000) equation at estimated pressures of 1, 5 and 10 kbar (Table 6; Fig. 9a, c):
 \begin{eqnarray*}
T{\rm (K)} &=& {((23166 + 3928) }^{\rm *} {\rm }P{\rm (kbar))/(13}{\rm .25} \nonumber\\
&& + \, 15{\rm .35 }^{\rm *} {\rm Ti }
{\rm + 4}{\rm .50 }^{\rm *} {\rm Fe - 1}{\rm .55 }^{\rm *} {\rm (Al + Cr} \nonumber\\
&& {\rm -\, Na - K) + (lna}_{{\rm en}} ^{{\rm Cpx}} {\rm )}^{\rm 2} {\rm )}{\rm .}
\end{eqnarray*}
Clinopyroxene thermometry

(a) Clinopyroxene crystallization temperature calculated on the basis of Nimis & Taylor's equation (Reference Nimis and Taylor2000). (b) AlVI/AlIV plot (Avoki & Shiba, Reference Avoki and Shiba1973) to determine the pressure of clinopyroxene formation and (c) schematic representation of pyroxene relations in the Di–En–Hd–Fs quadrilateral, showing the pyroxene assemblages used for geothermometry (Lindsley & Andersen, Reference Lindsley and Andersen1983).

Several workers (i.e. Thompson, Reference Thompson1974; Mahood & Barker, Reference Mahood and Barker1986) demonstrated that the number of hexahedral Al in igneous clinopyroxenes is strongly pressure sensitive and may serve as a geobarometer (Berry, Nickel & Kogarko, Reference Berry, Nickel and Kogarko1986; Mukhopadhyay, Reference Mukhopadhyay1991). Avoki & Shiba (1973) applied the AlVI/AlIV ratio to discriminate high- from low-pressure clinopyroxenes. Plotted on an AlVI/AlIV diagram (Avoki & Shiba, Reference Avoki and Shiba1973) (Fig. 9b), most of our measurements cluster in the medium-to-low-pressure clinopyroxene fields, suggesting that most of the clinopyroxenes crystallized during magma emplacement. Clinopyroxene with variable chemical composition is widespread in different igneous rocks. However, clinopyroxenes are generally resistant to alteration and serves as a petrogenetic indicator of the nature of the primary magma. Many altered basalts carry unaltered clinopyroxene crystals set in an altered matrix with similar composition. A temperature range of 700–1050 °C was obtained for clinopyroxene crystallization from 53 analyses plotted on a Wo–En–Fs diagram (Lindsley & Andersen, Reference Lindsley and Andersen1983) (Fig. 9c).
7. Whole-rock geochemistry
7.a. Major and trace elements
Representative whole-rock analyses are given in Table 7. The norms of the volcanic rocks range from basalt to trachyte (Fig. 10a). The SiO2 contents vary from 46.86 to 66 wt% (Table 7) and correspond to mafic to intermediate composition (Fig. 10b, c). Plotted on an AFM variation diagram, the samples show typical calc-alkaline differentiation trends with total iron content decreasing progressively as the SiO2 content increases. Several trachy-andesites and a few basalts lie in the tholeiitic field (Fig. 10b); however, plotted, on the Zr–Ti/100–Y*3 discrimination diagram proposed by Pearce & Cann (Reference Pearce and Cann1973), the values of these ratios are much higher in the WPB (within-plate basalt) field (Fig. 10d). A Ce/Pb v. Ba/Nb diagram classifies the volcanic samples as transitional basalts (Fig. 10c). The chemical compositions of pyroxenes (Beccaluva et al. Reference Beccaluva, Macciotta, Piccardo and Zeda1989) plot in the MORB (mid-ocean ridge basalt) field on a geotectonic diagram (Fig. 10e). The major oxides in the altered and unaltered basaltic rocks show that the former rocks are characterized by higher levels of SiO2, Fe2O3, CaO, Na2O and K2O, and lower contents of TiO2, Al2O3, FeO, MnO, MgO and P2O5 (Fig. 10f). The use of Th and Co has proved extremely successful when applied to basaltic lavas and dacitic tuffs that have been heavily altered by tropical weathering, hydrothermal and/or metamorphic processes (Hastie et al. Reference Hastie, Kerr, Mitchell and Millar2008; Hastie & Kerr, Reference Hastie and Kerr2010). In this case, it becomes apparent (Fig. 10g) that the igneous inclusions of the Kaj-Rostam Abad, Dashtak and Doab diapirs narrow down to the field of calc-alkaline basalt and high-potassic rocks. However, the Hastie diagram also reveals the influence of K-metasomatism on our samples. In summary, the chemistries of the volcanic samples suggest the enclosing Hormuz evaporite series was deposited in association with calc-alkaline mafic basalts to intermediate trachytes extruded onto the floor of the Tethys palaeo-ocean.
XRF analysis of the igneous inclusions

(a) Geochemical classification of the volcanic inclusions from the studied diapirs on a Na2O+K2O v. SiO2 diagram (Middlemost, Reference Middlemost1995). (b) AFM diagram (Irvine & Baragar, Reference Irvine and Baragar1971) for volcanic inclusions; all samples show typical calc-alkaline to tholeiitic composition. (c) Discrimination of the volcanic inclusions within the Kaj-Rostam Abad, Dashtak and Doab diapirs on a Ce/Pb v. Ba/Nb diagram (Le Roex, Bell & Davis, Reference Le Roex, Bell and Davis2003) and Becker & Le Roex (Reference Becker and Le Roex2006) diagrams for igneous inclusions sampled on the Kaj-Rostam Abad, Dashtak and Doab diapers, Zagros belt. The studied samples plot as transitional between the alkaline and calc-alkaline series. (d) Kaj-Rostam Abad, Dashtak and Doab diapir igneous rock samples plotted on the Ti–Zr–Y ternary diagram (after Pearce & Caan, 1973). (e) TiO2–Na2O–SiO2/100 triangular diagram (Becculava et al. Reference Beccaluva, Macciotta, Piccardo and Zeda1989) for clinopyroxene from the basalt and discrimination of the geotectonic environment. All samples plot in the MORB field (data from Table 1). (f) Depletion and enrichment diagram for major oxides from basaltic inclusions of Kaj-Rostam Abad, Dashtak and Doab diapirs, Zagros belt. (g) Th–Co plot of XRF analyses of igneous inclusions within the studied diapirs (Hastie et al. Reference Hastie, Kerr, Pearce and Mitchell2007). B – basalt; BA/A – basaltic andesite and andesite; BON – boninite; CA – calc-alkaline; D/R – dacite and rhyolite; H-K – high-K calc-alkaline; IAT – island arc tholeiite; MORB – mid-ocean ridge basalt; OIB – ocean island basalts; SHO – shoshonite; WPB – within-plate basalt.

7.b. Fluid inclusions
Fluid inclusions are small, usually microscopic, volumes of fluid trapped within crystals during their growth (Roedder & Bodnar, Reference Roedder and Bodnar1980). Needles of actinolite are found dispersed within the smoky quartz from the Dashtak diapir (Fig. 11). The primary fluid inclusions found in hydrothermal vein quartz from our samples are three-phase (Solid+Liquid+Vapour) inclusions with daughter NaCl crystals together with two-phase (L+V or V+L) and monophase (L or V) inclusions. The dimensions of inclusions are commonly 5–100 μm but some reach lengths of 150 μm. Three-phase inclusions are abundant and usually liquid rich. Two common thermometric procedures, freezing and heating, were employed to determine the approximate salinity (wt% NaCl equivalent) and homogenization temperatures. The results indicate the temperatures at which the inclusions were enclosed within the hydrothermal vein quartz. Fluid inclusions normally become a homogeneous fluid on heating under the microscope (Roedder & Bodnar, Reference Roedder and Bodnar1980). Homogenization temperatures (T h) for our samples vary from 320 to 350 °C (Fig. 12a). The salinity percentage of the halite-bearing phase is calculated according to the Shepherd equation (Shepherd, Rankin & Alderton, Reference Shepherd, Rankin and Alderton1985). The salinity percentages calculated for our samples range between 39.8 and 42.7 wt% NaCl (Fig. 12b). Such temperatures imply that the vein quartz trapped hot brines as it crystallized in the high temperatures of a local hydrothermal system.
Representative photomicrographs of the different types of fluid inclusions within hydrothermal vein quartz, Kaj-Rostam Abad, Dashtak and Doab diapers, Zagros belt, Iran. Act – actinolite, V – vapour, L – liquid, S – solid.

(a) Homogenization temperatures for inclusions of the Kaj-Rostam Abad, Dashtak and Doab diapir hydrothermal quartz and (b) salinity calculations. (c) Studied samples plot in the magmatic-meteoric mixing field on the salinity–temperature diagram (Beane, Reference Beane1983).

7.c. Oxygen isotopes
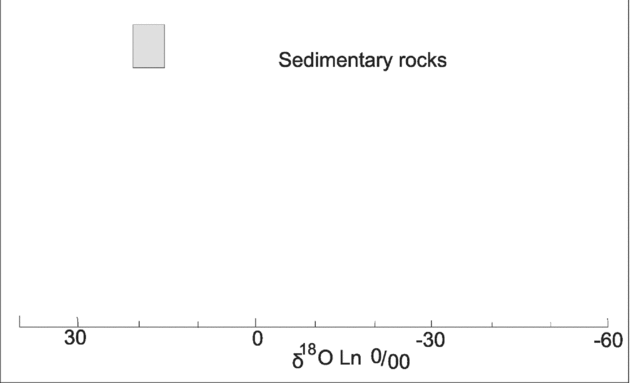
The values of δ18Ov (SMOW) for ten hydrothermal vein quartz samples found in what are obviously metasomatic rocks are summarized in Table 8. Taken as a group, δ18O ranges from 14.89 to 23.09 ‰ SMOW. The data plot in the sedimentary field (Fig. 13). The 18O values of the hydrothermal vein quartz might be explained by meteoric waters mixing with hot saline brines from the diapirs before they entered the sedimentary–evaporite system; the brines were 320–350 °C because of igneous activity.
Values (in box) of δ18O SMOW for hydrothermal vein quartz (after Taylor, Reference Taylor1974) within metasomatic inclusions from the Kaj-Rostam Abad, Dashtak and Doab diapirs, Zagros belt, Iran.
O isotope analysis of the hydrothermal vein quartz

8. Discussion
The three diapirs we studied in the High Zagros occur now in what became part of the Gondwana supercontinent. The evaporites in them now consist mainly of gypsum and anhydrite. This is because they lost to dissolution the huge volumes of halite that characterize the Hormuz series exposed in diapirs that have surfaced in non-metamorphosed parts of the Zagros Mountains.
The Hormuz evaporites probably accumulated in a half-graben that developed in a peneplane of low relief eroded in the Precambrian Pan-African basement like that exposed in Saudi Arabia (Talbot & Alavi, Reference Talbot, Alavi, Alsop, Blundell and Davison1996). Farhoudi (Reference Farhoudi1978) and Berberian & King (Reference Berberian and King1981) were of the opinion that the volcanoes that contributed to the evaporite basins belonged to calc-alkaline island arcs. However, our data suggests instead that these rocks originated as within-plate alkali-enriched volcanic rocks that were later metasomatized by saline solutions circulating in the Hormuz series.
M. Sabzehei (unpub. report, 1989) attributed the veinlets of amphibole and pyroxenes in igneous inclusions from the Hormuz series as comprising actinolite and Ti-augite and diopside owing to their permeation by Na-rich hydrothermal fluids. Darwishzadeh (Reference Darwishzadeh1990) implied that alkali magmatism is related to mantle doming and migration of fluids that formed the kaersutite, Ti-augite, diopside, apatite, alkali-feldspar and alkali volcanism. Momenzadeh & Heidari (Reference Momenzadeh and Heidari1990) instead proposed a volcanogenic model that assumed the salt and related sulfates of the Hormuz series to have formed in association with volcanic or fumarole centres on a seafloor.
Some researchers have approached this problem by studying the effects of Na-metasomatism in the clastic sediments derived from crystalline basement rocks in closed rift basins (Van de Kamp, Reference Van De Kamp1973; Turner & Fishman, Reference Turner and Fishman1991; Van de Kamp & Leake, Reference Van De Kamp and Leake1996). These authors interpreted albite, zeolite and analcime as having been formed in closed basins, during diagenesis, with sodium supplied from groundwater or remobilized evaporites that reacted with detrital sediments. Mineeva (Reference Mineeva, Mao and Bierlein2005) considered the destruction of salt diapirs as a source of sodium for metasomatic processes and for the formation of albitites that accompany U-mineralization. Metasomatism of sediments, sedimentary-evaporite rocks and palaeosols leads to mineralogical changes that obscure their earlier compositions (e.g. Walker, Reference Walker1984; Fedo et al. Reference Fedo, Young, Nesbitt and Hanchar1997).
The occurrences of minor and major mineral phases in the samples studied in the present work indicate that the primary rock suffered a complex of alteration process, manifested by amphibolization, epidotization, albitization, carbonatization, silicification and scapolitization. Hydrothermal and metasomatic fluid mobile elements such as K, Na, Ca, Mg, Fe, Rb, Sr and SiO2 are not reliable indicators of primary magma composition. The origin of this fluid must be highly saline seawater or hot brines (Sulovsky, quoted in Bosak et al. Reference Bosak, Jaros, Spudil, Sulovsky and Vaclavek1998). Mineralogical and textural relations in the igneous inclusions found within the studied diapirs revealed three mineral assemblages: magmatic, late magmatic and vein mineralization. The development of the latter two types is due to hydrothermal enrichment in Na2O, K2O, Fe2O3, CaO, H2O, CO2 and O2. Furthermore, mineral paragenesis of gypsum, anhydrite, calcite, dolomite and the presence of corrosion textures, and porphyry and enterolithic structures document the hydration of anhydrite to gypsum because of the influence of meteoric waters acting on sedimentary rocks upwelling in the diapirs.
The mineral chemistry of clinopyroxene in the igneous inclusions points to two types of clinopyroxene: Ti-augite and diopside. The igneous pyroxenes crystallized at 1400 °C. However, the porphyritic textures in the hypabyssal and volcanic rocks indicate that some of the magma reached the surface before it crystallized. This is well documented by diopside thermometry at surface pressures. Mineral chemistry studies also show that some amphiboles and pyroxenes are Ti-rich (kaersutite and Ti-augite) and were generated at high temperatures, while the others are Ca-rich. Diopside and actinolite imply medium to low pressures. Chlorite thermometry points to two different conditions for chlorite formation. Some chlorites are due to alteration of such primary magmatic minerals as olivine at 500 °C and amphibole at 406 °C. Others are related to metasomatism and veinlet mineralization (330 °C).
The origin of volcanic and magmatic rocks within the salt diapirs has not yet been satisfactorily explained. Kent (Reference Kent1958) and Gansser (Reference Gansser1960) supposed their primary origin was in Cambrian times, whereas Harrison (Reference Harrison1930) considered that they occur only as exotic blocks without any direct intrusion into the salt. Bosak et al. (Reference Bosak, Jaros, Spudil, Sulovsky and Vaclavek1998) proposed a within-plate transitional to volcanic arc origin in a collisional environment for the basic volcanic rocks of the Hormuz series.
Whole-rock analyses indicate that the magmatic rocks crystallized from a single magmatic phase with alkaline (Na, K, Ti-rich) and some tendency to sub-alkaline affinity; all are related to the transitional magmatic series. This may relate to local rifts in the Hormuz sedimentary environment. Although the magmatic affinities evolved towards the MORB type, no ophiolites are present. Our stable isotope study of oxygen in quartz veins indicates that the hydrothermal fluids had a sedimentary origin, presumably from the evaporites. This is also supported by halite cubes in fluid inclusions within the quartz and the appearance of halite by normative calculations of the fluid inclusions (S. Taghipour, unpub. M.Sc. thesis, Univ. Isfahan, 2007) with salinities of 39.8–42.7 wt% NaCl. Finally, in the light of the data scattered in the literature and our own observations, we attribute the formation of evaporitic rocks of the Hormuz series exposed in the diapirs of Kaj-Rostam Abad, Dashtak and Doab in the High Zagros belt to evaporation of sea water in closed basins. We also attribute the volcanic inclusions in the Hormuz series to the extension of Lower Cambrian crust by extrusion of alkali-enriched volcanic rocks that were later subjected to alteration by metasomatizing hydrothermal fluids.
9. Conclusions
(1) The Kaj-Rostam Abad, Dashtak and Doab diapirs are examples of the numerous diapirs of the Hormuz series now emergent in the Zagros Mountain belt. These diapirs in the High Zagros probably started off consisting mainly of salt but have been exposed on the surface for longer than most. Consequently, they have lost huge volumes of halite to dissolution in rainwater. Remnant gypsum (anhydrite) and dolomite together with variegated shale, red sandstone and laminated limestone occur in these intrusive bodies. Basalt, andesite and basaltic-andesite with pronounced alkaline to tholeiitic affinities are the dominant igneous inclusions, which are classified as within-plate basalts.
(2) Ti-augite, diopside, kaersutite, olivine, plagioclase, apatite (magmatic stage) as well as actinolite, albite with some pycnochlorite, pistacite, calcite and andradite-grossular (late magmatic and vein mineralization) are the essential mineral assemblages developed in the studied igneous inclusions.
(3) Both pyroxene and amphibole are Ti-enriched (Ti-augite, kaersutite) and Ca-enriched (diopside, actinolite). Chlorite occurs as a metasomatic mineral as well as an alteration product of the amphibole and olivine. All are pycnochlorite, and crystallized at temperatures between 330 °C and 500 °C. By contrast, the Ti- and Ca-enriched pyroxenes formed at magmatic temperatures of 1130 °C and 1440 °C, respectively.
(4) The 18O and fluid inclusion data point to the role of meteoric waters circulating with magmatic waters within the evaporitic sequence.
(5) In general, our evidence points to the Hormuz evaporite series in the Zagros Mountains as having accumulated in volcanic rift basins in the Lower Cambrian crust.
Acknowledgements
This study is based on the M.Sc. thesis of Sedigheh Taghipour presented at the University of Isfahan, Iran. We would like to express our appreciation to Dr I. Richards (Department of Earth Sciences, Southern Methodist University, Dallas, USA) for O isotope access. Professor Christopher Talbot (Uppsala University, Sweden), Dr Abbas Bahroudi (University of Tehran, Iran) and Dr Mehdi Rezaei (University of Tehran, Iran) provided insightful comments that greatly helped our revision. Financial support for this investigation from the research council of the University of Isfahan is gratefully acknowledged.



