


 ) is narrower than the desired width (ω); and (2) iteratively increase the sample size until
 is smaller than the desired width (ω) with a specified degree of certainty (γ). Simulated data were created and tables are presented showing the different possible scenarios that a researcher may encounter. An R program is given and explained that will reproduce the results and make it easy for the researcher to create other scenarios.
Introduction
The presence of genetically modified plants (adventitious presence of unwanted transgenic plants, AP) has resulted in studies for investigating the effects on gene flow that can occur spatially and temporally, across geographical distances and down through generations (Christianson et al., [Reference Christianson, McPherson, Topinka, Hall and Good2008). This gene flow effect may be important in a country such as Mexico, a centre of diversity for maize, where the effects of AP maize outcrossing with traditional maize landraces and wild relatives such as tripsacum and teocinte are unknown. Different authors have reported different results in terms of detecting AP maize in Mexico. Quist and Chapela (Reference Quist and Chapela2001, Reference Quist and Chapela2002) were the first to report AP landraces collected in the Sierra Juarez region of the State of Oaxaca. In contrast, 4 years later, Ortiz-García et al. (Reference Ortiz-García, Ezcurra, Schoel, Acevedo, Soberón and Snow2005a, Reference Ortiz-García, Ezcurra, Schoel, Acevedo, Soberón and Snowb) sampled maize landraces in the same region of Oaxaca State and failed to detect AP. Two recent studies in Mexico showed the presence of AP in the south-east and west-central regions of Mexico. One study is on the dispersal of transgenic maize via imported seed in Mexico, where 3.1% and 1.8% of samples were detected as having AP (Dyer et al., Reference Dyer, Serratos-Hernández, Perales, Gepts, Piñeyro-Nelson, Chavez, Salinas-Arreortua, Yúnez-Naude, Taylor and Alvarez-Buylla2009). The other study showed evidence of AP, with estimated sample frequencies of 1.1% based on polymerase chain reaction (PCR) and 0.89% based on Southern blot (Piñeyro-Nelson et al., Reference Piñeyro-Nelson, van Heerwaarden, Perales, Serratos-Hernández, Rangel, Hufford, Gepts, Garay-Arroyo, Rivera-Bustamante and Álvarez-Buylla2009).
When attempting to detect AP, sampling methods are of paramount importance; there are two main sampling steps: (1) determining the optimal sample size (n) and the sampling strategy to be used when taking seeds at random from a seed lot (Cleveland et al., Reference Cleveland, Soleri, Aragón-Cuevas, Crossa and Gepts2005; Ortiz-García et al., Reference Ortiz-García, Ezcurra, Schoel, Acevedo, Soberón and Snow2005c); usually a large number of seeds (n) from a very large reference population (N) located in the region of interest must be collected because the frequency of AP is likely to be very low; and (2) determining the sample preparation and testing method to be used in the laboratory (Remund et al., Reference Remund, Dixon, Wright and Holden2001). Since it is not financially feasible to analyse all n individual seeds collected from a lot or from the field (step 1), it is essential to develop testing plans for reducing the number of samples to be analysed (Montgomery, Reference Montgomery1997). One plan consists of testing pooled seed samples (group testing) (Remund et al., Reference Remund, Dixon, Wright and Holden2001).
Group testing consists of pooling a number of units together and performing a single test on the resulting group. A negative result from such a test indicates the absence of any infection in the group, while a positive outcome shows that one or more units are infected (Hepworth, Reference Hepworth1996). All k individuals in the positive pool must then be examined to identify individuals with the infection or to estimate the proportion of infected individuals. This may not be necessary if the objective is simply to know whether any individuals have the infection or to estimate the minimum infection rate (Hernández-Suárez et al., Reference Hernández-Suárez, Montesinos-López, McLaren and Crossa2008). Pooled samples can be used when: (1) the trait is discrete, i.e. it can be measured as presence or absence, or some countable quantity; (2) the proportion of positives (e.g. AP) is relatively small; and (3) pooling the samples does not alter the characteristics of individual samples (Federer, Reference Federer1991).
Group testing (or pooling samples) is used in laboratory testing plans and consists of forming groups containing several units (plants) for estimating the prevalence of AP in a population at a low cost. Laboratory tests are expensive, and group testing makes it possible to lower laboratory testing costs without losing precision. An early application of group testing was to estimate the prevalence of plant viruses transmitted by insects (Watson, Reference Watson1936; Thompson, Reference Thompson1962). Although Feller (Reference Feller1957, p. 225) stated that the group testing method originated with Dorfman's blood testing problem (Dorfman, Reference Dorfman1943), the procedure was later applied in studies conducted in the fields of physiopathology, public health and plant quarantine (Chiang and Reeves, Reference Chiang and Reeves1962; Bhattacharyya et al., Reference Bhattacharyya, Karandinos and DeFoliart1979; Swallow, Reference Swallow1985, Reference Swallow1987; Romanow et al., Reference Romanow, Moyer and Kennedy1986; Burrows, Reference Burrows1987; Hughes and Gottwald, Reference Hughes and Gottwald1998; Zenios and Wein, Reference Zenios and Wein1998; Remund et al., Reference Remund, Dixon, Wright and Holden2001). Pooling samples in biomedical studies has now become a common practice. For example, more than 15% of the data sets deposited in the Gene Expression Omnibus Database involve pooled RNA samples (Kendziorski et al., Reference Kendziorski, Irizarry, Chen, Haag and Gould2005). Lindan et al. (Reference Lindan, Mathur, Kumta, Jerajani, Gogate, Schachter and Moncada2005) estimate that 12% of laboratories in the USA are already using group testing because it allows them to achieve a significant increase in specimen loads (Bilder, Reference Bilder2007).
Detection of AP is attracting a great deal of public attention due to food safety concerns. The unintentional mixing of AP with non-AP is an important consumer concern. In 2000, StarLink corn, genetically modified maize that contains Bt toxins that kill lepidopteran pests, was detected in samples taken from imported cornmeal by a consumer group in Japan (Yamamura and Hino, Reference Yamamura and Hino2007). To avoid similar situations, it is important to establish sample inspection procedures that meet the requirements of new legislation. This has motivated the use of sampling procedures for detecting AP that include group testing. For example, Yamamura and Hino (Reference Yamamura and Hino2007) and Hernández-Suárez et al. (Reference Hernández-Suárez, Montesinos-López, McLaren and Crossa2008) proposed sampling procedures for detecting AP that have a certain threshold of detection.
The main objective of the method proposed by Yamamura and Hino (Reference Yamamura and Hino2007) is to estimate the proportion of AP units for any group size with a threshold of detection. However, they also proposed a sample size procedure that takes into account the limit of detection, d, but ignores AP concentration in individual seeds (c), and declares a sample unsatisfactory if at least one group is judged as being defective (i.e. at least one individual contains AP, m>0). This judgment is liberal and usually requires the smallest sample size. A method that takes into account the threshold of detection, AP concentration per individual, c, and threshold values such as m>1 and m>2 has been proposed by Hernández-Suárez et al. (Reference Hernández-Suárez, Montesinos-López, McLaren and Crossa2008); this method requires very large sample sizes for detection.
The advantage of the procedures proposed by Yamamura and Hino (Reference Yamamura and Hino2007) and Hernández-Suárez et al. (Reference Hernández-Suárez, Montesinos-López, McLaren and Crossa2008) for determining sample sizes for use in group testing is that they take into account the threshold of detection, because analytical instruments [for example, enzyme-linked immunosorbent assay (ELISA) or PCR] have thresholds of detection below which the existence of AP concentration is not detected. If group size (k) is large, the material will not be detected even if the group contains one AP plant, because the material is highly diluted. The problem of the threshold of detection has not been fully considered yet, although several authors have discussed the optimal allocation of k and g (Thompson, Reference Thompson1962; Swallow, Reference Swallow1985, Reference Swallow1987; Yamamura and Hino, Reference Yamamura and Hino2007). Most people use a small group size so that they can detect the existence of defective units if the group has at least one unit of AP.
However, neither of the two methods mentioned above is strict enough to guarantee a reliable estimator of the prevalence of AP in field lots (p), because the sample sizes required by these two methods have the objective of only detecting the presence of AP, but do not provide a methodology for estimating the parameter value, the proportion of AP units, p. This means that the sample sizes computed by the methods above do not ensure a narrow confidence interval (CI) because they are based only on the power of the test.
In the context of parameter estimation, accuracy is defined as the square root of the mean squared error (MSE), which is a function of both precision and bias. Precision is inversely related to the variance of the estimator, and bias is the systematic discrepancy between the value of an estimator and the true (unknown) parameter value (Kelley, Reference Kelley2007a, Reference Kelleyb). As the confidence interval width (CIW) decreases, holding a constant CI coverage, the estimate is contained within a narrower set of plausible parameter values and the expected accuracy of the estimate improves (i.e. the root MSE is reduced). Thus, provided that the CI procedure is exact, when the width of the (1 − α)100% CI decreases, the expected accuracy of the estimate necessarily increases (Kelley, Reference Kelley2007a). This approach to sample size estimation has been termed accuracy in parameter estimation (AIPE), because when the width of the (1 − α)100% CI decreases, the expected accuracy of the estimate increases (Kelley and Maxwell, Reference Kelley and Maxwell2003; Kelley et al., Reference Kelley, Maxwell and Rausch2003; Kelley and Rausch, Reference Kelley and Rausch2006; Kelley, Reference Kelley2007a). It should be pointed out that the general goal of AIPE has nothing to do with rejecting a null hypothesis, which is the aim of power analysis (e.g. Kraemer and Thiemann, Reference Kraemer and Thiemann1987; Cohen, Reference Cohen1988; Lipsey, Reference Lipsey1990; Murphy and Myors, Reference Murphy and Myors1998; Kelley, Reference Kelley2007a, Reference Kelleyb). Although the AIPE approach is not new (e.g. Mace, Reference Mace1964), its application in the context of agricultural sciences has not been examined.
The objective of this research is to propose a methodology for detecting and estimating the proportion of AP (p) using group testing for planning the sample size to be used in laboratory testing such that the interval estimation of p will be sufficiently narrow, and therefore, the computed estimate has a sufficient degree of the expected accuracy. The maximum likelihood estimate and CIs for p under group testing with the dilution effect are developed. Since the main goal of AIPE is to avoid obtaining CIs that are ‘embarrassingly large’ (Cohen, Reference Cohen1994, p. 1002) and of limited usefulness (Kelley, Reference Kelley2007a, Reference Kelleyb, Reference Kelleyc), in this research we develop: (1) a planning method for determining the necessary initial sample size so that the expected width of the CI for the proportion of AP (p) is sufficiently narrow; and (2) a modified sample size procedure (using the initial sample size), so that there is some specified level of certainty that the computed CI will be sufficiently narrow (e.g. 85% probability that the 95% CI for p will be no wider than say, 0.04 units). General methods and algorithms are developed for determining necessary sample sizes in different situations. A series of tables for the required sample size are provided for diverse scenarios, which may help researchers planning studies in which the prevalence of AP (p) is estimated with a sufficiently narrow CI.
Materials and methods
Maximum likelihood estimate and confidence intervals for p under group testing with the dilution effect
When k individuals forming a pool are mixed and homogenized, the AP will be diluted; this dilution effect increases with the size of the pool and may decrease the AP concentration in the pool below the laboratory test detection limit (d), thereby increasing the number of false negatives (i.e. seed(s) with AP not detected when in fact it is present in the group). Hernández-Suárez et al. (Reference Hernández-Suárez, Montesinos-López, McLaren and Crossa2008) proposed a model that considers the limit of the laboratory detection test for a pool sampling method based on the Dorfman (1943) model. They assume a reference population of size N, with a proportion p of individuals with AP [or type (+)]. They also assumed that the concentration of AP per individual, c, is known (i.e. transgenic DNA as % of total DNA in the seed). When g pools are formed from a total of n individuals, the AP concentration in a single (+) individual in a pool is reduced to cg/n = c/k (for k = n/g). If d is the laboratory detection limit, it is required that (c/k) ≥ d, in which case the probability of detecting AP in a pool with at least one (+) individual is 1, and zero otherwise. If a pool has X (+) individuals, then it is required that [(cX)/k] ≥ d.
Note that in this study, the units of AP concentration, c, can be given in % DNA, whereas the units of c for other traits of interest, such as unwanted diseases in the grain, may be given as a % of the kernel (Laffont et al., Reference Laffont, Remund, Wright, Simpson and Gregoire2005). Therefore the variable X = number of (+) individuals in a pool of size k (X = 0,1,2,…, k) is a binomial variable with parameters k and p, that is, X ~ Bin(k, p). Hence, Hernández-Suárez et al. (Reference Hernández-Suárez, Montesinos-López, McLaren and Crossa2008) propose that the probability that a group will be detected (+) is:

where the quantity v is given by [dk/c], that is, the smallest integer not smaller than dk/c. If d = 0, v = 1 (v represents the minimum number of AP necessary for detection). Furthermore,

This means that F(p|v, k − v+1) is the cumulative density function of the beta distribution with parameters v, k − v+1. Let F − 1(p|v, k − v+1) be the inverse function.
On the other hand, according to Yamamura and Hino (Reference Yamamura and Hino2007), if p is the true proportion of AP, k is the number of units (plants) in a group, g is the total number of groups to be tested, and m is the number of groups that were judged as having AP, assuming that the sampling units are drawn at random and mixed uniformly within each group.
Therefore, if there is a threshold of detection, the likelihood is given by:
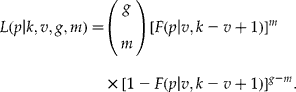
Equation (2) is maximized at F(p|v, n − v+1) = m/g. Hence, the maximum likelihood estimate is given by:

Note that if v = 1, F(p|v, k − v+1) = θ = m/g = 1 − (1 − p)k is the probability of a pool being positive (it has AP) if the threshold of detection is not taken into account (for details, see Yamamura and Hino, Reference Yamamura and Hino2007 or Hernández-Suárez et al., Reference Hernández-Suárez, Montesinos-López, McLaren and Crossa2008). Equation (3) simplifies to  , which is the conventional maximum likelihood estimate of p for group testing with groups of equal size and no threshold of detection (Remund et al., Reference Remund, Dixon, Wright and Holden2001). Also, it should be noted that when c = 1, equation (3) is equal to the estimator proposed by Yamamura and Hino (Reference Yamamura and Hino2007) because they defined v = [kd], that is, they assumed that the concentration of AP per individual c = 1.
With this information and using the ideas of Tebbs and Bilder (Reference Tebbs and Bilder2004) and Yamamura and Hino (Reference Yamamura and Hino2007), the following is an ‘exact’ CI

where  and
 .
 is the lower endpoint of the 100(1 − α)% confidence interval of θ and is obtained with the α/2 quantile of a beta distribution with parameters m and (g − m)+1 and
 (the upper endpoint of the CI of θ) is the 1 − α/2 quantile of a beta distribution with parameters m+1 and (g − m). These ‘exact’ CIs (Clopper Pearson interval) are easy to calculate because statistical functions for inverting the F or the incomplete beta function are widely available in standard statistical packages. Besides, the coverage probability of the CIs constructed by ‘exact’ CIs (the inverse of exact testing) is usually larger than 100(1 − α)%.
Also, it is important to mention that the first two moments of  are given by:
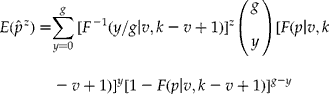
for z = 1, 2. Note that if z = 1, equation (5) is the expected value of  . For simplicity we will write
 as
 . Therefore, the
 and variance is equal to
 .
How to construct the pools and determine their optimum size
Given that the point estimator of p derived from group testing will be biased, the question is how large the pools should be (Hepworth, Reference Hepworth1996). Several methods for determining the optimum pool size (k) have been proposed, e.g. the one suggested by Thompson (Reference Thompson1962), where MSE is minimized with a pool size of k = (-1.5936 − p)/p. Chiang and Reeves (Reference Chiang and Reeves1962) suggested a pool size of k = log (1/2)/ log (1 − p), which would have an equal chance of producing a positive or negative pool. If c (the concentration of AP per individual) and the threshold of detection of the laboratory test (d) are known, Hernández-Suárez et al. (Reference Hernández-Suárez, Montesinos-López, McLaren and Crossa2008) proposed k = (c/d) − 1. However, this method can give rise to very large values of k, just like the Thompson method (1962), so Hernández-Suárez et al. (Reference Hernández-Suárez, Montesinos-López, McLaren and Crossa2008) used k = (c/d) − 1 as the maximum possible value of k and proposed an optimum pool size that minimizes the expected laboratory test value; this optimum value of k is between 1 and k = (c/d) − 1.
Therefore, the optimal pool size (k) is a function of both the statistical model and the chemistry of the assay used to screen the pools. For example, most PCR-based assays have been shown to be capable of handling a maximum of 100 samples in a pool while retaining an acceptable level of sensitivity and specificity (Katholi and Unnasch, Reference Katholi and Unnasch2006). Similarly, currently available commercial antibody-based tests may be used with a maximum pool size of 50 units. This suggests that the assay's biochemical properties are more likely to impose limits on the optimal pool size than the constraints imposed by the statistical analysis of the results. For these reasons, in the present article the researcher has to choose the value of the pool size (k), and the proposed method will provide the optimum number of pools.
AIPE for the proportion of AP (p) using group testing
When planning sample size, we need to use an iterative process (Kelley, Reference Kelley2007a, Reference Kelleyb) to obtain a sufficiently narrow expected confident interval. Let p L(X) be the random lower confidence limit for p, and p U(X) be the random upper confidence limit for p at the specified confidence level, where X represents the observed data matrix on which the CI is based. For notational ease, the lower and upper random CI limits will be written as p L and p U, respectively, with the understanding that they are random because they are based on the observed data. The entire width of the obtained CI using equation (4) is then given as

Let ω be defined as the desired CIW, which is specified a priori by the researcher. A simple way to define ω is as ω = (re)p, where re (0 ≤ re ≤ 1) is the desired relative width of the CI (relative error) and p is the population proportion or its estimated value. Also, in order to plan sample size under the goals of AIPE, p must be known (or estimated). To obtain (w y), it is necessary to know the number of pools (g) as well as the number of pools that tested positive (m) in the laboratory. Nevertheless, since the number of pools (g) is unknown, it is not possible to know how many of the pools obtained from the sampling procedure will contain AP units (m). Thus, w y cannot be determined exactly. However, according to Tebbs and Bilder (Reference Tebbs and Bilder2004) and Vollset (Reference Vollset1993) and Newcombe (Reference Newcombe1998), it is possible to determine the exact mean CIW value by averaging the widths of the intervals associated with the number of successes 0 ≤ y ≤ g, given g, k and p using the expression:
![\overline{w} ( p , g , k ) = { \sum _{ y = 0}^{ g } }\, w _{ y }\left ({\begin{array}{ccc} g \\ y \\ \end{array} }\right )[ F ( p \vert v , k - v + 1)]^{ y }\times [1 - [ F ( p \vert v , k - v + 1)]^{ g - y }](https://static.cambridge.org/binary/version/id/urn:cambridge.org:id:binary:20151024043049775-0279:S096025851000005X_eqn7.gif?pub-status=live)
where w y is the width of the ‘exact’ CI, and is computed using equations (4) and (6), for Y = y, given p, g and k. The mean width of a CI is an important criterion for assessing the performance of CI methods and for comparing different methods for estimating CI (Cesana et al., Reference Cesana, Reina and Marubini2001).
Comments about the estimate of p
The estimate of  from equation (3) using group testing with dilution effect is biased (upward or downward) for values of k>1 and of v>1. Also, the size of the bias is influenced by the unknown value of the parameter, p, and the bias increases as p increases. The bias is small when the true value of p is small and becomes substantial only when p is large, say, 0.1 (or 10%). For unbiased estimators, the CIW is computed using the population value. Due to the bias of
 as an estimator of p, if the sample size procedure is based on p, it would lead to inappropriate estimates of sample size (Kelley, Reference Kelley2007a). Therefore, the expected value of
 equation (5) with z = 1] will be used in computing the required sample size in order to achieve a sufficiently narrow CIW. This means that we substitute
 from equation (5) for p, when determining the required sample size, so that the mean width is not larger than ω. Note that since
 is a function of g and k,
 will be updated for each iteration of the sample size procedure, as each iteration is based on a different sample size. This means that we will work with
 instead of
 .
Steps for determining the optimum sample size with narrow CIs for p
Step 1. Computing the initial (or preliminary) sample size
Operationally, an algorithm that guarantees finding the appropriate sample size consists of starting at some minimal sample size, say g 0, and determining  using equation (5) so that we can find the value of g that satisfies
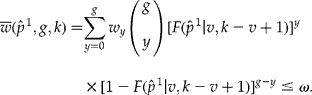
For simplicity, we will write  as
 , realizing that the expected width will necessarily depend on 1 − α and
 , which itself depends on g, k and p. If the CIW is wider than the desired value (ω), sample size should be increased by one, and the CIW should be determined again. This iterative process of increasing sample size and recalculating the expected CIW should continue until
 (where i represents a particular iteration number). This method finds the required sample size for achieving a mean width of the CI that is sufficiently narrow. However, it does not guarantee that for any particular CI the observed width will be sufficiently narrow because the mean CIW,
 , will be a random variable (
 ) that will fluctuate from sample to sample when the value of p needs to be estimated. To demonstrate this, we need to calculate the probability of obtaining CIWs that are less than the specified value (ω), which can be computed as:
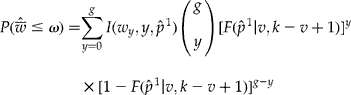
where  is an indicator function showing whether or not the actual CIW calculated with equations (4) and (6) is ≤ ω, and
 is considered a random variable because the exact value of p is unknown.
We show a numerical example in Table 1 with several values of the proportion of AP in the population (p), the required number of pools (g), and the probability  that the mean CIW
 is less than the specified value (ω = 0.01) calculated with equation (9). This is done with the objective of showing that the initial number of pools (g p, second column, Table 1) computed using equation (8) has a probability of around 0.50 that the mean CIW
 (third column, Table 1). For example, when p = 0.005, the preliminary (initial) number of pools (g p) is 24 and the probability of obtaining a CIW ≤ ω = 0.01 is 0.5311. With p = 0.04, g p = 418, we can only be 51.38% certain that the CIW will be ≤ ω = 0.01. When the number of pools is increased by 10 (g m10, fourth column, Table 1),
 , increases. For example, when p = 0.005 and there are 34 pools,
 , and for 54 pools,
 . Then, results in Table 1 show that an increasing number of pools is required to achieve
 with a high probability of success.
Preliminary number of pools (g p) computed using equation (8) and three increments, g m10, g m30 and g m80, each with its corresponding probability ( ) that the expected confidence interval width (CIW)
 is less than the specified value (ω=0.01). For a 95% CI, the limit/threshold of detection d=0.0005, concentration of AP per unit c=0.08, and pool size k=50. The proportion of AP in the population is p, ω=0.01 is the desired CIW, and
 is the probability that the expected CIW
 is less than the specified value (ω=0.01) calculated using equation (9)

Step 2. Planning sample size that assures a CI no wider than the desired width with a certain probability
In step 2, we introduce a modification of the previous sample size procedure so that a probabilistic statement can be incorporated into the sample size planning procedure, in order to guarantee a sufficiently narrow CI. This procedure allows us to use the initial number of pools and compute a modified number of pools. In any given sample, the estimator  will not be equal to p, even if the true value of p is known. Approximately half of the time, the sample
 will be larger than p, and the other half of the time
 will be smaller than p. For this reason, the number of pools (g) produced by equation (8) only ensures approximately a 50% chance that the interval will be narrower than required (see Table 1), because
 will vary from sample to sample.
To increase the likelihood that the obtained mean CI width will be no wider than required, we propose a modification of the initial sample size calculated in step 1. This will produce a modified number of pools (g m) such that the researcher can be γ percent confident that the observed  will be less than or equal to the required sample size. Using equation (8) gives the preliminary number of pools and, to obtain g m (modified number of pools), we need to solve:

Equation (10) is equal to:
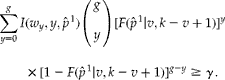
The procedure involves increasing the initial number of pools (g p) by one unit and recalculating equation (11) each time until the desired degree of certainty (γ) is achieved; this will produce the modified number of pools (g m) that assures, with a probability ≥ γ, that the  will be no wider than ω. In other words, g m ensures that the researcher will have approximately 100γ% certainty that a computed CI will be of the required width or less. For example, if the researcher requires 90% confidence that the obtained
 will be no larger than the desired width (ω), 1 − γ would be defined as 0.10, and there would be only a 10% chance that the width of the CI, around
 , would be larger than specified (ω) (Kelley and Maxwell, Reference Kelley and Maxwell2003; Kelley, Reference Kelley2007a, Reference Kelleyb).
As for choosing a 100γ% CI for estimation as compared with choosing the 100(1 − α)% CI for hypothesis testing, important distinctions can be pointed out. The most obvious difference in the present context is that (1 − γ) represents the probability of obtaining a mean CI with an observed  that is larger than the specified required width of ω, whereas α is the probability of rejecting a null hypothesis that is true. Therefore, while α is thought of as one of two constant values, 0.05 or 0.01, γ (γ ≥ 0.5) is chosen by the researcher to achieve some desired degree of certainty that the precision of the parameter being estimated will be achieved. Thus CIs formed in the context of hypothesis testing have different goals than CIs formed when the researcher wishes to obtain a precise estimate of the parameter of interest (Kelley and Maxwell, Reference Kelley and Maxwell2003).
Thus, the modified sample size procedure of step 2 ensures that the observed CI will not be wider than ω with a probability no less than γ. The method for determining the modified sample size is consistent, in theory, with other methods of sample size planning that attach a probability statement to the CIW when the aim is to make them sufficiently narrow (e.g. Kupper and Hafner, Reference Kupper and Hafner1989; Hahn and Meeker, Reference Hahn and Meeker1991; Kelley and Maxwell, Reference Kelley and Maxwell2003; Kelley et al., Reference Kelley, Maxwell and Rausch2003; Kelley and Rausch, Reference Kelley and Rausch2006; Kelley, Reference Kelley2007a, Reference Kelleyb).
Results
Details on how the simulation was performed using the MDEGMO package, and on how to change this when wishing to use different values of k, m, c, p and d are given in the Appendix. The R programs written in the MDEGMO package are available at http://www.cimmyt.org/english/wps/biometrics/index.htm. Results of the estimated proportion of AP ( ) and the CIs from simulating six different cases for various values of g, k, m, c and d are shown in Table 2. As already mentioned, v represents the minimum number of AP for detection, and v = [dk/c] is the smallest integer but not smaller than dk/c. If d = 0, then v = 1. In Cases 1, 2 and 3, the number of units per pool (k) is increased while keeping g = 100, m = 20, c = 0.08 and d = 0.0005. When k increases, v increases and takes on values of 1, 2 and 3 for k = 50, 200 and 400, respectively, while the maximum likelihood estimate decreases (0.0045, 0.0041 and 0.0038, respectively). On the contrary, for Cases 4, 5 and 6, when g = 100, m = 20, c = 0.14 and d = 0.0025, if k increases, v increases taking on values of 1, 4 and 8, respectively (the maximum likelihood estimate increases as well). The width of the 95% two-sided CI decreased when k increased in both series of examples.
Hypothetical example for estimating the proportion of AP units in the population and the upper and lower confidence limits
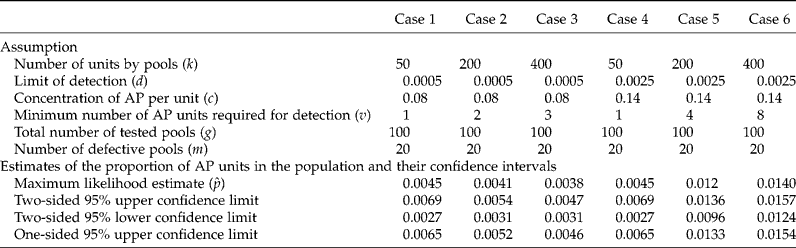
As mentioned before, when k increases, v increases. For example, in Case 3 (Table 2), if there were only two AP units in a pool of size k = 400, the laboratory test would be negative, given that the concentration of the substance of interest (c) in the pool is below the laboratory test's threshold of detection, d = 0.0005, because AP concentration in the pool will be (0.08 × 2)/400 = 0.0004 ( < d = 0.0005) due to the dilution effect. This is why, in Case 3, at least three AP units per pool are required for detecting a positive result (0.08 × 3)/400 = 0.0006 (>d = 0.0005). For Case 6, if there are at most six AP units in any one of the g = 100 pools of size k = 400, the laboratory test result will be negative, given that the c of the entire pool will be smaller than the laboratory test's threshold of detection, d = 0.0025, because AP concentration in the pool will be (0.14 × 6)/400 = 0.0021 ( < d = 0.0025). This is why, in Case 6, at least eight AP units per pool are required for detecting a positive result (0.14 × 8)/400 = 0.0028 (>d = 0.0025). Also, this is the explanation of why  is biased (upward and downward). It is very important to take this into account when designing a study aimed at detecting and estimating the presence of AP, because if we increase the size of the pool too much, the rate of false negatives will increase significantly.
The behaviour of the CIW is observed in Fig. 1. When the size of the pools increases (increase k), the CIW increases. For k = 1, the CIW is smaller than 0.3, and the maximum is reached when p = 0.5. For k = 15, the expected CIW is ≥ 0.7 at a prevalence rate of ≥ 0.3. For k = 50, the mean CIW is ≥ 0.7 from values p ≥ 0.10, and for p ≥ 0.15, the mean CIW is ≥ 0.88. This indicates that using group testing to estimate p ≥ 0.10 is not recommended since the estimation is very imprecise (CIW ≥ 0.80). These results are in agreement with those reported by Williams and Moffitt (Reference Williams and Moffitt2001) and by Shah et al. (Reference Shah, Dillard and Nault2005), Katholi and Unnasch (Reference Katholi and Unnasch2006), Kline et al. (Reference Kline, Brothers, Brookmayer, Zeger and Quinn1989) and Tebbs and Bilder (Reference Tebbs and Bilder2004), who suggest using the group testing method only when p in the population is small. On the other hand, if k = 1, it can be clearly observed that there is no monotonous increase or decrease relation between the CIW and the value of p (Fig. 1). When k = 1, the CIW increases and reaches a maximum when p = 0.5, and decreases afterward due to maximum variance obtained when p = (1 − p) = 0.5. Moreover, the width, in this case, is symmetric.
Relationships between the expected width of the 95% confidence interval (CI) for a population prevalence (p) with a concentration of AP per units c = 0.08, laboratory detection limit d = 0.0005, 100 and 50 pools (g = 100, 50), and three pool sizes k = 50, 15, 1.

In Fig. 1, it can be observed that by keeping k, c and d fixed when increasing g, the mean of CIW decreases; however, this decrease is small when going from g = 50 to g = 100 for k = 1, k = 15 and k = 50, but increases in proportion to the decrease in k. Thus, it is clear that an important decrease in the mean CIW can be achieved by decreasing k or increasing the number of pools (g). Finally, for values of g other than 100 and 50, and for values of k other than 15 and 50 (but greater than 1), the CIWs are expected to show behaviour similar to that observed in Fig. 1. Since there is an increasing monotonic relation between the value of p and the CIW, due to the higher p, if k>1, a larger mean CIW is expected. This is very important to consider when one wishes to use group testing.
Although the Appendix provides information on implementing the methods proposed and discusses how to obtain sufficiently narrow CIs for any combination of k, p, ω, γ, α, d and c using the R package (R Development Core Team, 2007), tables of selected conditions are provided. These tables are not meant to include all potentially interesting conditions; rather, they are intended to provide researchers with: (1) a convenient way to plan sample size when the situation of interest is approximated by the scenarios covered by the tables; and (2) a way to illustrate the relation between k, p, ω, γ, α, d, c and the necessary sample size (g).
The most aggressive sampling plans in a transgenic seed AP testing practical exercise that tested for the presence of AP seed have sampled up to 50,000 seeds. Therefore, to use realistic simulated numbers, the confidence intervals width in Tables 3–5 were selected such that the total number of plants tested were below 50,000.The values in Tables 3 and 4 are based on numbers that should be useful for detecting and estimating p of AP with small values of p, while values in Table 5 are used with higher values of p. Researchers can run cases with more extreme sample sizes using the R package (Appendix).
Required sample size (number of pools, g) for a 95% confidence interval (CI), laboratory detection limit d=0.0005, and concentration of AP per unit c=0.08. The proportion of AP in the population is p, k is the size of the pool, γ is the desired degree of certainty of achieving a CI for p that is no wider than the desired value, ω is the desired CI width, g p is the required initial number of pools when γ is not specified (γ ≈ 0.5) and g m is the required modified number of pools when γ is specified

Necessary sample size (number of pools, g) for a 99% confidence interval (CI), laboratory detection limit d=0.0005, and concentration of AP per unit c=0.08. The proportion of AP in the population is p, k is the size of the pool, γ is the desired degree of certainty of achieving a CI for p that is no wider than the desired value, ω is the desired CI width, g p is the required initial number of pools when γ is not specified (γ ≈ 0.5) and g m is the required modified number of pools when γ is specified

Necessary sample size (number of pools, g) for 95% and 99% confidence intervals (CIs), laboratory detection limit d=0.0001, concentration of AP per unit c=0.08, and pool size k=50. The proportion of AP in the population is p, γ is the desired degree of certainty of achieving a CI for p that is no wider than the desired value, ω is the desired full CI width, g p is the required initial number of pools when γ is not specified (γ ≈ 0.5) and g m is the required modified number of pools when γ is specified
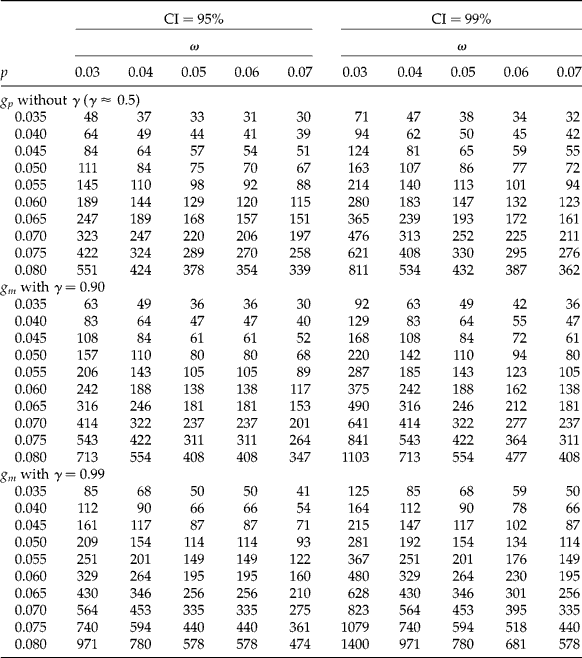
Sample sizes are shown for k values of 50, 100 and 200; p values of 0.005 to 0.02 by 0.005; ω values of 0.006 to 0.015 by 0.001; a sub-table with the preliminary number of pools g p without giving a value to γ, along with sub-tables with the modified number of pools g m and γ values of 0.90 and 0.99, each for CI coverage of 95% (Table 3) and 99% (Table 4). Each table has a threshold of detection (d = 0.0005) and a concentration of AP per unit of c = 0.08. Each condition is crossed with all other conditions in a factorial manner; thus there are a total of 720 situations for planning an appropriate sample size.
Suppose a researcher is interested in estimating p for AP maize in the region of Oaxaca, Mexico, where Quist and Chapela (Reference Quist and Chapela2001) reported finding AP maize. First of all, it is necessary to corroborate this information and estimate p. With this information and after doing a literature review of other studies, it is hypothesized that p = 0.01. For k = 50, assume that the final CIW is w y = (p U − p L) ≤ w = 0.006. The application of the method leads to a required (preliminary) number of pools of g p = 122, each of size k = 50. This sample size is contained in the first sub-table (g p without γ; γ ≈ 0.5) of Table 3 where k = 50, p = 0.01, and ω = 0.006.
Realizing that g p = 122 will lead to a sufficiently narrow CI only about half of the time, the researcher incorporates an assurance of γ = 0.99, which implies that the width of the 95% CI will be larger than required (i.e. 0.006) no more than 1% of the time. From the third sub-table of Table 3 (g m with γ = 0.99), it can be seen that the modified sample size procedure yields a necessary number of pools g m = 168. Using a sample size of 168 will thus provide 99% assurance that the obtained CI for p will be no wider than 0.006 units. Similarly, Table 4 shows that the required number of pools for 99% CI is larger than for 95% CI.
Table 5 was designed for a k = 50, p values of 0.035 to 0.08 by 0.005, ω values of 0.03 to 0.07 by 0.01, sub-tables with the initial number of pools (g p) without γ, along with the modified number of pools (g m) with γ values of 0.90 and 0.99 each for CI coverage of 95% and 99%, with a threshold of detection (d = 0.0001) and an AP concentration of c = 0.08. Crossing each condition in a factorial manner gives a total of 330 situations for planning an appropriate sample size.
For example, suppose that a researcher desires to estimate the p of mosquitoes in a population of insects. From a literature review and similar studies, it is hypothetized that p = 0.08. Also, suppose that the researcher wishes to obtain a 95% CI that excludes 0.065 and 0.095; that is, ω = 0.03. Using Table 5 and looking at the first sub-table at p = 0.08 and ω = 0.03 leads to a required (initial) number of pools of g p = 551. However, this number of pools will lead to a sufficiently narrow CI only about half of the time; for this reason, the researcher incorporates an assurance of 90%. The second sub-table of Table 5 shows that the modified sample size procedure yields a modified number of pools, g m = 713. This modified sample size (number of pools) will provide 90% assurance that the obtained CI for p will be no wider than 0.03 units.
A summary of the results contained in Tables 3–5 is provided. Holding all other factors constant, (1) larger values of p, (2) smaller values of ω, (3) larger values of γ, and (4) larger values of CI coverage (i.e. 1 − α) all lead to larger sample sizes (that is, a higher number of pools). Smaller values of ω imply that a larger sample size is necessary to obtain a narrower CI. Increasing the certainty that the CI will be sufficiently narrow (e.g. 99% certainty compared with 90% certainty) also requires a larger sample size. Similarly, as CI coverage increases (i.e. a decrease in α), the sample size for a desired CIW also increases. The reverse is also true: (1) a decrease in p, (2) an increase in ω, (3) smaller values of γ, and (4) smaller CI coverage all lead to smaller sample sizes.
Conclusion
This article presents a method for determining the sample size (number of pools or groups) that guarantees that the CIW obtained will be less or equal to a specified value (ω), with a probability level of γ. The first step of the proposed method allows researchers to plan sample size so that the expected width of the CI for p is sufficiently narrow. A modification allows a desired degree of certainty (γ) that is incorporated into the method, so that the obtained CI will be sufficiently narrow with some specific probability (e.g. 85% assurance that the 100(1 − α)% CIW will be no wider than ω units). The method is not related to the issue of rejecting null hypotheses, because it focuses only on the precision of estimating p using group testing.
The article also presents the maximum likelihood estimator of the prevalence p under group testing, as well as its ‘exact’ CI, taking into account the limit/threshold of detection, d, of the laboratory test and the AP concentration per unit, c. The method proposed in this study is useful for planning sample size as well as for point and interval estimation of p. On the other hand, it is worth mentioning that for estimating small values of p it is necessary to set narrow CIW (small ω), as illustrated in Fig. 1.
Although the method proposed in this paper guarantees precision in the estimation of p, it cannot be solved in an analytical way; which is why tables of the required sample size (number of pools) are provided for a variety of scenarios that may help researchers plan an appropriate sample that guarantees a narrow CI in the estimation of AP. However, it is not possible to cover all possible combinations of k, p, ω, γ, α, d and c; this is why appropriate programs in R package (R Development Core Team, 2007) can be applied to allow the user to quickly and simply plan the sample size according to her/his requirements or needs (Appendix). Finally, it is important to clarify that the methods presented here assume perfect sensitivity and specificity, which must be taken into account when designing a study.
Appendix
Using MDEGMO to implement the methods
All of the methods and procedures discussed and the algorithms presented in this article can be implemented in the Methods for Detection and Estimation of Genetically Modified Organisms (MDEGMO) R package (R Development Core Team, 2007). This appendix provides a brief overview of the MDEGMO functions that can be used when the prevalence of AP using group testing is of interest. The MDEGMO R package is available at http://www.cimmyt.org/english/wps/biometrics/index.htm. Because MDEGMO is an optional package, it must be loaded with each new R session where its routines will be used. Packages in R are loaded with the library() command, which is illustrated with MDEGMO as follows:

Maximum likelihood estimate of p
The prev.gmo.p() function can be used directly to estimate the prevalence ( ) of AP by maximum likelihood. Use the example in Table 2 (Case 2) where k = 200, d = 0.0005, c = 0.08, g = 100 and m = 20. The functions are:

where k is the number of units by pool, d is the threshold of detection of the analytical instrument, c is the concentration of AP per unit, g is the total number of tested pools, and m is the number of AP per pools. Implementation of this function yields a maximum likelihood estimate of p equal to 0.0041 or 0.41%. This means that in this population, the estimated p of AP is 0.41% (as reported in Table 2, Case 2).
Confidence interval for p of AP
The ci.gmo.p() function can be used directly to determine the confidence limits for p. The lower and upper critical values are returned by specifying the following arguments in the ci.gmo.p() function:

where k is the number of units by pool, d is the threshold of detection of the analytical instrument, c is the concentration of AP per individual, g is the total number of tested pools, m is the number of defective pools, and conf.level is the desired level of confidence (i.e. 1 − α). Implementing this function yields values of 0.0054 (0.54%) and 0.0031 (0.31%) for the upper and lower confidence limits of p using a level of confidence of 95%.
Planning sample size for p
Using the example in Table 3, where p = 0.01 and ω = 0.006 for a 95% CI, the ss.gmo.aipe() function can be used so that the expected width is sufficiently narrow and given as:

where p is the population prevalence (i.e. p), conf.level is the confidence level (i.e. 1 − α), k is the pool size, d is the threshold of detection of the analytical instrument, c is the concentration of AP per unit, and width is the desired CIW. Implementation of this function yields 122 as the necessary number of pools (as reported in the text and in Table 3).
The desired degree of certainty can be used in the function by specifying the certainty, which is an optional argument in the ss.gmo.aipe() function. The function would thus be specified as:

This returns the required number of pools, 168 (as reported in the text and in Table 3), that provides 99% assurance that the obtained CIW for p will be no wider than 0.006 units.



