

“Any visible phenomenon is an idea of the world”Footnote 1
Pierre Escot, Planning.Space projects represent, after World War II, the paragon in matrix management of scientific practices that are flexible, temporary, and oriented towards specific goals. The allocation of skills, the management of technical means, and the coordination of various institutions (e.g. laboratories, private sector businesses, government agencies) are achieved through a new form of activity, the project, which is itself modeled by company rules, i.e. those of management. The aim of this article is to present the origins and deployment of the Franco-Soviet space program ARCAD 3 and reveal the fundamental principles of project management underlying it. It focuses more specifically on the diagrams, organization charts and schedules produced throughout the entire project to orient, plan, and frame scientific practices. This socio-history of project management is based on three historiographical dimensions which will be compared: scientific writings, links between initiative and graphic forms, and Big Science. First, the fundamental principles of these three dimensions will be defined in the introduction before examining the problematic conditions of their alliance.
Scientific writings are now a traditional theme in Science and Technology Studies (STS). Laboratory ethnographies, rooted in the indicial paradigm described by Carlo Ginzburg (Ginzburg Reference Ginzburg1987), have inventoried the traces, inscriptions, texts and media that frame the daily life of scientists. They have mapped out the circulation of signs and their formats. Bruno Latour and Steve Woolgar were the first to insist on the literary inscriptions (e.g. articles, diagrams, curves, notes, notebooks, rough drafts) that regulate “life in the lab,” organize the discussions of researchers, and orient their actions (Latour and Woolgar Reference Latour and Woolgar1996). From this standpoint, inscriptions must have certain characteristics to produce their effects: the robustness of the facts they construct and the theories they deploy are measured by their mobility, persistence, and capacity for adaptation (Latour Reference Latour1985, 10; Latour Reference Latour1995, 59–151). Questions concerning writings have gradually spread to the territory of representations and their philosophical foundations. A special edition of Human Studies in 1988 devoted to practices of representation in science provides an overview of laboratory studies focused on the empirical and theoretical variations of resemblances, references, symbolisms, similarities, abstractions, and exemplifications in all written scientific production (Lynch and Woolgar Reference Lynch and Woolgar1988, 100). However, these philosophical roots do not exclude sociological investigation of representations as an indication of the organization of scientific work (ibid., 104). Scientific writings are treated here in their heterogeneity and broad variety. This said, they are open to criticism, the argument being that reducing scientific activities to their traces and signs offers a “semiologic vision of the world” – or a “textist” one – where social relationships are absent or limited to simple tactical choices (i.e. publication of results, general agreement on results) (Bourdieu Reference Bourdieu2001, 59). Specific studies on the material practices of reproducing texts (Eisenstein Reference Eisenstein1991), secrecy and publication of scholarly works (Long Reference Long2001), the emergence of the modern form of the article (Bazerman Reference Bazerman1988), the graphic organization of administrations (Charvolin Reference Charvolin2003), the scientific signature (Biagioli and Galison Reference Biagioli and Galison2003; Pontille Reference Pontille2004), the genetics of scientific writing (Barberousse and Pinon, Reference Barberousse and Pinon2003) or the specification of scientific texts (Berthelot Reference Berthelot2003) have traced the field lines in the differential poles and the autonomous zones in the magma of scientific inscriptions. Not all writings are on the same plane; they do not aim to achieve the same effects; their production, reception circulation, rejection, or limited visibility should be redeployed in specific spaces and social and political contexts that are historically and geographically situated. In order to avoid the pitfalls of textism (or more precisely here, graphism) we must take care not to separate writings from the actions they cement, map, incite, or prohibit.
Links between graphic forms and action have been explored by the anthropologist Jack Goody. The standardization and regulatory practices of societies have developed in the West in the form of writings (e.g. laws) (Goody Reference Goody1986, 174). Above all, graphic repertoires shape and affect ways of doing things and thinking. They have caused deep cognitive shifts, significant transformations in organization methods, and major changes in the ways activities are coordinated (Goody Reference Goody1979, 149). This focus on reciprocal evolutions in written formats and ways of doing has been prolonged in the elements of sociological pragmatics developed in particular by Nicolas Dodier and Laurent Thévenot. The conventional foundations of action described by the former have become resources (material or cognitive) that orient collective action (Dodier Reference Dodier1993). They form the link between a temporal horizon and the necessary coordination of players. Whether they are memorized, engrammed, incorporated, or endured by individuals or objects, these conventional foundations enable transition from one system of action, i.e. local and contextualized models of action, to another. In this way, they offer a response to the inevitable heterogeneity of these systems. The notion of appropriate action proposed by Laurent Thévenot is oriented more towards coordination as a cycle of actions linked together (Thévenot Reference Thévenot1990). From this standpoint, the sequencing and succession of actions are based on a recurring judgment of their relevance. Coordination of actions is never definitively acquired. It can be redefined, requalified, shifted, or modified at each critical test (ibid., 50). These theoretical resources, which will be used to examine the graphic tools regulating the ARCAD 3 project, have rarely been used by historians and sociologists in the field of project management, although they also explore the links between written formats and action.
Graphic tools constitute the backbone of management. JoAnne Yates has highlighted, for the end of the nineteenth and beginning of the twentieth century, the specificities of internal business communications. She emphasizes in particular that management and writing technologies are constantly influencing each other (Yates Reference Yates1993, xviii). The transition at the beginning of the twentieth century from ad hoc management, which allowed staff some room for initiative, to a management style systematically founded on increased control of exchanges within the firm is moderated by the emergence of specific business literature (i.e. in-house newsletters). JoAnne Yates insists on the massive mobilization of documentation in various forms designed to control the actions of each employee: specific graphic tools articulating the state of the situation, forecasted actions and expected results, such as the Gantt chart, have taken hold as managerial instruments organizing work and social relations (ibid., 85–88). The recent work of Geoffrey C. Bowker and Susan Leigh Star on classifications as management tools ties in with and extends the work of JoAnne Yates. The process of classification, as a means of organizing actions in a maternity ward, is based on three axes: comparison (particularly between sites), visibility (tasks that are not easily identified can be emphasized), and control (Bowker and Star Reference Bowker and Star2000, 231–232). The goal of managers is to modulate each of these axes to obtain the best fit between staff and the tasks that need to be accomplished in a maternity ward. Above all, Bowker and Star emphasize that the creation of classifications by management is never neutral and always reflects a moral code and a specific distribution and balance of power (ibid., 240, 253). Lucy Suchman, on the other hand, insists on the way managerial tools, introduced as instruments of work, manage to make actions, tasks, objects or relationships more visible. This capacity to make visible artifacts or tasks is, in itself, an important power, especially since this unveiling serves as the basis for discussions and negotiations (Suchman Reference Suchman1995, 63). The important point of these studies is that graphic tools generated by management form the foundations of a distribution of power through their capacity to render certain actions, players and relationships visible (Vaughan Reference Vaughan1999, 934).
The massification of science (from a technical, organizational, and cognitive standpoint) in the period after WWII has been described, since the 1960s, starting with the category of Big Science (Solla Price Reference Solla Price1963; Galison Reference Galison1997). The theme of Big Science, which has not been widely explored until the early 90s, no longer enjoys currency today. Thus, in Image and Logic, published in 1997, Peter Galison nuances the descriptive power of the notion of big physics. He highlights the multiple usages of large instruments and the fact that the massive size of experiments and the mobilization of gigantic facilities do not lead to the disappearance of micro-arrangements and micro-coordination between engineers and physicists, far from it. Synchronization of actions and highly refined allocation of skills enable the reintroduction of concrete foundations for historical analysis (Galison Reference Galison1997, 559). In a recent article, Paul Forman shares Galison's skepticism concerning the expression Big Science and proposes focusing analyses on the evolution and diversity of arrangements between science and technology (Forman Reference Forman2007, 4). Several approaches have been outlined elsewhere in order to think back to the period before the massification of science during the second half of the twentieth century. James Capshew and Karen Rader have, in an overview published in 1992, envisaged focusing research on large scientific facilities and questioning the historic process of expanding the practices, instruments, and teams involved. Therefore, this no longer means questioning Big Science in and of itself, but retracing the gradual formation of a massive technical, organizational and cognitive system (Capshew and Rader Reference Capshew and Rader1992). The accent is therefore placed on the construction of large-scale institutional, technological, and scientific entities, but above all it is the procedures for coordinating human groups and material resources that are analyzed (ibid., 23). From this standpoint, the work of Martin Parker highlights the importance of the Apollo program as an open air laboratory for a new managerial method for organizing science on a large scale (Parker Reference Parker2009). The work of Dominique Pestre on science during the Cold War converges with these investigations on the organization modes of researchers, technicians, engineers, and administrative staff. He underlines the emergence, in the United States, of a new scientific culture combining a concern with acting swiftly and the search for practical solutions. These procedures, which had been gradually constructed and stabilized during WWII, were generalized as of the 1950s through exchanges between military personnel, scientists, managers, engineers and industrialists (Pestre Reference Pestre1992a and b; Pestre Reference Pestre, Dahan and Pestre2004, 13–14). Specific managerial tools (organization charts, schedules) took root in large physics laboratories (Galison Reference Galison1997, 593–609) and in space research (Johnson Reference Johnson2006).Footnote 2 These graphic materials for organizing and coordinating the practice of science spread to most western countries as of the 1960s.
This proposed study of the Franco-Soviet space program ARCAD 3 is situated at the junction of the three historiographical fields described above. First, we will show how the project form, as a matrix organization tool in space research, developed in France starting in the 70s. Here this means grasping the massive growth of companies and instruments commensurate with managerial principles imported from the United States in a context still marked by the American government's policy of “consensual hegemony” over French science immediately after the war (Krige Reference Krige2006). Then we will examine a series of documents (diagrams, schedules, and organization charts) that punctuated the preparation, implementation, launch, and exploitation of experiments within the ARCAD 3 project, focused on the study of auroral phenomena by French and Soviet laboratories. We will analyze these writings by examining in detail the acts they prescribe and the relationships they encourage. To what extent do these organization charts and schedules constitute practical tools or instruments for action? By concentrating on the analysis of these managerial tools, their uses and circulation, we propose to investigate and shed light on the supposed or expected rationalities of the players. At the junction of questions on international cooperation involving Big Science in space and the sociology of graphic forms, we will examine how we can represent the Franco-Soviet agreements, of which ARCAD 3 is a product, at the end of the 1970s. Interactions, exchanges, but also understatements and secrets, constitute the elements of a geo-graphic grammar of international relations. The introduction of a common calculator for the different French experiments offers an unusual glimpse of the mechanism for schematizing spaceborne instruments. A satellite launch relies on coordinated management of all the players and of time. Three sets of organization charts and schedules will allow us to understand the project before implementation, during its execution, and after its launch. To conclude, we propose a general interpretation of this graphic managerial policy by discussing, after Michel Foucault and Gilles Deleuze, contemporary mechanisms used to control actions and actors.
An archaeology of project management
World War II changed the place and organization of scientific practices. The war caused the emergence of “a culture of permanent urgency and mobilization” (Pestre Reference Pestre, Dahan and Pestre2004, 12). The deployment of new technical and organizational means aimed to produce concrete, practical results that could be swiftly applied. The Manhattan Project at Los Alamos was the paragon of this new way of doing science: in response to the massive size of technologies, instruments and covert cognitive fields, an even greater complexity of organization modes and structuring of research developed (Hughes Reference Hughes2002; Boutinet Reference Boutinet1990, 221). This reconfiguration of science has durably affected western states, which from then on built their economic and geopolitical strategies on research sectors strongly marked by a war culture. Space and nuclear power formed the first fields sized, after the war, in Big Science formats, which invented new ways of working and conceiving of scientific practices. The organizational tools deployed by American space research in the 1950s abandon the TayloristFootnote 3 style of managing mainstream science between WWI and WWII (Cohen Reference Cohen, Krige and Pestre2003) and converge to gradually form a particular representation of this activity: the project. By following the definition of Jean-Pierre Boutinet, we can envisage project management as “an attempt to combine human resources and technical parameters, which are associated within the same group, inside a ‘temporary’ organization to achieve a specific purpose” (Boutinet Reference Boutinet1990, 224). The project designates both an objective and a “matrix structure” capable of producing its own rules of operation, constructing its specific hierarchies and developing its own temporal logics (Boutinet Reference Boutinet2004, 142–146; Boutinet Reference Boutinet1990, 230–231). The old organizational form (Graber Reference Graber2007 and Reference Garel2009) articulating the project was updated, after WWII, through a codified management system. The organization modes and coordination of work defined by Taylorism at the end of the nineteenth century were revamped and modified in the 1920s (Yates Reference Yates1993). After 1945, the theoretical corpus on management became more substantial and diversified (Waring Reference Waring1991). Luc Boltanski and Eve Chiapello have pointed out, in the emergence of what they refer to as the “projective city,” the transformation of capitalism into its neoliberal version after WWII. The gradual abandonment of bureaucratic hierarchies handed down from Fordism and the adoption of a decentralized and autonomous organization of work first targeted the sphere of commercial activities. Management, envisaged as “continuous sophistication of the means of controlling what goes on in the firm” implemented sufficiently varied systems to frame activities so as to cover and concern all the staff (Boltanski and Chiapello Reference Boltanski and Chiapello1999, 124–125). In addition to the performance in a given time of a clearly identified task, management through projects aims to control and/or reduce areas of uncertainty (Crozier and Friedberg Reference Crozier and Friedberg1977, 71–72). The project is therefore founded on a teleological view connected to an original organizational positioning. It is not centered on a firm, an agency of means, or a particular laboratory. Its presence is transversal and not linked to a specific material site (Boutinet Reference Boutinet2004, 143). Similarly, the agents it gathers within a flexible coalition continue to work in their original organization.
The emergence of the project as a specific way of organizing work around precise tasks, oriented towards a goal defined in advance, limited in time, and indexed on a budget, was accompanied by a study of concrete organization methods. Richard Whitley (Reference Whitley1984), using the work of Henry Mintzberg (Reference Mintzberg1982), described the organizational form of the scientific project as an adhocracy, i.e. a structure sufficiently flexible and elastic to produce knowledge in a context of great technical and strategic uncertainty. Project management was therefore instituted, starting in the 1950s, particularly in American aerospace firms and space research (Mee Reference Mee1964), as a form of social engineering, deploying practical tools for solving large-scale technical-scientific problems and defining an appropriate rationality for each player involved (Garel Reference Garel2003, 32). The specificity of the project, as it emerged in the United States in space research after WWII, is to disregard vertical hierarchies in favor of a horizontal management characterized by greater leeway for the different players.
NASA strived, at the beginning of the 60s, to solve the organizational problems involved in the implementation of space missions: the variety of players, the relatively ephemeral nature of coalitions, the links with industry, and the simultaneity of projects are all obstacles to the success of the operation. The administrators of the American space agency therefore commissioned a study from McKinsey & Cor in February 1960 in order to make restructuring proposals. The audit invited the agency to adopt a “project management policy . . . used extensively by industry and private laboratories” (Rosholt Reference Rosholt1966, 157). This meant reshaping the contours of NASA by adopting the principle of teams made up of engineers, researchers, technicians, and administrative staff, periodically assembled to work together on a precise project with a predetermined deadline. These recommendations, supported by the Kimpton Committee, were followed by NASA's management. James Webb, administrator of NASA from 1961 to 1968, became an ardent defender of project management, to the point of making it the sole operating mode used to run large space programs (Webb Reference Webb and David1970). While focusing exclusively on managerial tools tends to oversimplify NASA's evolution during the 1960s (Horwitch Reference Horwitch1987, 55–56), the fact remains that the move to project management constitutes a major turning point in the history of large-scale scientific undertakings. A large corpus of managerial literature documents the structural transformation of the organization of work. General overviews (Anthony Reference Anthony1965; Kerzner Reference Kerzner1979), management and economic analyses (Archibald Reference Archibald1976; Vardaman and Halterman Reference Vardaman and Halterman1968; Galbraith Reference Galbraith1971) or assessments of past experiments of large projects (Sayles and Chandler Reference Sayles and Chandler1971) define the limits, first in the United States and then soon afterwards in France through translations (e.g. Cleland and King Reference Cleland and King1971; Declerck et al. Reference Declerck, Eymery and Crener1980; Wille et al. Reference Wille, Gewald and Weber1971), of an editorial field in which studies in the space sector are cited as examples. Gradually, the coalescence of empirical managerial experiments, conducted above all in the United States, provided the main components of a standard model of project management. In France, a “management industry” started to organize in the 1950s around specialized consultancies, schools, seminars, or university degree programs (Boltanski Reference Boltanski1982, 187–190).Footnote 4 Mainly designed for managers, this training very closely followed management trends developed in the United States. “Productivity programs,” initiated by the OEEC at the end of the 1940s, institutionalized the flow of exchanges, enabling the arrival of 2,700 managers, employees, and workers from across the Atlantic. These programs aimed to highlight productivity and American management techniques so that they could rapidly take root in Europe (Bouchard Reference Bouchard2008, 208–211). Therefore, the concept of the project in space research appeared in France in an industrial and management environment characterized by a keen awareness of changing organization methods and working conditions. Above all, the creation of a French space agency, the Centre Nationale d'Etudes Spatiales (CNES), in 1961 and a small number of research laboratories focused on space provided the organizational matrix for French space projects. The CNES is an agency responsible for means which, according to the decree behind its creation, must not produce scientific studies. It has organized and developed many space exploration projects using stratospheric balloons, rockets, and satellites. It has set up selection and monitoring procedures for these projects. It has also developed special management practices to work within this new organizational model.
Ivan Chvidchenko, in charge of the budget-plan division at the CNES during the late 1960s and early 1970s, was the first to borrow key project management tools from NASA manuals (Chvidchenko Reference Chvidchenko1974, 178). He also was inspired by the work of Octave Gélinier, one of the most active relays of managerial procedures from the United States in France (Gélinier Reference Gelinier1967; Boltanski Reference Boltanski1982, 198). He perceived the need for space research to “develop . . . new ways of conceiving and conducting the organization and managing of programs” (Chvidchenko Reference Chvidchenko1974, 3). In 1970 he organized a colloquium in Toulouse to assess and harmonize the methods and managerial practices used in large-scale space projects. The confrontation of different points of view was mainly intended to inform the CNES, European space agencies and “above all industry” (Chvidchenko Reference Chvidchenko and Chvidchenko1971, xvii). Shortly afterwards, Chvidchenko wrote an overview of large-scale project management (Chvidchenko Reference Chvidchenko1974) and tried to spread norms and managerial standards to all space-related activities. While the director of the budget-plan division was a pioneer, inside the CNES interest in managerial innovations at NASA would continue to intensify throughout the 1970s.Footnote 5
Space organizations in France and the USSR
In France, the CNES is the public organization, under the Ministry of Research, in charge of coordinating civilian space activities. The CNES is not, according to its statutes, a research organization. It orients work,Footnote 6 selects projects, and provides technical and intellectual resources. It has also established, starting in 1965, a list of existing laboratories with which it intends to develop specific long-term joint projects: Service d'Aéronomie, Service Spatial de l'Observatoire de Paris, Groupe de Recherches Ionosphériques, Laboratoire d'Astrophysique de Marseille, Centre d'Étude Spatiale des Rayonnements, Service d'Électronique Physique du Commissariat à l'Énergie Atomique. Footnote 7 On the Soviet side, space research in the 1970s was part of a vast bureaucratic structure with a rigid hierarchy, operating under the strict control of the Communist Party. The Central Committee ran, at the same time, military and space activities. The porosity between civil and military domains explains, at least in part, the obsession with secrecy and confidentiality that characterized Soviet space research (Tarensko Reference Tarasenko1994, 342). All space programs, as Maxim V. Tarensko points out, fell under the supervision of the Ministry for General Building Machine (MOM), a sufficiently nebulous title designed to protect the secret intentions of the Soviet government (ibid., 361). Created under Leonid Brezhnev, the MOM coordinated all space activities “from applied research to manufacturing” (Verger et al. Reference Verger, Sourbès-Verger and Ghirardi2003, 74). Scientific missions were conducted by the IKI (Russian Space Research Institute), under the responsibility of the Academy of Sciences (Packwood Reference Packwood1982, 322). It supervised the scientific instrumentation while the MOM provided the vehicles and the means of integration. This structure was completed by Interkosmos, the “collaborative space research organization of the Comecon countries” (Downing Reference Downing1985, 466). Joint projects conducted with foreign non-communist states were also organized by Interkosmos.
This article essentially concerns the production and reception of organization charts and schedules by the French institutions. The difficulties involved in consulting Russian archives explain this choice. However, it is important to provide a basic presentation of Soviet space management in the 1970s. This does not mean comparing its history with France, but rather outlining the conditions of an exchange between scientists from both nations. The Soviets paid careful attention to management methods,Footnote 8 notably in the field of space. The Saratov system, developed in the 1960s, is very similar to the zero-defect system used by the Americans. It involves a form of quality control “lodged ultimately with the individual worker.” The general philosophy behind this organization lies in recognizing the specific skills of each participant and the creation of a robust chain of assumed responsibilities (Campbell Reference Campbell1972, 591). More specifically, the use of a graphic system similar to the one developed by the Americans, the PERT model (Program Evaluation and Review Technique), which we will discuss in more detail later, exemplifies a certain parallelism between East and West in the deployment of management methods.Footnote 9 The Soviet SPU, meaning “network, planning, and control,” tended to spread throughout the administration, well beyond the field of space. It is a management method designed to rationalize project resources, tasks, and objectives.
Organization of the ARCAD 3 project and the geopolitics of secrecy
ARCAD 3 is only one project in a long line of Franco-Soviet agreements. General de Gaulle wanted to extricate France from the bipolarization of the Cold War era and initiated agreements with both the USSR and the United States. General de Gaulle, who had been president of France since 1958, attempted to conduct an international policy that served as a counterpoint to post-war polarization. To this end, he tried, starting in the 1960s, to balance relations between France and the USSR and, at the same time, maintain a certain distance from the United States. It is in this context that, in 1965, a meeting was organized with the Soviet Minister for Foreign Affairs. Moscow was preoccupied with finding allies in Western Europe. The French and Russian positions converged, notably on the issue of Vietnam and rejection of American imperialism (Rey Reference Rey1991, 37). Exchanges intensified, but the Soviets limited the discussions to scientific and technical issues until the 1965 presidential elections. During this period, General de Gaulle, who was eventually re-elected, made a spectacular move by pulling France out of NATO. France left the joint command in February 1966 (Vaïsse Reference Vaïsse1995, 77). For the French president, this decision was the result of a firm desire for national independence. At the same time, French and Soviet ties grew stronger. De Gaulle visited the USSR from June 20th to July 1st 1996. Common ground was defined and “the two countries agreed to consult each other on a regular basis on major international issues” (Rey Reference Rey1991, 46). More importantly, scientific and technical cooperation was the object of an agreement signed on June 30th 1966. It defined a “flexible framework,” opening the way for more important exchanges on “studies of space . . ., space meteorology and telecommunications” (ibid., 47).
It should be noted that the CNES was established within a set of French scientific institutions that had undergone profound changes after the war. A real “national science policy” had been launched during the Fourth Republic and intensified during the Fifth Republic (Gilpin Reference Gilpin1970, 156; Chatriot and Duclert Reference Chatriot and Duclert2006). Deeply embedded in the State bureaucracy and conducted within the context of a centralized plan, the French scientific organization was a complex structure, characterized by a rigid hierarchy (Gilpin Reference Gilpin1970, 252–253). The Cold War and the quest for national independence contributed a great deal to this movement and the modernization of French research (Ramunni Reference Ramunni1992).
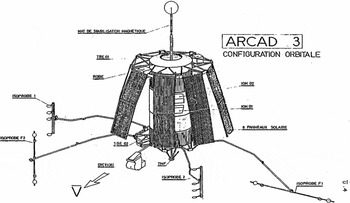
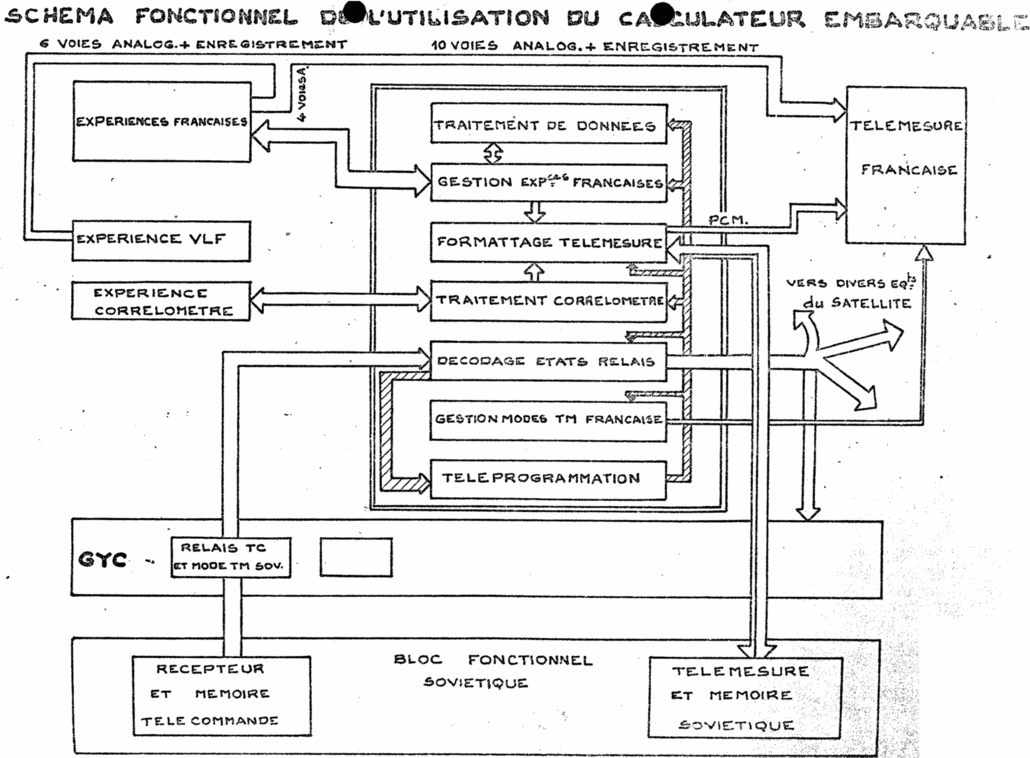
The first joint project, centered on the ROSEAU satellite (Radio Observation par Satellite Excentrique à Automatisme Unique) was not completed due to significant financial problems. However, this setback did not bring an end to exchanges or joint projects. One CNES internal memo, dated May 1971, shows the agency administrators’ concern with “maintaining a certain level of cooperation with the USSR”Footnote 10 in order to diversify space research. At the beginning of the 1970s, another important project started: ARCAD (ARC Auroral Density). It involved studying auroral phenomena with a satellite. The equipment deployed focused on charged particles at very high altitudes. The goal was to produce a theoretical model of electric fields in the magnetosphere. The first satellite was launched in the USSR in December 1971, followed by a second one (ARCAD 2) in December 1973. These first joint projects seem to have satisfied French researchers who, in 1974, praised the “cooperative work of teams separated by thousands of kilometers and different ways of thinking and expressing their ideas.”Footnote 11 They saw at that point that there was set of common guidelines between French and Soviet researchers and thought they could tackle more ambitious projects. Bilateral discussions at the end of 1974 resulted in an agreement on the principle of an exchange trip to Moscow in February 1975. Officially, the project was scheduled to start on June 25th 1976.Footnote 12 The general goals were to “better understand Sun-Earth relations”Footnote 13 and to conduct “a study of the system composed of ionized plasma . . . and electrostatic and electromagnetic waves”Footnote 14 in the magnetosphere. The satellite (christened AUREOL-3) and its onboard instruments could capture interaction phenomena that develop at the juncture of the ionosphere and magnetosphere. The French laboratories proposed three experiments, while the Soviets set up four, and researchers from both countries conducted three joint experiments. The CRPE in Orléans proposed the Isoprobe experiment based on mutual impedance probes, an instrument developed by Christian Béghin at the end of the 1960s (Béghin Reference Béghin1970). These probes form a “multipolar system of sensors, each considered as an isolated contact in the magnetoplasma, some of which are connected to an AC generator and others to an electrostatic receiver.”Footnote 15 The device can be used to measure electronic density, temperature, and local ionic compositions (Béghin, Berthelier, and Simon Reference Béghin, Berthelier and Simon2008, 300). The LGE at Saint-Maur implanted the Dyction experiment (DYnamique, Composition et Température IONique) centered on the study of thermal plasma. This meant “analyzing the response of the ionosphere to magnetospheric phenomena.”Footnote 16 All phenomena concerning particle transfer and coupling mechanisms between the two layers of the atmosphere (ionosphere and magnetosphere) are examined measuring the temperature and speed of certain ions. The CESR in Toulouse developed the Spectro experiment, consisting of five proton, electron, and ion spectrometers. In addition to a better understanding of the causes of aurora borealis, the objective was to identify the origin of the particles that compose them (solar winds or the ionosphere), the links between electric and magnetic fields as well as the “physical processes that produce the dissemination and precipitation of particles.”Footnote 17 The IKI in Moscow integrated four experiments in the satellite (Kukusha, Pieschanka, Fon, Altaïr) designed to measure flows of electrons and positive ions within a certain energy range (40 ev-280 keV). Four electrostatic analyzers, five spectrometers and two Geiger counters made up the instrumental architecture of the Soviet experiments (Khmyrov, Kavelin, Popel, Lyssenko, Pollusksov, Varyvdin, Rodin, and Ovsyanikov Reference Khmyrov, Kavelin, Popel, Lyssenko, Pollusksov, Varyvdin, Rodin and Ovsyanikov1982, 548). The Correlation meter instruments, developed jointly by the IKI, CESR, TBF, established by the CRPE, LGE, IZMIRAN and IKI, and the Trac magnetometer, developed by the CRPE and IKI, concerned the flow and distribution of ions and electrons of the ionosphere, the magnetic and electric components of waves, as well as disturbances in the geomagnetic field (ibid.). These different experiments, placed on the satellite, were connected to electronic systems enabling the transmission of data and measurements (fig. 1).
CNES Archives, Revue de définition ARCAD 3, T. I, Toulouse, 29 avril 1977: II-4, ARCAD 3, Configuration orbitale.

The main goal of ARCAD 3 was to measure the study “of the coupling between the ionosphere and the magnetosphere” by analyzing the dissipation of the solar wind's energy, the origins of the auroral particles’ acceleration mechanism, the population of magnetospheric ions, and “wave particle interactions” (Galperin et al., Reference Galperin, Reme, Béghin, Berthelier and Bosquet1982, 544). The scientific data transmitted by satellite “may be transmitted by two telemetry systems . . . a Soviet digital stored telemetry system (TMS) . . . [and] a wide-band analog/digital French telemetry system (TMF)” (Hameury et al., Reference Hameury, Chene, Lamboley, Lyseenko and Massay1982, 563). The French equipment was installed at three stations run by the Soviet Academy of Sciences (Balebanov et al., Reference Balebanov, Galperin, Lavrussevich, Minaev, Skorodumov, Beljaev, Goljavin, Mogilevsky, Pjankov, Sobolev, Dee, Galakhov, Jurov and Perlikov1982, 697). The CNES received the recorded data, in the form of a “magnetic tape” from two distinct sources: “the Soviet Union and the network of telemetry stations under CNES control” (Charles et al., Reference Charles, Dupic, Ferreol, Fournier, Kosik, Maslov, Monchy, Porkras and Viltchinskaia1982, 717). Cooperation between the two countries therefore translated into a relatively transparent data circuit. However, we can note pronounced reservations among the Soviets on certain specific points. Thus, an article, published in the Annales de Géophysique in 1982, about “reception and recording facilities of the French wide-band telemetry from the Aureaol-3 satellite for the Soviet ground station” is only signed by the Soviet researchers (Balebanov et al., Reference Balebanov, Galperin, Lavrussevich, Minaev, Skorodumov, Beljaev, Goljavin, Mogilevsky, Pjankov, Sobolev, Dee, Galakhov, Jurov and Perlikov1982, 697).
The organizational structure of the project was complex and based on two main interfaces: on the one hand, the link between scientists in the different French laboratories involved and the CNES; and, on the other hand, the link between the French part (i.e. CNES and the laboratories) with the Soviets (i.e. professor Galperin's team and the Russian space agency Intercosmos). Three CNRS labs took part in ARCAD 3: the CRPE (Centre de Recherches en Physique de l'Environnement Terrestre et Planétaire) in Orléans, the LGE (Laboratoire de Géophysique Externe) in Saint-Maur des Fossés and the CESR (Centre d'Etude Spatiale des Rayonnements) in Toulouse. Each French lab developed an experiment. Five manipulations were performed directly by the Russians and two were co-designed by French and Russian teams. The French laboratories organized an informal structure called the “coordination group.” It included people responsible for ARCAD 3 in each laboratory as well as representatives from the CNES (in particular the project manager G. Hameury). The purpose of the group, led by a CESR researcher, Henri Reme, was to harmonize their positions in relation to both the CNES and the Soviets. Its discussions focused on scientific questions at every stage of the project: preparation of experiments, definition and cohabitation of instruments, data processing.Footnote 18 Gaining a mutual understanding of how each laboratory worked constituted a preliminary phase before distribution of actual tasks. Researchers were therefore asked to provide a “rather detailed description . . . [of the] operating procedures”Footnote 19 within their scientific organizations.
The CNES played a central role in the development of space projects. It designated a project manager, G. Hameury, and corresponded with the space agency and the Russian scientists. Above all, the organizational structure of the CNES was oriented by the desire to provide permanent support for research laboratories throughout the project. The Astronomy and Geophysics departments of the French space agency were “in charge of . . . problems concerning the loads or experiments taken on individually from the beginning” until the final results were processed. They checked the “proposals made by scientists,” particularly the definition of the experiments envisaged, their feasibility, interest and cost.Footnote 20 In the context of ARCAD 3, CNES activities – implemented by the project manager, G. Hameury – were centered on general technical studies, interfaces with the Soviet teams in charge of the satellite, industrial creations, as well as integration of the payload.Footnote 21 Therefore, the CNES was much more than a contact that French laboratories could consult to adapt their experiments to the material possibilities of the satellite. The appointment of a project manager, definition of a broad field of competency, and involvement in the scientific coordination group provided it with an overview and a transversal hold on the entire project.
The main feature of ARCAD 3 was the creation of a Franco-Soviet research conglomerate. While previous joint studies had enabled reciprocal acculturation, ARCAD 3 required a narrower distribution of tasks and more meaningful exchanges, notably due to several experiments co-designed by French and Russian researchers. When the project was actually deployed, the engineers and administrators of the CNES identified four sets of difficulties for ARCAD 3.
The first concerned clarification work with the French labs on the development of experiments as well as the scheduling of operations once the satellite was launched (i.e. data transmission and trajectory control). This meant, as indicated in an internal memo dated November 22nd 1978, “defining a common and clear position”Footnote 22 in order to present a coherent and harmonized version of the project to the Soviets.
The second difficulty for CNES personnel involved in ARCAD 3 was complying, and making others comply, with the deadlines for different phases (i.e. development and testing of experiments, the calculator and telemetry, integration of the different experiments). Coordinating with the Soviets on this point was problematic. A memo transmitted to the CESR in February 1979 illustrates the concerns of CNES engineers about “the progress made on certain scientific experiments.” Moreover, it specifies “that the CNES does not envisage further negotiations with the Soviet team on the dates of integration and launch in the USSR.”Footnote 23 By acting on the strategy to adopt in working with the Soviets and maintaining a strict schedule for experiments, the managers of the ARCAD 3 project within the CNES defined a general framework for the scientists work.
Suspicions among CNES agents and French researchers involved in the project concerning the precision and reliability of Soviet equipment constituted a third difficulty. CNES managers realized, in 1977, that the Soviets were incapable of providing a restitution of the satellite's attitude within one degree. Therefore, it was the French team who designed “a sensor” that was efficient enough to protect the ARCAD 3 experiments from damage.Footnote 24
The fourth difficulty CNES engineers and administrators had to overcome concerned the security measures and secrecy surrounding all Soviet space equipment. In 1977, managers of the ARCAD 3 project within the CNES observed that “the structure of the satellite and standard Soviet control systems are produced in a SOVIET FACTORY at an unknown location. The location of the launch site has not been divulged and data on the launch vehicle . . . is limited to the information required to understand atmospheric conditions during the launch.”Footnote 25 This situation meant more preparation for the mounting and assembly phases of the French satellite experiments. The French researchers, engineers, and technicians worked in the dark and had to deal with limited functional tests since they could not, in theory, be present.Footnote 26
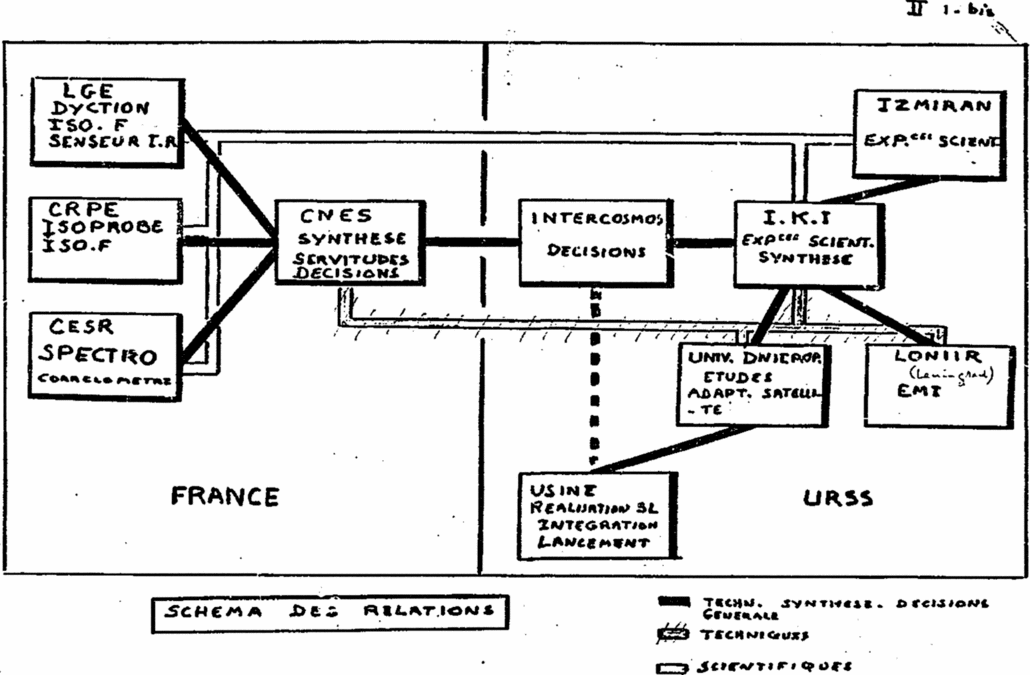
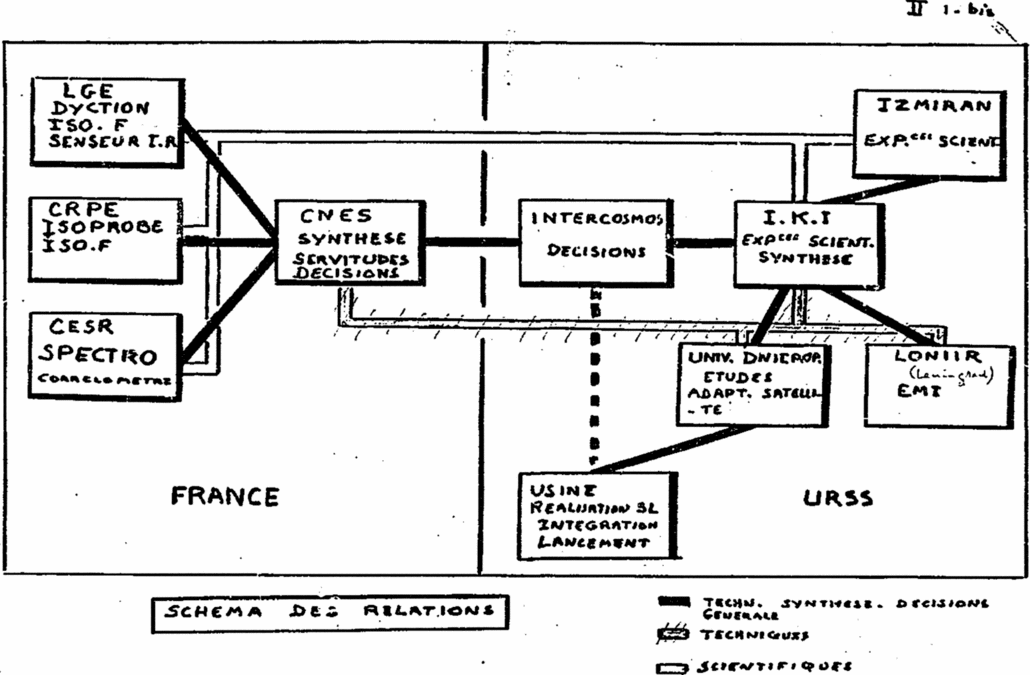
A general diagram, inserted in the first volume of the definition review of the project published in April 1977, explains (in part) how the CNES envisaged the general architecture of networks between the French and Soviet organizations. This first diagram presents a very general vision of the project: it is the project before the project, the global field lines of ARCAD 3 drawn before and for its concrete deployment.
The project definition review was co-written by the French laboratories involved in ARCAD 3 (i.e. CESR, CRPE and LGE) and the CNES. However, while all the laboratories are cited as having taken part in writing the document, only CNES personnel are mentioned by name.Footnote 27 The diagram (fig. 2) defines the role of each group of players (i.e. representatives of laboratories and agencies) involved in the developing experiments and launching the satellite.Footnote 28 Coordination between French and Soviet entities is represented by the unfilled hollow line. The CNES centralizes, for technical questions and general decisions, links with the French laboratories. The latter are mentioned by name, as well the titles of the experiments they are responsible for: this effort at stabilization tries to pour the project (which is flexible and temporary) into the mold of fixed and permanent institutions. More complex in nature, the Soviet part is organized around the IKI (Russian Space Research Institute), which has links with the Soviet laboratory IZMIRAN, in charge of part of the experiments, and the units responsible for technical questions. Final decisions are made by Intercosmos, the Russian equivalent of the CNES. The former is directly associated with Soviet technical institutes. Finally, the French laboratories can interact with the IZMIRAN and IKI. This diagram makes the distinction between technical, scientific, and decisional relationships. Some interactions are not mentioned (leaving us to wonder whether they occurred or not) and the decisional path is simplified as much as possible for the French part. Above all, the laboratories are excluded from the technical field. This diagram defines the relationships and frames the types of possible actions in building the satellite (by indicating them with solid or hollowed out lines). It integrates the geopolitical complexity of the project by prohibiting superfluous links and simplifying the decision-making process, which is finally reduced to an interconnection between the CNES and Intercosmos. The diagram does not detail the tasks to be performed, but it defines lists of authorized actions and envisages a network of relations. The grey zones and uncertainty that forced the CNES and laboratories to work with Soviet geopolitics of secrecy persist in this graphic representation. The rectangle representing “the factory” at which the launches took place has no name and is not attached to an organization. A dotted line links it to Intercosmos, showing a relationship that does not appear in the diagram's key. This graphic hesitation translates the fuzziness the space agency and laboratories had to deal with. The diagram relates (at least partially) Soviet opacity concerning procedures surrounding the assembly and launch of the satellite, as well as the coherency of the French part grouped around the CNES. The fact that French laboratories were obliged to go through the CNES for any questions (scientific or technical) illustrates the French space agency's efforts at purification and simplification in the organization of ARCAD 3. This simplification was obtained through partial omission of the difficulties encountered by the French: the inaccuracy of the Russian equipment and project deadlines do not appear in the diagram. The graphic representation of the Franco-Soviet arrangement therefore focuses on only a few of the problems in the relationship. It cannot embrace all the constraints and obligations weighing on each of the participants.
CNES Archives, Schéma des organisations, Revue de définition ARCAD 3, T. I, 29 avril 1977: II-1-bis.
Organizing and planning: graphic modulations
Among the graphic tools governing laboratory activities, organization charts and schedules play a central role. They circulate between administrators and technicians, engineers and scientists. We will examine the composition of three organization charts and three schedules, all different in their form and in the actions they describe, which correspond to different stages in ARCAD 3. The goal is to identify stable components in the graphic grammar of project management while paying careful attention to situational requirements and contingencies.
Space projects are special work structures due to their ephemeral and transversal qualities. They bring together researchers, engineers, technicians, and administrative staff from stable and permanent organizations (space agencies and laboratories). Project management generates organization charts that summarize on paper the positions of the different players (collective and/or individual) and plan their interactions. Borrowed from the traditional corpus of Taylorist bureaucracy, the organization chart is an ambiguous picture of management, decried for its rigidity and used nonetheless due to its capacity to define (at least temporarily) the place of multiple players who are only somewhat organized. In their canonical work, published in France in 1971, on “systems analysis” and “advanced management technique,” David Cleland and William King recognized that “plans established for the organization of a project should include a certain type of formalized structure if the collective action is to provide results. The formal structure reflected in an organization chart, as static and unrepresentative as it may be of the way operations are conducted, remains valuable in that it defines the relationships between the individuals and the organic components” (Cleland and King Reference Cleland and King1971, 188). Reluctantly, project architects include an organization chart – deemed too rigid – in their collection of graphic tools designed to organize and orient initiatives.
The three organization charts successively analyzed were produced by the CNES for ARCAD 3 at three different stages. The variety of formats used (from the official organization chart to a version in pencil) enables us to investigate and reveal the assumed or expected rationalities of the players. The CNES therefore produced organization charts which, according to their form and/or their date of publication, do not have the same aims.
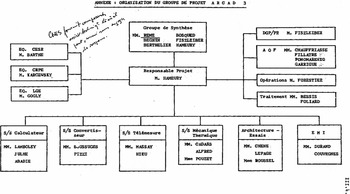
The definition review, published by the CNES in April 1977, which we have already mentioned, summarized the history of ARCAD 3, its organization and spaceborne experiments. It includes an organization chart describing the “project group” for the French part only (fig. 3).Footnote 29 It is important to note that only the names of the CNES engineers who took part in writing the definition review are indicated. For the scientific part, the laboratories are mentioned, but not the names of the researchers consulted. The project manager, G. Hameury, is at the center of the chart. He centralizes the relationships with all the other components represented. The organization chart is not a pyramid that would set up a clear hierarchy of players, but instead presents an obvious dissymmetry. The Groupe de Synthèse, which includes a certain number of scientists representing the laboratories involved and representatives of the CNES, forms an isolated block in the chart. Inside the rectangle that represents it, the hierarchy among researchers is preserved: Henri Reme, who was the scientific manager of ARCAD 3, is at the top of the list (the other names are listed in alphabetical order) and his name is underlined. G. Hameury, who is part of the groupe de synthèse (task force), is not mentioned. The technical project leaders from the three French laboratories who are responsible for French experiments are represented to the left of the project manager and form a group that is distinct and independent from other scientists in the same laboratories. A short, hand-written note specifies, just above them, that the “CNES provides components, technical assist[ance] when it can, but without engaging its respons[ibility].” An organization chart does not specify the exact role of each player; the mention of their names or the organization to which they belong normally suffices to capture expectations, implications, and responsibilities. The potential insufficiency of managers in charge of laboratory equipment necessitates an unexpected additional note, which definitively establishes the role of the CNES in technical assistance as well as its legal framework. The block located to the right in the chart designates four CNES divisions that intervene in all the projects (General Program Management, the quality department, operations, and processing). Finally, under the project manager, forming a broad foundation and marking the technical base of the CNES, are the sub-departments mobilized for ARCAD 3 (i.e. calculator, converter, telemetry, mechanics and thermics, test architecture, electromagnetic interference).
First Organizational Chart, CNES Archives, Revue de définition ARCAD 3, T. I, Toulouse, 29 avril 1977: III-4, Organisation du groupe de projet ARCAD 3.

This first organization chart details the order of relationships within the project: the CNES is the central body and the scientists responsible for equipment in the three laboratories are marginalized. The project group is clearly structured around CNES divisions and subdivisions. The permanent and stable components (i.e. intervening in all projects and with a strong internal flexibility) are essential in the makeup of the space project. The absence of arrows on the lines connecting the different rectangles reiterates the idea that the centralized hierarchy of the CNES is (in theory) nuanced by a relationship of “reciprocal prescription” (Hatchuel Reference Hatchuel, Tersac and Friedberg1996, 118). The complexity of knowledge and skills involved, the incessant back and forth between scientists and CNES engineers tends to relativize, at least at this stage, relations of authority.
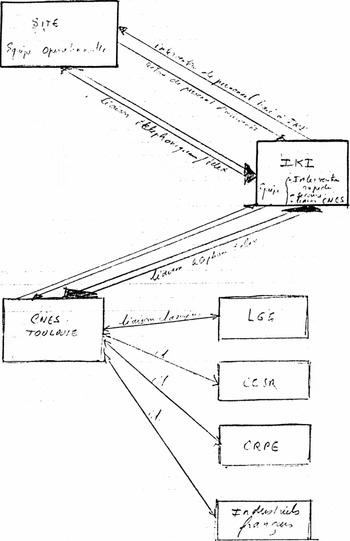
The second organization chart is from a hand-written document produced by G. Hameury, probably in 1979, entitled Intégration du satellite ‘technologique’ ARCAD 3. Philosophie générale. Enchaînement. Personnel sur site soviétique Footnote 30 (fig. 4). Addressed to four researchers on the task force (C. Béghin [CRPE], J.J. Berthelier [LGE], H. Reme [CESR], J.M. Bosqued [CESR]), the text was submitted “for information” with the recommendation “keep confidential.” Its extremely limited circulation and non-standard form indicate a document intended to deal with, behind the scenes, difficulties in integrating the experiments. The phase the document refers to involves concrete cooperation between the French and the Russians since it concerns mounting the different laboratories’ experiments on or inside the satellite and testing how the global system works (e.g. checking that there are no harmful interactions). The Russian space agency and researchers were in charge of the control systems and the satellite's design. It was therefore imperative to define exchanges about the interfaces of the different instruments with the vehicle. Hameury planned to integrate the French experiments in Toulouse before leaving for the USSR (i.e. to test compatibility between them and with the calculator). This meant “running a maximum number of tests to ensure a high level of compatibility” in order to minimize testing in the Soviet Union. The secrecy and security the Russians continued to deploy around their work continued to upset the work of French researchers and engineers. However, the CNES managed in the end to obtain “the presence of French personnel on the [integration] site.”Footnote 31 The terms of this participation still remained to be defined at the end of 1978. Hameury envisaged the composition of the group that would take part in integrations in the USSR in these terms:
It is clear that, as far as possible, each member of the “site” team should handle a maximum number of tasks, in order to aim for a relatively small team, despite the complexity of the tests. This team will therefore be made up of personnel capable of performing the nominal tests and offering a maximum of solutions for unexpected problems. It is also clear, however, that we cannot predict everything, that technical problems may be impossible to solve by the personnel or that special cases will require the scientific managers to intervene on site.Footnote 32 (Emphasis in the original)
Second Organization Chart, CESR Archives, G. Hameury, Schéma logique des relations et liaisons nécessaires durant les essais sur le site, Intégration du satellite ‘technologique’ ARCAD 3. Philosophie générale. Enchaînement. Personnel sur site soviétique, s.d. [1979].

Hameury therefore proposed to gather a “basic operational team,” in contact daily with the Russian space agency (contact with the IKI was considered a “necessary condition”), and allow the “possibility for a certain number of additional people to come to the site in special cases, emergencies, and as quickly as possible.” He therefore drew in pencil a “logical diagram of relationships and links required during testing on the SITE.” Thus, the organization chart insists on links and their concrete terms (e.g. traditional links, telephone and telex links). The site is positioned at the top with IKI underneath (with mention of the French rapid intervention team). The CNES is at a crossroads between the laboratories (public and industrial) and the IKI. The intensity of the arrows (which are larger between the CNES and IKI and between the IKI and the site than between the CNES and the labs) and the arrangement of institutions from top to bottom indicate the hierarchy underlying the integration phase in a climate of great uncertainty. The integration site is the most important zone for supervising these activities and the IKI is also an essential element. The CNES and the laboratories are clearly in the background. The research organizations are placed on equal footing with industrialists. They appear as subcontractors capable of supplying ad hoc solutions if need be. Another goal is to impose a French technical presence wherever possible (i.e. at the IKI and on the actual site), envisage backup solutions, and ensure proper transmission of information between the different structures involved. This concise, rough organization chart dissolves and recombines all the structural components of the project. It establishes a geography of the French presence and maps the intensity of relations between institutions in a delicate and uncertain context. Like the classifications examined by G. Bowker and L. Star (Bowker and Star Reference Bowker and Star2000, 232), Hameury's rough draft makes invisible work visible. It points out fortuitous arrangements, materializes the unexpected, highlights the ad hoc organization of the French teams and plots new relationships dictated by Soviet demands and constraints. The situation sketched out here reveals in fine the preoccupation of the CNES as to whether it can count on the presence of a French technician on every site. What was hinted at from the beginning of the project through the rejection of inaccurate Soviet equipment or the mystery surrounding the integration factory is now visible and outlined in a single stroke. However, this document is a paradox: it renders new relationships and hierarchies visible, but it is only circulated among the researchers concerned and is labeled confidential. It would probably have been a bad idea to reveal the French preoccupation with imposing a CNES organization method inside the labyrinth of Russian security measures. This effort at visibility or transparency is not correlated with the standardization of graphic matrices in project management. Immersion in cold war geopolitics characterized by secrecy meant reserving the transparency of organization charts to a restricted number of researchers. From the perspective outlined by Erwing Goffman concerning the staging of social interactions, G. Hameury's diagram represents the backstage of a public theatre occupied by Franco-Soviet relations, governed by diplomatic stage directions aimed at producing an appearance of scientific equality between the two nations in their joint projects. This diagram, written in pencil for a few key researchers, contradicts the “impression produced through representation” (Goffman Reference Goffman1973, 110) by underlining the relative confidence CNES managers had in Russian operators for the final assembly of the satellite. It is important to note that beyond the ad hoc graphic resolution concerning the limited presence of a French technician, this document confirms the distribution of power between the CNES and the laboratories. The latter are represented at the bottom of the chart and are attached to the CNES by simple “traditional links” even though French researchers would take part in integration on the Soviet test site.Footnote 33
The third organization chart comes from a CNES document entitled Proposition d'organisation des opérations ARCAD 3 (Proposed organization of ARCAD 3 operations), published and transmitted to the French laboratories in February 1977.Footnote 34 It was also presented in the third tome of the definition review, under the title “Organization Chart” (fig. 5). In the center, the parallelepiped of the Toulouse Space Center (i.e. the operational part of the CNES located in Toulouse) represents data transmission operations once the satellite is up and running. The mathematics division, responsible for data processing, is organized at the center of an operation dedicated to “centralization of programming.” An interface with scientists is planned. A small polygon represents relations with the USSR (in fact the Russian space agency Intercosmos) for telecommunications and localization of the satellite. Finally, the different French and Soviet stations receiving data are represented at the top of the document. As for the French laboratories, they are mentioned with the direct telemetry connection linking them to the Toulouse Space Center so they can receive data. Their role in the “scientific interpretation” of data is also mentioned. The graphic representation translates the place of each organization in this stage of the project and materializes the distribution of power over decisions as viewed by CNES engineers in the ARCAD 3 project. The technological dimension, constructed by cross-linking reception and transmission of satellite data, saturates the document. Telemetry, programming remote controls, and means of localization are emphasized. Transmitting data (by telex, telephone and telemetry) are a concern for CNES agents.
Third Organization Chart, CNES Archives, Revue de définition ARCAD 3, T. III, Toulouse, 29 avril 1977: XVII-8.

The organization chart details a specific phase of the project (i.e. data reception) and formalizes a modulation of the activities scheduled within the global framework of the experiments. Depending on the phase in the project, the rough geography of relationships between participants and the tasks they must perform is refined and modeled to more closely describe certain actions. However, while the organization chart is a highly flexible tool, it retains a certain rigidity in that it establishes all possible connections and preserves this horizon of the feasible in any situation it represents.
The organization chart produces a diagram that controls a priori the positions of the players. It plots interaction nodes, flows of exchanges and therefore sets, in advance, compulsory steps while excluding certain links. The first organization chart presented the institutional arrangements on which the project was based: relations between French laboratories, their technical poles, and the CNES are laid out. There is a definite, and very discrete, hierarchical tension. The second organization chart, confidential and hand-written, is in keeping with the ephemeral temporality of the project: it is marked by a rapid change in a situation (i.e. the possibility of sending a limited number of French agents to the USSR) and the need to outline, for the French part, sufficiently varied horizons for action to deal with every possible scenario. Finally, the third organization chart modulates the positions of the players in terms of a specific phase in the project: the reception of data marginalizes the scientific bodies and reveals the architecture of technical links between the space agencies, the stations and the satellite. It is important to insist on the fact that CNES agents were mainly in control of producing these charts, even if the laboratories could be consulted.
The second graphic tool used in project management is the schedule. Just like the organization chart, a variety of forms refer to different stages in the project (fig. 6). The first schedule we will examine was produced at an early point on the project's timeline, in 1976. It was worked out in cooperation with the Soviets.Footnote 35 It is a linear sequence of dates, establishing the rhythm of encounters between French and Russian counterparts. This list “supposes certain material arrangements, a certain spatial system” (Goody Reference Goody1979, 149). It introduces discontinuities, scansions, and anchoring points for action. This involves defining long-term agendas (over a year, by programming the items to be discussed). The global schedule forms a vague and flexible framework (i.e. it is always possible to insert new tasks). Thus, the schedule includes, in January 1977, a discussion of the “correlation meter experiment.” It does not specify whether this means discussing its feasibility or its completed assembly. Tasks are described succinctly and are not correlated with the people who must perform them (researchers or laboratories). It is important to note that this schedule was negotiated with the Soviet partners: the multitude of participants required a global agreement on meeting dates. The launch, set for 1979, was still far off, leaving a certain leeway in this timeline in the form of a potentially revisable palimpsest. The schedule design orients general action, leaving large margins for arrangements and local contingencies. It is, at this point in the project, a potential resource for the players (Suchman Reference Suchman1988, 314–315).
CESR Archives, Protocole étude scientifique de l'espace, Leningrad 8–16 septembre 1976, Projet ARCAD 3, 8 octobre 1976, Planning des travaux sur le projet ARCAD 3.

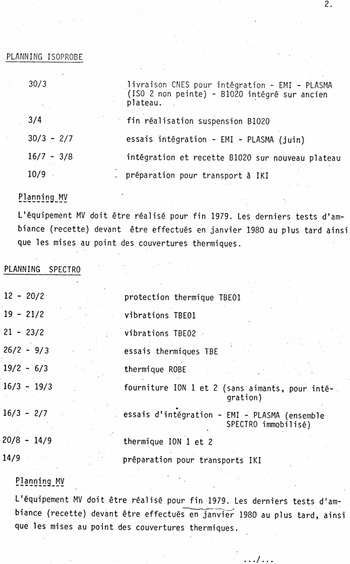
The second document was written one year before departure of the satellite. It is not a single schedule, but a set of graphic signposts projecting, in various forms, deadlines for completion of certain tasks within the laboratories. A memo, written by the project manager, G. Hameury, specifies and underlines the key points of a chronology distributed in layers of dates mixing general objectives (i.e. linked to complete assembly of the satellite and its launch) and specific goals for each laboratory (e.g. developing an experiment).Footnote 36 One of the schedules given to the French scientists specifies the timeframes for completion of specific tasks in each experiment (fig. 7). Thus, for the Spectro system, by the CESR in Toulouse, the project manager indicated the thermal tests would take place from February 26th to March 9th 1979. Compared to the schedule produced in 1976, the timeframes are tighter and actions are strung together along a finer chronological line.
CESR Archives, G. Hameury, Note aux laboratoires scientifiques du projet ARCAD 3, 30 janvier 1979.

The second schedule in this set of documents distributed to French scientists is not a list of dates, but a frieze materializing, for the year 1980, the final tests performed at the Toulouse Space Center, transport to the USSR, tests at the launch pad, and the actual launch (fig. 8). The format of the document is a Gantt chart organizing activities and time. The sequencing of tasks, their materialization in series of bars, reinforces the irremovability of actions. In a companion note, the CNES project manager points out to scientists involved in the project “the fact that these dates are the basis of our work, not only in the ARCAD 3 department, but also in the other divisions of the CNES.” He adds that “it will be extremely difficult to move these dates without serious repercussions linked to people's scheduled workloads and means.”Footnote 37 The note is not redundant with the schedules distributed. It is a reminder of the organizational depth on which the project is based. The chronological lines, while very tight, fail to graphically represent the interdependent relationships between laboratories and technical teams inside the CNES. Schedules are therefore produced throughout the entire project through a process that gradually solidifies actions and dates for their completion.
CESR archives, G. Hameury, Note aux laboratoires scientifiques du projet ARCAD 3, 30 janvier 1979.

The third schedule, defined and sent to the laboratories by the CNES, comes from the mathematics and processing division (fig. 9). Made up of circles filled with hatching, or left white, and linked by lines, it is in fact a highly simplified PERT chart (Program Review and Technique Evaluation). At the end of the 1950s, projects developed by the US Navy (in particular Polaris with more than 11,000 agents) required a new organizational model capable of arranging and coordinating research, design, and development work. American naval officers contacted the firm Booz, Allen & Hamilton which, in 1957, proposed using the PERT chart as a graphical organization tool for large-scale technological projects (Hughes Reference Hughes1998, 852–854). This management tool quickly spread and was a great success in firms and administrations involved in major projects (Wille, Gewald, and Weber Reference Wille, Gewald and Weber1971, 5; Schoderbek Reference Schoderbek1965). In France, starting in the 1960s, books on methodology and didactics were imported from the United States and quickly translated (e.g. Latterner, Dresdner, Spiech, and Uslan Reference Latterner, Dresdner, Spiech and Uslan1964). A few French authors produced original works on the PERT (e.g. Sicard Reference Sicard1967). I. Chvidchenko points out, quite correctly, in his overview of large-scale space projects, that the PERT chart had become, at the dawn of the 70s, a traditional tool that had already been heavily modified and adapted to the point of being almost obsolete (Chvidchenko Reference Chvidchenko1974, 8). The PERT chart, as Thomas P. Hughes observes, provides “a graphic representation of the synchronic interactions and the development of a complex project. [It] is the graphic portrait of a flow chart, or a dynamic network diagram on a computer printout. The diagram produces the representation of a design-research-development project captured in the course of its evolution” (Hughes Reference Hughes1998, 854). The aim of a PERT chart is to show the sequence of actions and dates of their implementation. Segments signal an activity (of any nature); circles around the segments designate isolated events (Chvidchenko Reference Chvidchenko1974, 90). The PERT chart sent out on June 1st 1979 by D. Hermelin, head of the mathematics and processing division of the CNES, details the different phases of data processing. Therefore, this concerned, before the launch of ARCAD 3, specifying the means used to receive and analyze data. One main line organizes the document. It signals the tasks to be completed and the dates. At the end of design studies, in August 1979, the specifications of the software integrated in the experiments would precede its development, initiated in spring of the same year. The definition review, or more precisely review of the phase concerning data processing, would take place in January 1979. After testing and integration, a complex series of data validations would follow (simulated and then real), taking place before and after the satellite launch in December 1980. At the same time, the software would be delivered to the IKI just before the launch. The exploitation phase stretched from May 1980 to June 1982. An exploitation report had to be published in September the same year. This main line of events and actions is punctuated, in the lower part of the document, by annual Franco-Soviet meetings concerning ARCAD 3 in general and seven more specific meetings dealing with data processing. The last bilateral meeting, converging with the main line of the PERT chart, brings the actions to a close.
CESR Archives, Projet ARCAD 3, Traitement des données, 1/06/1979.

Among the management tools available to CNES administrators and engineers, the PERT chart, while fading at the end of the 1970s, offers a synthetic view of continuous actions (i.e. data processing from design to the end of application) linked by regular encounters. The form of the PERT chart allows, within a single graphic space, a dynamic description of sequences of activities and fixes static transition points. This schedule does not indicate precise dates. The circles are only used to signal the month of an event. However, it is by no means an elastic temporal structure that allows for delays or postponements. The sequencing and linearity of acts prohibits any rollbacks and deviations in processing the data. The PERT takes the principle of appropriate action theorized by Laurent Thévenot (Reference Thévenot1990) as far as it can go: judgments on ongoing actions and critical tests of these judgments are materialized by regular bilateral meetings (whether general or specifically focused on data transmission). These encounters inscribe the remaining actions and events in an iterative assessment that frames and closes them. They also indicate different degrees of legitimate assessment, depending on whether they concern the entire ARCAD 3 project or only the part dedicated to transmissions.
It is important to note that, while centered on these actions, this representation almost completely ignores the stable, permanent structures behind the ARCAD 3 project. The laboratories are absent from the schedule (i.e. they are not even mentioned) when in fact they do take part, notably in the integration tests. The PERT chart has an anonymizing effect, dissimulating players in favor of actions. Hierarchical relationships and the distribution of power, (which are indeed present throughout the project) are erased by the alignment of acts and events. And yet, the preoccupation with the appropriate action (through a judgment and assessment of this judgment) serves as a reminder that representing actions instead of actors does not release the latter from their responsibilities and obligations.
Initially flexible and reduced to a series of international meetings, the schedules increasingly refine the organization of tasks, tying them firmly to a strict chronology. Each action is detailed, set in time, and distributed according to its frame of completion. Discussions of the calendar took place during meetings between representatives from the CNES and laboratories involved in ARCAD 3, but in the end the CNES produced and circulated the final versions of these schedules. By gradually setting/freezing actions in time, the space agency provided scientists with a means of monitoring their own performance. The interdependency of tasks (recalled if need be in a memo) meant researchers had a major responsibility in terms of the project's success. The schedule, which gradually became more rigid, projected this responsibility and was deployed as a self-monitoring tool. The PERT chart, used to visualize the roll out of data processing operations, insists even more on the sequencing of actions and their linear nature. This tool, while quasi-obsolete at the end of the 1970s, contributes to an increasing lack of differentiation by reducing the scientific players to their actions.
Organization charts and schedules summarized the positioning of collective players (i.e. laboratories, agencies), deployed their various temporalities, and planned the interactions between French researchers, scientific managers, and Soviet participants. They described the scenarios (Akrich Reference Akrich1993), that is to say, the projected timeline of a chain of actions, spatially distributed between stable and cognitively modulated structures. Above all, these graphic representations of players and actions maintained and perpetuated, beyond the variety of forms they adopted and despite attempts at dissimulating rivalries (notably in the PERT chart), the asymmetric distribution of powers: the CNES is at the center of the organization charts and its managers define the pace and rhythm of ARCAD 3. These graphic tools circulated between the CNES, the French laboratories, and, in certain cases, the Soviet scientists who constituted the conventional foundations of action as conceptualized by Nicolas Dodier. Organization charts and schedules strive to achieve “reciprocal adjustment of actions between different protagonists” (Dodier Reference Dodier1993, 68). They formalize – by visualizing them – the associations, relationships, and acts that need to be performed. Integrated within each other, they create a global diagram of actions, whether they are directly linked or not at all. These written forms define a horizon of the possible and provide scientists with the footing they need to act within their laboratories.
No box is completely black or translucent
The general goals of ARCAD 3 were to “better understand Sun-Earth relations”Footnote 38 and to conduct “a study of the system composed of ionized plasma . . . and electrostatic and electromagnetic waves”Footnote 39 in the magnetosphere. The satellite and its onboard instruments could capture interaction phenomena that develop at the juncture of the ionosphere and magnetosphere. The ARCAD 3 payload included “10 French, Soviet and Franco-Soviet experiments.”Footnote 40 The complementarities of the onboard instruments ensured global coverage of the phenomena studied in the magnetosphere and ionosphere, notably the “measure of plasma . . . waves and their optical, electric and magnetic effects.”Footnote 41
The term “experiment” is (apparently) ambiguous. It indeed designates the physical process of recording and transmitting data, but also the instrument developed to collect it. The satellite that carries the experiments moves through the physical phenomena observed (in this case aurora). Its movement through layers of the atmosphere is part of the experiment's conditions. Consequently the term “experiment” designates not only the instrument per se (a passive and inert component when on the ground), but also the act of setting it in orbit around the Earth and the interactions that follow with the aurora studied.
As indicated earlier, the ARCAD 3 project included three French experiments (Isoprobe, to measure electronic density, temperature and local ionic composition, Dycton, focused on thermal plasma, and Spectro, consisting in five spectrometers to identify the origin of auroral particles), four Soviet experiments (Kukusha, Pieschanka, Fon, and Altaïr, which measured the flow of electrons and positive ions within a certain energy range) and three joint experiments (Correlation meter, TBF, and Trac, designed to study, in particular, disturbances in the geomagnetic field).
ARCAD 3 had the particularity of carrying a French calculator, CN2B, “that manages the French experiments and the Correlation meter experiment, [and] optimizes through multiple modes, running of experiments by adapting them to measurement conditions.”Footnote 42 Made up of a CPU, a storage program and a channel access, it could ensure data pre-processing, and formatting. Thus, for the Dyction experiment, it took charge of calculating the direction of ions (Hameury, Chene, Lamboley, Lyseenko, and Massay Reference Hameury, Chene, Lamboley, Lyseenko and Massay1982, 558–559). The importance of the calculator and its central role for the experiments linked to it were pointed out by CNES engineers on numerous occasions. A memo dated September 18th 1979 insists on the fact that operation of the calculator “conditions that of the entire scientific system.”Footnote 43
A “functional diagram of use of the spaceborne calculator” details the operations between the interface and the calculator, the experiments and the equipment transmitting data to Earth (fig. 10). Circulated in a memo for the first time in 1975,Footnote 44 the document was transmitted to the laboratories again in 1979Footnote 45 and was finally published in a special edition of the Annales de Géophysique in 1982 (ibid., 558) that presented the entire ARCAD 3 project.
Schéma fonctionnel de l'utilisation du calculateur embarqué (CESR Archives, Note de synthèse, septembre 1975).
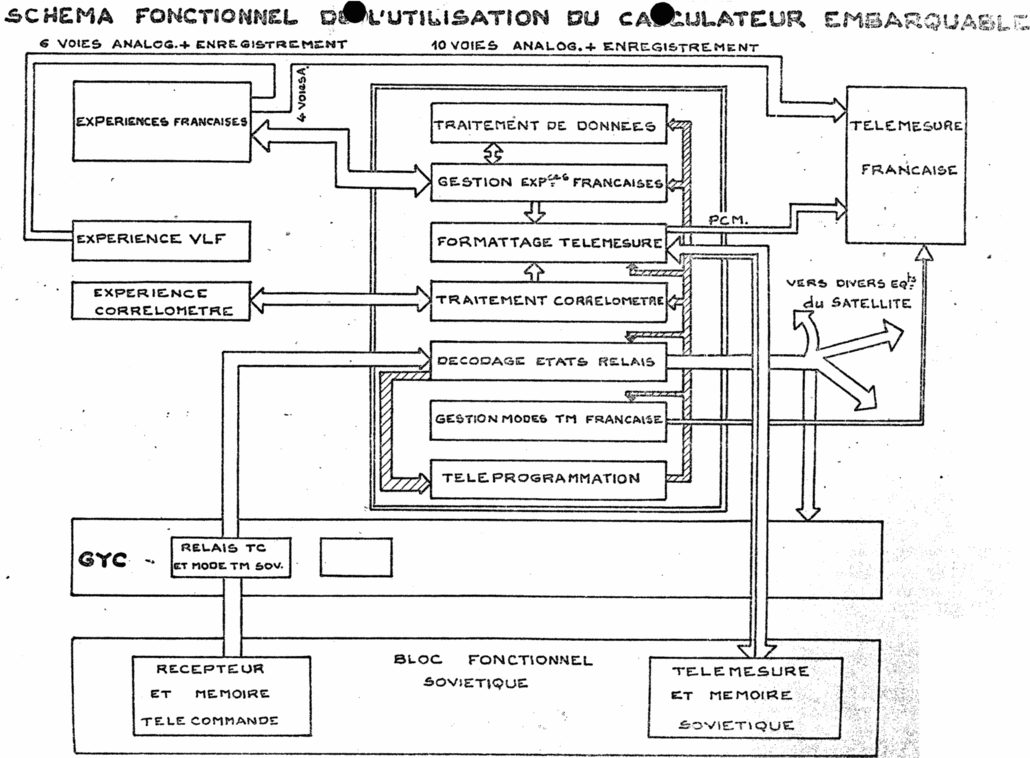
The graphic solution adopted to present the role and operation of the calculator consisted in associating actions handled by the calculator and material objects. Seven rectangular blocks, placed at the center of the diagram inside a rectangle, list the functions of the CN2B: data processing, managing French experiments, formatting and telemetry, processing the Correlation meter experiment, decoding relay states, managing French telemetry and remote programming. These different phases are distributed in such a way that it seems they could take place simultaneously (i.e. tiers of rectangles, linked by hachured arrows). Certain actions are linked: data processing and management of experiments are connected by a double arrow, a simple arrow associates processing of the Correlation meter experiment and formatting measurements. The arrows materialize data flows and relations of dependency. However, there is no key indicating the logic behind these different types of action. The arrows entering and exiting the calculation bloc indicate interfaces between the calculator, experiments, remote controls, telemetry, and control systems. The French experiments are managed directly by the calculator; the latter also formats the telemetry. The decoding function of the CN2B offers a link to the different pieces of equipment on the satellite.
The Soviet experiments are missing from the diagram since none of them involved the calculator. The archives do not indicate why the Russian researchers did not connect their instruments to the French CN2B. The need for secrecy and the technological gap between the two countries, mentioned previously, offer two hypotheses. The Soviet functional components take up the bottom of the diagram in the form of large rectangles. They indicate Soviet mastery of the control system as well as the relative opacity of Russian telemetry (even though it is linked to the calculator). The diagram not only shows the agreements behind the Franco-Soviet project ARCAD 3, but also indicates the different technological options selected by the scientists of each country.
Only the Correlation meter experiment, conducted jointly by French and Soviet researchers, is integrated in the CN2B. However, the data flow it sends to the calculators is clearly distinguished on the diagram from the rest of the experiments.
The graphic description of the onboard calculator's use highlights differences in French and Soviet technological approaches. The French laboratories opted for centralization of calculation modes, which redefined the general architecture of the project. The Soviets used only the coupling unit and are therefore represented in the margins of a diagram written by, and intended for, French agents. Above all, the installation of a calculator operating at the junction of all the French experiments modified installation of the instruments. The CNES managers therefore noted, in the definition review in April 1977, that the “functional links between French experiments, via the use of a central calculator, no longer allow us to consider the experiments as ‘black boxes’ but as a complete system.”Footnote 46 This refusal to conceive of the instruments exclusively in terms of the results they could obtain without any consideration of their internal workings (MacKenzie Reference MacKenzie1998, 26; Smith and Tatarewicz Reference Smith and Tatarewicz1994, 102) is only partly visible in the functional diagram of the ARCAD 3 calculator. Of course, the CN2B forces the engineers to represent the actions it enables, but schematization closes off the experiments, which are simply indicated inside rectangles containing their names. The translucentFootnote 47 representation of the calculator is made possible by the opacity of the experiments: the undoubtedly excessive complexity of the objects and actions involved as well as possible dilution, in a vast plan, of the key points that needed to be highlighted can explain the choice of a partial projection of the functional components The graphic staging of the instruments contains limitations that are just as important as the details provided. The functional diagram of the CN2B is neither totally opaque (the calculator's actions are detailed) nor totally translucent (the experiments are black boxes), contradicting the comments of the CNES engineers during the definition review. More specifically, the graphic compromise imposed by a functional diagram of spaceborne instruments inside a satellite indicates there are practices (such as the precise interfacing between the calculator and the experiments) that cannot be reduced to mere schematic representations. Graphics and plans only partially organize certain actions and detail certain interfaces. Their abundance and reiterationFootnote 48 produces (and aims to produce) the illusion of a scientific practice that is totally modeled and modelizable. The absence of a key for the arrows, the blind spots in the diagram, and the discourse that overflows and contradicts it are all faults and breaks in the order of representations that graphic project management tools try to enforce.
Control, power, and neoliberalism
The graphic tools that structure project management transform scientific activities. A longitudinal analysis of ARCAD 3 through its diagrams, organization charts, and schedules highlights the continuous documentary adjustments required by the project structure. The interstitial space occupied by the project between large institutional bodies (space agencies, laboratories) is not a blank, neutral void, detached from the political climate in particular. Thus, the geopolitics of the Franco-Soviet agreements underlying the ARCAD 3 project rise to the surface in the varied forms of numerous documents: technological caesura and policies of secrecy and centralization are etched across the functional diagrams or organization charts. The elasticity and modularity of graphic management tools bear witness to the continuous adaptation of the project. Each of its phases offers an opportunity for reinterpreting the position of agents and the actions they must perform. However, this freedom and flexibility are not infinite and the grammar of graphics offers only a limited number of combinations. Hierarchies and the distribution of power (notably the central role of the CNES) are persistent traits of the managerial corpus. The project, as it is conceived of inside space organizations in the second half of the twentieth century, is only slightly deliberative. Scientists ensnared in the network of graphic representations have little or no control over them.Footnote 49 The position of the CNES, as a generator of positions and dispositions, is constantly reasserted: at the center of every diagram and the top of every organization chart, the French space agency dictates the project's architecture. This assertion of the declarative and prescriptive power of the CNES is reinforced by the logic of producing graphic management tools. While the information they contain is sometimes negotiated between CNES managers and scientists involved in ARCAD 3, they are systematically finalized by CNES engineers. Control over written managerial communications is a form of “tyranny of those who write acting on those who are permanently excluded from writing” (Callon Reference Callon, Law and Mol2006, 214).
Project management documents, circulating from the CNES to the laboratories, make up a layer cake of disjointed actions as well as model of Big Science in paper form. The graphic engineering used in the context of ARCAD 3 establishes organization charts and schedules as the conventional Footnote 50 and syntagmatic foundations of action as they do not operate alone, but are ordered inside a general plan. They cement a global vision of social relations; they condense, in a written format that is less descriptive than prescriptive, an intentionality that aims to limit, frame, and adjust the players’ possibilities, while at the same time preparing procedures for judging actions. Project management is not a neutral and pure graphic exercise like the lines in the diagrams, schedules, and organization charts it generates. All information systems include a “politics of voice and value that is often invisible, embedded in layers of infrastructures” (Bowker and Star Reference Bowker and Star2000, 229). They are positioned within an ensemble that is even broader than the forms of action that are codified and shared “which include organizing election campaigns, networking and lobbying, decision management, party organization and public debating” (Barry Reference Barry2001, 207). Several researchers have characterized the power struggle established by project management as an exercise in “flexible constraint” (Courpasson Reference Courpasson2000, 200–206) or an ambiguous power (Horwitch Reference Horwitch1979, 187; Goodman Reference Goodman1967). The end of vertical hierarchies in the project structure would reduce the effects of authority and open room for initiative. These analyses assume there is a moral imperative linked to the use of power. Authority would be accepted by those on whom it weighs due to the status symbols (social prestige, rewards) it can bestow to construct (or assert) its legitimacy (Courpasson Reference Courpasson2000, 200). Yet, this axiological thesis does not allow us to investigate the real use of power.
Michel Foucault's proposals concerning “governmentality” offer, in our opinion, a better heuristic perspective to identify the political field lines engrammed by the project form.Footnote 51 The philosopher describes governmentality as the “conduct of conducts” (Foucault Reference Foucault, Dreyfus and Rabinow1984, 314). Governing should be seen as the capacity to “structure the possible field of action of others. The relationship proper to power would not therefore be sought on the side of violence or of struggle, nor on that of voluntary linking . . ., but rather in the area of the singular mode of action, neither warlike nor juridical, which is government” (ibid.). Foucault includes governmentality in his approach to neoliberalism and explores, in more general terms, its performative goals in remodeling the rationality of players (Foucault Reference Foucault2001a and b; idem 2004).Footnote 52
Neoliberalism, as a general political form, developed in France during the second half of the twentieth century. During the Fifth Republic, neoliberal ideas spread via engineer-economists and the Faculty of Law. Under the presidency of Georges Pompidou, “managerial neoliberalism” gradually dominated large administrative bodies, notably the Commissariat général du Plan (Plan Commission) (Denord Reference Denord2007, 268–272). Project management took root in this specific political framework, taking shape around its imperatives (see also MacKenzie and Wajcman Reference MacKenzie, Wajcman, MacKenzie and Wajcman1996, 298–299). Neoliberal governmentality, as a global economy of social relations, aims to minimize direct modes of exercising power.
This does not mean that power disappears. The decline of a disciplinary society in favor of one based on neoliberal control has been theorized by Gilles Deleuze (Deleuze Reference Deleuze1990, 240–241). Neoliberal technologies are used specifically for self-monitoring purposes.Footnote 53 The minimal intervention of power (see Terrel, Reference Terrel2010, 96–103) is based on its capacity to spread to all players so they can police themselves even more efficiently since surveillance is pervasive (Dardot and Laval Reference Dardot and Laval2009). This transition towards a society of control is not ex abrupto (Agemben Reference Agemben1997, 14). Old forms from the disciplinary society subsist. The “power of the written word” (Foucault Reference Foucault1975, 222) in particular has shifted from the points of surveillance and coercion of the panopticon towards a minimal organization of relationships between individuals. The graphic management tools used by the CNES allowed it to fix the position of each player, designate spaces for tasks, specify the temporality of actions and map possible (or impossible) relationships. They implement self-monitoring systems that enable all the participants to constantly measure the conformity of their practices or their results with managerial expectations. They have become a form, among others, of neoliberal power. Thus, adaptation of scientific practices in terms of the project has been added, in the second half of the twentieth century, to the impressive list of political modes of action conquered by neoliberalism.
Of course, neoliberalism was not the only politico-economic system to use graphic tools in order to implement management principles. However, the specific ontological aims of liberalism, particularly the pretence of redefining all social relationships, imply capturing representations of the world and offering them as abridged, condensed, and quintessential forms of political expression. Susan Buck-Morss, referring to graphics used to “envision capital”Footnote 54 correctly asserted:
The economy is now seen to act in the world; it causes events, creates effects. Because the economy is not found as an empirical object among other worldly things, in order for it to be “seen” by the human perceptual apparatus it has to undergo a process, crucial for science, of representational mapping. This is doubling, but with a difference; the map shifts the point of view so that viewers can see the whole as if from the outside, in a way that allows them, from a specific position inside, to find their bearings. Navigational maps were prototypical; mapping the economy was an outgrowth of the technique. (Buck-Morss Reference Buck-Morris1995, 440)
Graphs and schedules are not the only tools used to implement the principle of self-monitoring: badges, remote workstations, and surveillance cameras also structure the managerial framework. I would like to insist in this article on the wide range of self-monitoring practices that were implemented, starting in the 1970s, in the field of scientific research. Organization charts and schedules are not traditional tools of coercion; we are not talking about the use of force or physical violence to achieve compliance. The case of space management highlights the transition from “government by orders to management through the search for a project, from hierarchical supervision to the implementation of controlled autonomy. The object of control tends to shift from physical to mental activity. Instead of a framework to contain bodies, the aim is to channel impulses and mobilize minds” (de Gaujelac Reference De Gaulejac2009, 119). Organization charts can be challenged; the important point, in the neoliberal system, is that the players think of them as organization tools in which they eventually see themselves. In the same way, deadlines can be postponed; but it is more important that the graphic perception of time in which the project unfolds becomes the only acceptable reference for agents. All of these graphic tools aim to obtain “reactive, flexible, adaptable behavior” (ibid., 120). The incorporation of positions and compliance with the temporalities of the project depend, according to the neoliberal order, on a multitude of self-monitoring tools that the actors gradually adopt and that transform them globally (Lordon Reference Lordon2010). Organization charts and schedules in space management are only a few components of a more general policy transforming the subject.
Acknowledgments
A first version of this text was presented in 2009 at the IIIe Congrès de l'Association Française de Sociologie in Paris. I would like to thank Gérard Azoulay, Jérôme Denis, Volny Fages, Michel Grossetti, Dominique Pestre, David Pontille, Arnaud Saint-Martin, and Terry Shinn for reviewing this article and for their comments and criticism, which helped enrich it.