Proteolysis in cheese during ripening plays a vital role in the development of texture and flavour, and has been the subject of several reviews (Fox & McSweeney, Reference Fox and McSweeney1996). Proteolysis contributes to textural changes of the cheese matrix, due to breakdown of the protein network, decrease in a w through water binding by liberated carboxyl and amino groups, and increase in pH, which facilitates the release of sapid compounds during mastication. It contributes directly to flavour and to off-flavour (e.g., bitterness) of cheese through the formation of peptides and free amino acids as well as liberation of substrates (amino acids) for secondary catabolic changes, i.e., transamination, deamination, decarboxylation, desulphuration, catabolism of aromatic amino acids, and reactions of amino acids with other compounds (Sousa et al. Reference Sousa, Ardö and McSweeney2001). However, biogenic amines (BAs) can also be produced by proteolysis in high amounts through the amino acid decarboxylases activity. Excessive consumption of these amines could be a health concern because their unbalanced uptake by the human organism could generate diseases of different degrees of severity due to their action on the nervous and gastrointestinal systems, and on blood pressure.
Torta del Casar is a high quality Spanish cheese produced in the south-west of Spain, characterised by its soft and buttery texture, yellowish-coloured paste, intense flavour, and its peculiar, slightly bitter taste. It is marketed under the Registry of the Protected Designation of Origin ‘Torta del Casar’ (Casar de Cáceres, Cáceres, Spain) in accordance with the Regulations (CE) 1491/2003 of the European Commission. This cheese is made from whole raw ewes' milk using an aqueous extract of dried wild cardoon (Cynara cardunculus) flowers as coagulant (Macedo et al. Reference Macedo, Faro and Pires1993). Delgado et al. (Reference Delgado, Rodríguez-Pinilla, González-Crespo, Ramírez and Roa2010) attributed the particular slightly bitter taste and spreadable texture of these cheeses to the use of raw ewe milk and plant coagulant.
Extracts of C. cardunculus are reported to contain two proteinases, cardosin A and cardosin B (Sousa, Reference Sousa1993; Verissimo et al. Reference Verissimo, Esteves, Faro and Pires1995, Reference Verissimo, Faro, Moir, Lin, Tang and Pires1996). Cardosins are characterised by high milk-clotting activity (Macedo et al. Reference Macedo, Faro and Pires1993; Sousa & Malcata, Reference Sousa and Malcata1998) and also display a strong proteolytic action in vitro, which eventually leads to extensive breakdown of the caseins in the cheese matrix (Macedo & Malcata, Reference Macedo and Malcata1996), producing cheese characterised by a soft buttery texture and the development of a typical aroma and a slightly piquant and creamy flavour (Galán et al. Reference Galán, Prados, Pino, Tejeda and Fernández-Salguero2008). Proteolysis is one of the main chemical routes implied in the aroma and the development of the soft and spreadable texture of this cheese, which is one of the most important and differential characteristics of cheeses that use vegetable coagulant like Torta del Casar (Delgado et al. Reference Delgado, Rodríguez-Pinilla, González-Crespo, Ramírez and Roa2010).
These traditional aqueous extracts are made from flowers of diverse C. cardunculus plants harvested at different flower ripening stages and mixed with other parts of the plant. Hence, the milk clotting activity of the flowers shows great heterogeneity in their use as coagulant for manufacture of Torta del Casar. This fact has a negative influence on cheese quality parameters, including low yield, and lack of homogeneity of relevant sensorial factors between batches, such as texture parameters. Thus, the technological quality control of the aqueous extracts used as rennet would be desirable for standardisation of the cheese-making process.
The aim of this work was to analyse the influence of different C. cardunculus populations, characterised by their clotting and proteolytic activity against caseins, on the characteristics of manufactured Torta del Casar cheeses.
Materials and methods
Plant material
Samples of cardoon (Cynara cardunculus, L.) used in this study were identified in accordance with the guidelines of Valdés et al. (Reference Valdés, Talavera and Fernández-Galiano1987). Sixteen plants, M1 to M16, were collected from different locations during the seasons of the years 2007 and 2008 (Ordiales et al. Reference Ordiales, Martín, Benito, Hernández, Ruíz-Moyano and Córdoba2012). The collected flowers were dried and kept in a cool dry place until use.
Milk-clotting activity
The milk-clotting assays were done as Ordiales et al. (Reference Ordiales, Martín, Benito, Hernández, Ruíz-Moyano and Córdoba2012). Each cardoon sample, 0·5 g, was softened in 75 ml of ultrapure water for 1 and 24 h. The rennet clotting time of these coagulant extracts was measured according to a standard method (NILAC™; NIZO, Ede, The Netherlands) (Tavaria et al. Reference Tavaria, Sousa and Malcata2001). Twelve grams of bovine skimmed milk powder were dissolved in 100 ml 0·01 m CaCl2 (pH 6·5) at 30 °C to prepare the substrate. The enzymatic assay was performed using 0·2 ml coagulant extract added to 2 ml reconstituted skim milk, and the clotting time was determined by visual inspection. The amount of crude enzyme extract needed to coagulate 10 ml reconstituted low-heat processed skim milk at 30 °C in 100 s was defined as one rennet unit (R.U.) (International Dairy Federation (IDF); 1992). Determinations were quadruplicated, and the mean of each set of four data was taken as the datum point.
In vitro casein proteolytic activity
The dried flower extracts were prepared by macerating 0·25 g of dried flowers in 5 ml water at room temperature for 4 h (Ordiales et al. Reference Ordiales, Martín, Benito, Hernández, Ruíz-Moyano and Córdoba2012). The substrate used consisted of a mix of bovine caseins (Sigma Aldrich, Co., St. Louis, MO, USA) (α, β, and κ), at a concentration of 0·5 mg each casein/ml, dissolved in 5 ml distilled water. The dried flower extracts were incubated with the casein mix for 2 h at room temperature. After this time the extracts were denatured by adding SDS-PAGE loading buffer (62·5 mm Tris-HCl, pH 6·8, 20% (w/v) glycerol, 2% (w/v) SDS, 5% (w/v) β-mercaptoethanol, 0·025% (w/v) bromophenol blue) and incubated at 99 °C for 5 min.
The electrophoresis conditions were those described by Laemmli (Reference Laemmli1970), and the concentrations of acrylamide for separating gels were 15% (w/v). Gels were run in a Miniprotean III device (Bio-Rad Laboratories, Richmond, CA). The molecular mass marker with proteins from 6·5 to 205 kDa (Sigma Chemical Co., St. Louis, MO) was used. Proteins were visualised by Coomassie brilliant blue R-250 staining (0·25% (w/v), in 50% (v/v) methanol and 10% (v/v) acetic acid). The excess stain was washed out by destaining with a solution of 20% (v/v) methanol and 5% (v/v) acetic acid. A computer image analysis program (Genetools, SynGene, Cambridge, United Kingdom) was used for the densitometric analysis of the gels.
Torta del Casa cheese-making procedure
A total of 16 different batches, batch 1 to batch 16, of Torta del Casar were manufactured, consisting of 10 cheeses each batch, from the same batch of raw ewes’ milk to which no starter cultured was added (Ordiales et al. Reference Ordiales, Martín, Benito, Hernández, Ruíz-Moyano and Córdoba2012). Thus, a total of 160 cheeses of 500 g weight, were manufactured to perform the triplicate analysis of each batch. Each batch was clotted using different C. cardunculus L. rennets, corresponding to the 16 plants collected as before. The aqueous extracts from the cardoon C. cardunculus L. were prepared from 50 g dried flowers in 1 l water, leaving them to macerate for 24 h, and adding 10 ml of this extract per litre of milk at 28–30 °C, for each 32 l batch. The cheeses were immersed in a salt solution (16% (w/v) NaCl) for 4 h after pressing. Cheeses were ripened at 5–10 °C and 85–90% relative humidity during 60 d. Then, three cheeses of each batch were randomly taken for each analysis after 2, 30, and 60 d ripening, performing all analyses in triplicate.
Physicochemical analysis
The weight losses of the cheeses were measured through the differences of consecutives weights from the initial weight to the final weight at day 60 of ripening. The pH was measured using a Crison mod. 2002 pH meter (Crison Instruments, Barcelona, Spain). Total protein (expressed as % protein) was determined by the Kjeldahl method (IDF, 1993), with a Kjeltec system 1002 distilling unit (Tecator, Hoganas, Sweden).
The yield was determined as the quantity of cheese obtained per volume of milk, expressed in %. The cutting time is the time needed for curd to form, from when the rennet is added to when the curd is cut. Cutting time was determined visually by introducing a stainless steel spatula into the coagulation vat. The cutting time was measured by pulling out the spatula from the milk, as the time when the spatula surface was completely clean without coagulum clots or residues.
Microbial analysis
For the microbial counts and isolates, 10 g aliquots of each cheese sample were taken aseptically, transferred to sterile plastic pouches, diluted 10-fold with 1% peptone water (Pronadisa, Alcobendas, Madrid, Spain), and homogenised for 120 s using the laboratory Stomacher Lab-Blender 400 (Seward Lab., London, England). Decimal dilutions were prepared from the same solution and inoculated onto agar plates.
Plate count agar (PCA, Oxoid) was used for mesophilic aerobic bacteria counts at 30 °C for 48 h and for psychrotrophs for 7 d at 7 °C. LAB were grown in MRS agar (Oxoid) the pH of which was adjusted to 5·6 with acetic acid (10%), incubating at 37 °C for 2 d under anaerobic conditions. The Staphylococcus counts were determined in Baird Parker agar (BP; Oxoid) supplemented with potassium tellurite and egg yolk emulsion at 37 °C for 48 h, and black colonies were counted.
Analysis of whey and casein proteins
Preparation of whey and casein protein extracts
The whey protein fractions were extracted from cheese as described in the literature (Enne et al. Reference Enne, Elez, Fondrini, Bonizzi, Feligini and Aleandri2005). Samples (20 g) were homogenised (2 cycles of 1 min each) in doubly distilled water (30 ml) with an Ultraturrax homogenizer (Ika®-Werke, Staufen, Germany). Since this step is heat-producing, a strict time optimisation was required to avoid whey protein degradation. The homogenised samples were skimmed by centrifugation (2000 g for 15 min at 4 °C) obtaining the water soluble proteins. Casein was precipitated at its isoelectric point by adding 1 M hydrochloric acid and centrifuging at 2500 g for 10 min at 4 °C.
Caseins were obtained from 1 g cheese samples by precipitation at pH 4·3, by the addition of 10 ml 1 m ammonia–acetate buffer at 8 °C for 20 min (Veloso et al. Reference Veloso, Teixeira, Peres, Mendoça and Ferreira2004). Then the samples were centrifuged for 15 min at 3000 g at 4 °C to recover the precipitated caseins. The caseins were dispersed in 10 ml 1 mm ammonia–acetate buffer (pH 4·3), precipitated again, and centrifuged for 10 min at 3000 g at 4 °C. This procedure was repeated twice. In order to eliminate the remaining fat, the sample was washed with 5 ml acetone and left to dry at room temperature. Finally, the dried powdered casein was stored at −80 °C until analysis.
Protein concentration and polyacrylamide gels (SDS and UREA PAGE)
The protein concentration was determined following the Bradford method (1976) using 100 μl of the soluble protein extracts.
Whey protein hydrolysis was detected by SDS-PAGE (Mini-PROTEAN 3 system, Bio-Rad, Hercules, CA). For this, whey protein extracts were electrophoresed using 4% acrylamide in stacking gels and 15% acrylamide in separating gels. Samples (15 μl) were denatured by boiling for 5 min in 0·0625 m Tris–HCl buffer at pH 6·8 with 20% glycerol, 2% SDS, and 5% 2-mercaptoethanol. A molecular weight marker from 205 to 6·5 kDa (Sigma) was used as standard. The potential was kept constant at 90 mV for the stacking gel and at 150 mV for the separating gel. Proteins were visualised and analysed as above.
Casein protein hydrolysis was detected by UREA-PAGE. Casein protein extracts were electrophoresed using 4% acrylamide in stacking gels and 12% acrylamide in separating gels. The stacking gel buffer was 0·06 m tris(hydroxymethyl)aminomethane (Tris), 8 m urea at pH 6·8, and the separating gel buffer was 0·76 m Tris, 8 m urea at pH 8·8. The electrophoresis buffer was a solution of 0·02 m Tris, 0·19 m glycine. Samples (5 μl) were denatured by boiling for 5 min in 0·0625 m Tris–HCl buffer at pH 6·8 with 10 m urea, 20% glycerol, and 5% 2-mercaptoethanol. Standard proteins α, β, and κ caseins (Sigma) were used as standard. Computer image analysis and electrophoresis was developed as above.
Non-protein nitrogen and amino acid nitrogen analysis
Non-protein nitrogen (NPN) was determined by the Nessler method and amino acid nitrogen (AN) was determined from the 0·6 m perchloric acid protein precipitation fraction after peptide precipitation with 10% sulphosalicylic acid (Benito et al. Reference Benito, Rodriguez, Córdoba and Andrade2005; Casquete et al. Reference Casquete, Benito, Martín, Ruiz-Moyano, Córdoba and Córdoba2012).
Biogenic amine production (BA)
A 10 g cheese sample was incubated with 75 ml 0·6 m HClO4 for 1 h following Krízek & Pelikanova method (1998). The mixture was washed with HClO4 and the volume adjusted to 100 ml. In accordance with the expected amine content, 5 ml of acidic extract was transferred to a test tube, the volume adjusted to 5 ml with HClO4, and then spiked with 125 μl internal standard solution (1,7-heptanediamine, 400 mg/l). After brief vortexing with 1 ml 9·8 m NaOH solution, 100 μl of pure benzoyl chloride was added and shaken for 2·5 min. Then it was allowed to stand in the water bath of the laboratory ultrasound cleaner for 15–20 min. The solution was shaken with 2·5 g NaCl for 1 min. This was followed by a two-step extraction with 3 ml diethyl ether. Combined extracts (1 ml in each step) were dried and dissolved in 400 μl methanol–water (1:1, v/v). The biogenic amines were assayed by micellar electrokinetic capillary chromatography (MECC) (Benito et al. Reference Benito, Martín, Aranda, Pérez-Nevado, Ruiz-Moyano and Córdoba2007; Martín et al. Reference Martín, Colín, Aranda, Benito and Córdoba2007; Casquete et al. Reference Casquete, Benito, Martín, Ruiz-Moyano, Córdoba and Córdoba2012) using an automated PACE 5500 (Beckman Instrument Inc., Palo Alto, CA, USA.
Sensory analysis
At the end of ripening, a quantitative descriptive analysis was performed by a trained panel of 15 judges to evaluate differences in flavour and aroma parameters, as compact paste, acid odour, hardness, creaminess, viscosity, salty, bitter, pungent, acid, astringent, rancid, aroma intensity, aftertaste and kind of cheese ‘Torta’ (as characteristics marketed under the Registry of the Protected Designation of Origin ‘Torta del Casar’). Samples were three-digit coded, and the order of serving was determined by random permutation. Two panel-replicates were carried out for each sample. The response to each indicator was determined as the mean value of the panellists' responses. An unstructured scale was used to evaluate the different attributes. In an additional hedonic test, a panel of 17 untrained consumers evaluated the samples for overall acceptability.
Statistical analysis
For the cardoon plants' classification based on their in vitro casein proteolytic activity, the hierarchical clustering method was employed, based on average linkage using SPSS 15.0 (SPSS Inc Chicago, IL, USA). The statistical analysis of the data was carried out using one-way analysis of variance, and the means were separated by Tukey's honest significant difference test using SPSS for Windows, 15.0. The relationships between the enzymatic activities of the rennets and the physicochemical parameters of the cheeses were evaluated by Pearson correlation coefficients. A principal component analysis (PCA) was performed on the enzymatic activities of the rennets and the physicochemical parameters of cheeses at 2 d ripening.
Results and discussion
Technological characteristics of the different cardoons
Figure 1 shows the results regarding the classification of the cardoon plants, M1 to M16, and their proteolytic activity in vitro, indicating the mean clotting activity value of each cluster. Five clusters were obtained, with three supergroups of the cardoon plants classified as very, moderately, or scarcely proteolytic, this last being the case of samples M13 and M15 (Fig. 1). The cardoon plants of cluster 1 are characterised by a strong degradation of α- and κ-casein (84 and 81%, respectively), and moderately degraded β-casein (54%). Cluster 2 groups cardoons with a moderate proteolytic activity on β-casein (67%), and great intensity on α- and κ-casein (88 and 83%, respectively). The cardoons in cluster 3 showed a moderate degradation of κ-casein (54%), but intense degradation of α- and β-casein (93 and 92%, respectively). The degradation of α-casein was intense (82%), of β-casein moderate to high (70%) for cardoons of cluster 4, with κ-casein being degraded to a lesser degree (23%). Finally, the cardoons of cluster 5 moderately degraded α-casein (39%), and showed a very low proteolytic activity on β- (10%) and κ-casein (9%).
Dendrogram obtained from in vitro casein proteolytic activity of 16 cardoon plants (M1-M16) with different similarity percentages. CA is the mean clotting activity value for the samples grouped in this cluster.

Characteristics of the cheeses obtained with the different cardoons
After classifying the cardoons, 16 batches of cheeses were made with rennet derived from the different cardoon plants, batch 1 to batch 16. Figure 2 presents the principal component analysis (PCA) of the proteolytic parameters of the cheeses at 2 d ripening with the clotting and proteolytic activity of the 16 cardoon rennets used for the cheese making.
Principal component analysis of the proteolysis parameters in cheeses at 2 days of ripening, and technological properties of vegetable rennets: plane 1–2 of variable plot (a); Distribution of cheese batches depending on their classification group on the dendrogram obtained from the proteolytic and clotting activities of cardoon plants according to plane 1–2 of a factorial correspondence analysis (b).
The first axis accounted for 35·25% of the variance and was mainly defined by proteolysis parameters such as degradation of α-, β-, and κ-caseins, and also by cutting time and yield of the cheeses at 2 d ripening, with positive correlations between the parameters. The second axis (PC 3; 14·33% of the variance) was related to clotting activity of the rennets at 2 d ripening.
Batches 1, 2, 3, 6, 7, 10, and 16 were positively related to the casein degradation, cheese yield, and the cutting time of the curd. Batches 13 and 15 were negatively correlated with the parameters cheese yield, degradation of α-, β-, and κ-casein, and the clotting time. The same trend was observed for batches 9 and 11, but to a lesser extent.
Thus, the cardoon plants that had high proteolytic activity in vitro, also showed this activity in the cheeses. The contrary behaviour was very evident for those plants classified as scarcely proteolytic (M13 and M15). These cardoon plants used as rennets will therefore have different effects on the development of the sensorial characteristics of the cheeses.
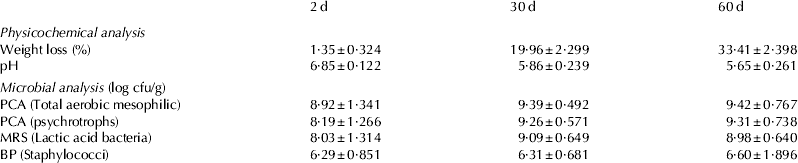
Table 1 shows the evolution of different parameters during processing. The pH values ranged from 6·85 at the beginning of the ripening time to 5·65 at 60 d ripening. The pH is of great importance in cheese ripening due to its influence on the proteolytic activity. Proteolytic activity in cheese is determined mainly by the levels and type of residual rennet, salt and moisture ratio, temperature of ripening, and changes in pH during ripening (Lawrence et al. Reference Lawrence, Creamer and Gilles1987). Over the ripening time, we observed a decrease in cheese weight, by 1·35% at 2 d ripening, to 33·41% at the end of the period studied.
Mean values of weight loss, pH and microbial counts of cheeses at 2, 30, and 60 d of ripening
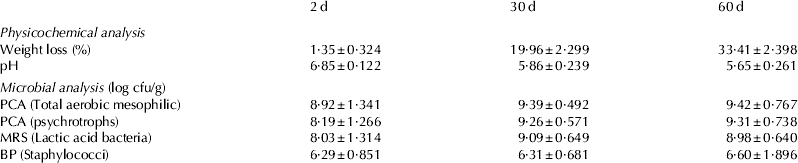
The evolution of the microorganism counts during processing is shown in Table 1. Total aerobic mesophilic counts had increased from 9·3 to 10·4 log cfu/g in the cheeses after 60 d ripening in all batches, and from 8·2 to 9·3 log cfu/g for psychrotrophs. Similar results have been found in other traditional cheeses. Galán et al. (Reference Galán, Cabezas and Fernández-Salguero2012) worked with cheese elaborated using powered plant coagulant (C. cardunculus) and found stable counts for total viable organisms of 8·7 log cfu/g throughout ripening time.
With respect to LAB, all the batches showed a statistically significant increase, reaching levels higher than 8 log cfu/g after 60 d, and for staphylococci the counts stayed stable until the end of the process at levels around 6·5 log cfu/g. This growth of LAB is consistent with the evolution of the pH values during the processing. Stable levels of Staphylococcus sp. of 6·5 log cfu/g were found throughout ripening time. In other work, micrococci and LAB counts remained constant in cheeses elaborated using C. cardunculus coagulant, with counts of 5·3 log cfu/g for micrococci, and 8·7 log cfu/g for LABs (Galán et al. Reference Galán, Cabezas and Fernández-Salguero2012).
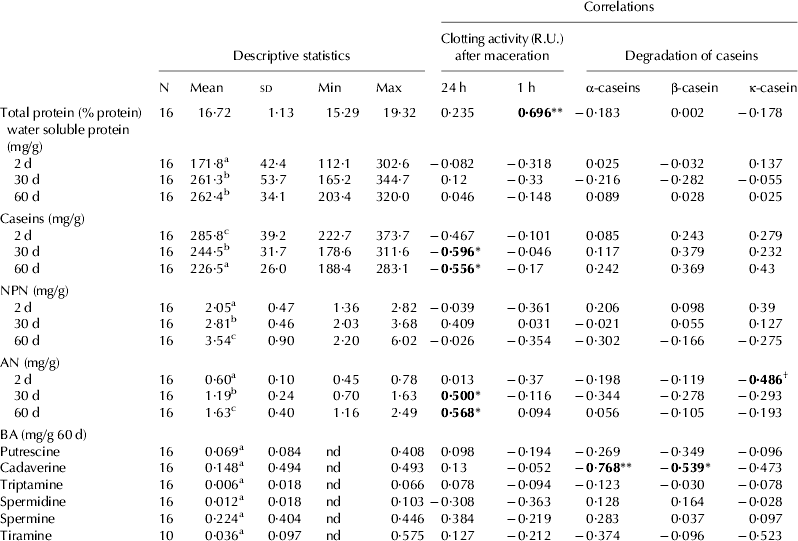
Regarding the evolution of parameters related to proteolysis throughout the cheese ripening (Table 2), caseins were degraded, with their content in the cheese decreasing from 283·99 mg/g at the beginning of the ripening process to 226·49 mg/g at the end. As a consequence, the level of water soluble proteins among which there are the whey proteins in the cheeses was higher at 60 d (262·27 mg/g) of ripening than at 2 d (171·23 mg/g). This increase is due to casein hydrolysis, because the generated peptides appear in this water soluble fraction. It seems that the water soluble protein content stabilised between 30 and 60 d ripening time. The NPN and AN concentrations increased during ripening due to the breakdown of caseins, from 2·05 at 2 d to 3·55 mg/g at 60 d ripening for NPN, and from 0·59 mg/g to 1·63 mg/g for AN. Mas Mayoral et al. (1991) recorded an increase in IP (NPN/NT) from 3·94% at 3 d following manufacture to 13% at the end of ripening time for Torta del Casar cheese. Sanjuán et al. (Reference Sanjuán, Millán, Saavedra, Carmona, Gómez and Fernández-Salguero2002) reported for Los Pedroches cheeses, manufactured with vegetable (C. cardunculus) rennet, that TN values ranged from 5·92 g/100 g at 2 d ripening to 6·04 g/100 g DM at 60 d ripening. Moreover, the content of NPN and AN in these cheeses increased throughout the ripening period. Similar results were obtained for La Serena cheese after 60 d ripening (Núñez et al. Reference Núñez, Fernández del Pozo, Rodríguez Martín, Gaya and Medina1991). Soluble nitrogen components at the beginning of the process in these cheeses are produced mainly by the action of Cynara cardunculus proteases (Roa et al. Reference Roa, López and Mendiola1999; Galán et al. Reference Galán, Cabezas and Fernández-Salguero2012), although microorganisms are responsible for proteolysis from the middle to the end of the process. The degradation of water insoluble nitrogen, and therefore the production of water soluble nitrogen, is mainly driven by residual rennet trapped in the cheese matrix, which hydrolyses α-casein (Dulley, Reference Dulley1974; Creamer & Olson, Reference Creamer and Olson1982).
Protein changes of cheeses made with different rennets and the correlations of these characteristics with the clotting and proteolytic activity of the rennet
a Means of the same parameter in the same column without a common superscript letters (a–c) differ significantly (P<0·05)
† P<0·1
* P<0·05
** P<0·01
nd: not detected
The results obtained for the protein content after 2 d ripening were positively correlated with coagulant activity (1 h), a higher protein content leads to a higher coagulant activity (1 h). Among factors that affect milk coagulation, casein concentration plays an important role (St-Gelais & Haché, Reference St-Gelais and Haché2005). Caron et al. (Reference Caron, St-Gelais and Pouliot1997) observed that coagulation was delayed (long coagulation time) in milk with high protein content relative to milk with a low protein concentration. Moreover, the casein content was negatively correlated with coagulant activity (24 h) at 30 and 60 d ripening, a higher rennet clotting activity (24 h) results a lower content of casein at 30 and 60 d. This is due to the greater degradation of caseins. Van Hekken & Holsinger (Reference Van Hekken and Holsinger2000) observed that rennet coagulation properties were related not only to casein concentration but also to the proportion of α-casein and β-casein present in the milks. In parallel with the evolution of the casein, the rennet coagulant activity (24 h) influenced the AN content of the cheese at 30 and 60 d ripening. The correlation is positive, meaning that a greater coagulant activity (24 h), greater content of AN in the cheese at 30 and 60 d ripening due to the effect of the degradation of caseins.
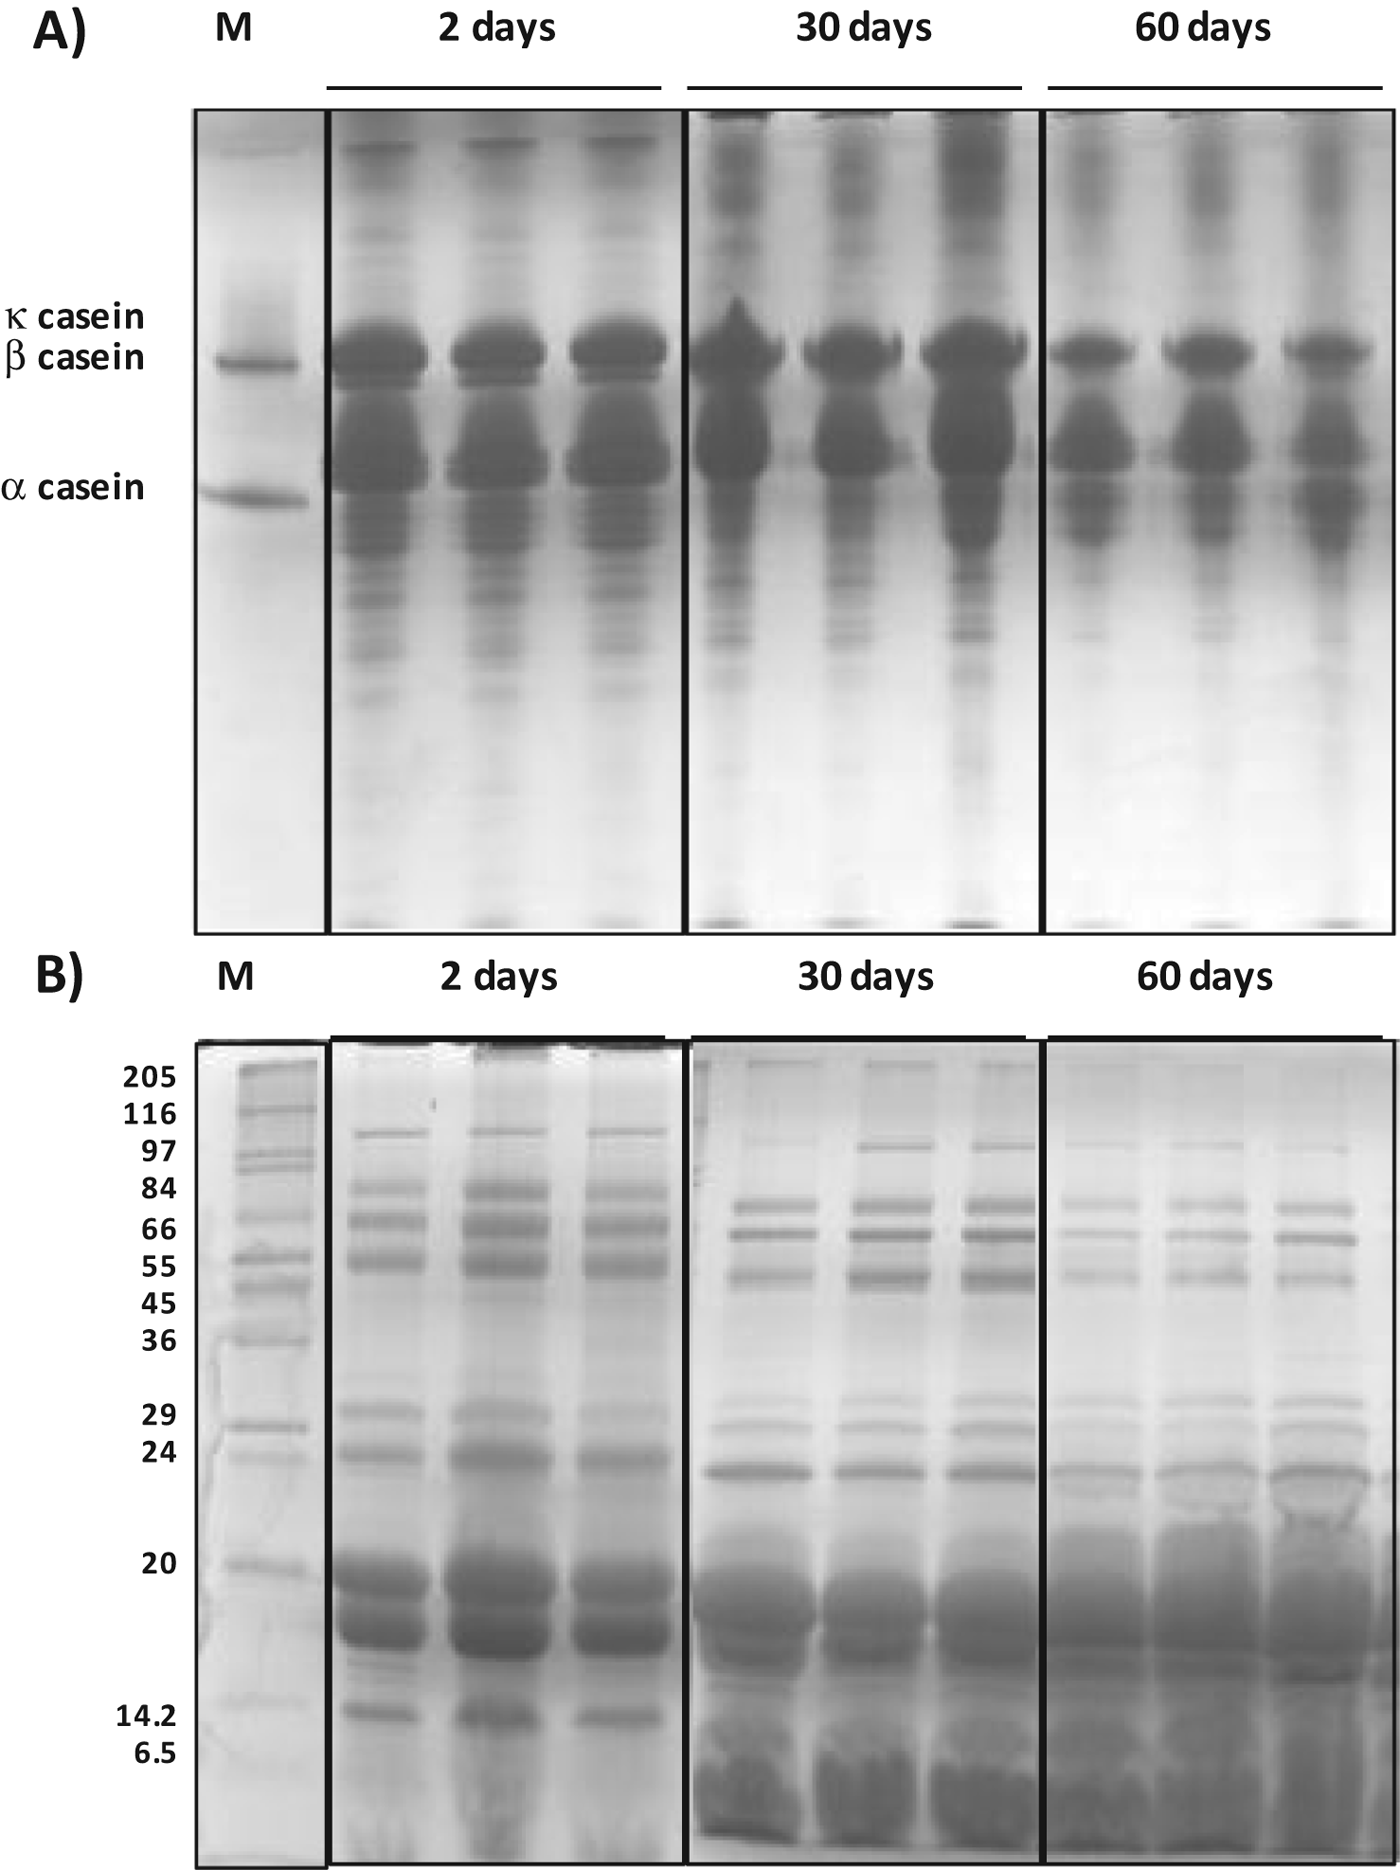
The effect of proteolysis during processing is also shown in Fig. 3 for the UREA and SDS-PAGE gels. There was no difference between batches observed by PAGE gels. The differences between batches previously observed could not be visualised with PAGE gels, as it is a less sensitive method. The casein profile evolved throughout ripening, showing a gradual degradation of caseins (86% for α-casein and 74% for β-casein) in all samples. Concomitant with this decrease in concentration of these caseins was an increase of nitrogen compounds derived from proteins. The same was the case for whey proteins, which decreased throughout the process, but peptides deriving from casein hydrolysis appeared in the water soluble fraction during the ripening, which caused the protein value of this fraction, measured with the Bradford method, to increase (Table 2). Proteolysis, the ratio of β- to k-caseins, has been used as a basis to classify cheeses (Fox, Reference Fox and Fox1993; Sousa et al. Reference Sousa, Ardö and McSweeney2001). Macedo & Malcata (Reference Macedo and Malcata1996) studied the hydrolysis of α- and β-caseins during the ripening of ‘Serra’ cheese by polyacrylamide gel electrophoresis. They observed that, by the end of ripening, the α- and β-caseins had undergone extensive degradation, up to 82 and 76%, respectively. However, other authors found that, while α-casein decreased throughout ripening, β-casein only decreased slightly, confirming its greater resistance to enzyme hydrolysis (Fernández-Salguero & Sanjuán, Reference Fernández-Salguero and Sanjuán1999). The hydrolysis of β-caseins seems to be related to the type of rennet (Macedo & Malcata, Reference Macedo and Malcata1996).
Evolution of proteins during processing. (a) Urea-Page with casein protein extracts from the cheese batch 4 at 2, 30, and 60 d of ripening by triplicate. M, standard proteins α, β, and κ caseins. (b) SDS-Page with whey protein extracts from the cheese batch 4 at 2, 30, and 60 d of ripening by triplicate. M, molecular weight marker.
Compounds derived from protein degradation contribute to cheese flavour and to the development of the correct texture. It is possible that the proteolytic pattern of these specific traditional soft cheeses were different from other cheeses and this fact could influence their unique organoleptic properties. In fact, the slightly bitter flavour of Torta del Casar cheese may be due to certain sequences in the caseins which are particularly hydrophobic and, when excised by proteinasas can lead to bitterness (McSweeney & Sousa, 2000). Furthermore, it has been suggested that proteinases from C. cardunculus display a stronger preference for bonds between bulky hydrophobic residues than chymosin (Macedo & Malcata, Reference Macedo and Malcata1996). This suggests a higher contribution from αs1-casein hydrolysis than β-casein to low molecular weight nitrogen compounds in this cheese (Delgado et al. Reference Delgado, Rodríguez-Pinilla, González-Crespo, Ramírez and Roa2010).
With respect to the biogenic amine content of the cheese (Table 2), no influence was found of the rennet used for cheese making. The levels of the amines were lower than in other reports of this kind of product (Contreras et al. Reference Contreras, Izquierdo, Allara, García, Torres and Céspedes2007).
The results thus show a major development of proteolysis in the cheeses during ripening, resulting in the generation of AN corresponding to greater clotting activity of the rennet without any increase of biogenic amine (BA) production.
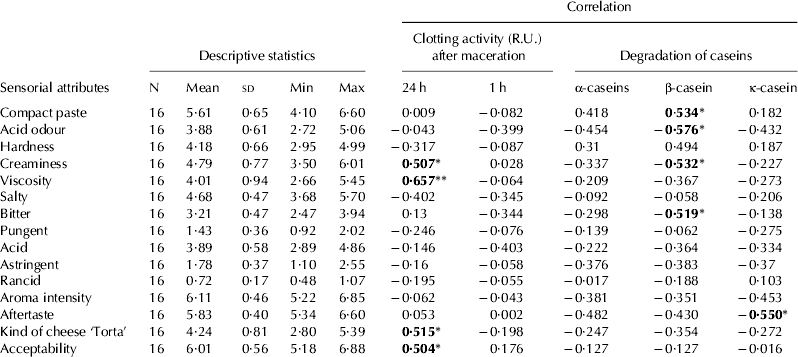
Table 3 presents the parameters of the sensorial analysis of the cheeses at the end of the ripening period, and their correlation with the characteristics of the rennet. The degradation of β-casein was positively correlated with the compactness of the cheese paste, while degradation of the casein is negatively correlated with the acidic taste. The degradation of β-casein appears to negatively influence the creaminess of the cheese, with the greater the degradation the less the creaminess. Some authors suggest that β-casein might be essential for the hardening of curd (St. Gelais & Haché, Reference St-Gelais and Haché2005). Likewise, β-casein degradation was negatively correlated with the bitter taste of the cheese, ie, the less the degradation, the more bitter the taste. So, a moderate proteolytic activity on β-casein is desirable to get the appropriate and typical Torta cheese characteristics of soft texture and slightly bitter taste.
Descriptive statistics of the sensorial attributes of the batches studied and correlations with technological properties of the vegetable rennets used
* P<0·05
** P<0·01
The κ-casein degradation was negatively correlated with the aftertaste of the cheese, with the less the κ-casein degradation, the greater the aftertaste in the cheese.
The clotting activity (24 h) influenced the creaminess, viscosity, the type of cheese and its acceptability, with a positive correlation in all cases. Thus, the greater the value of clotting activity, the greater the values of creaminess, viscosity, the ‘Torta’ type of cheese, and the acceptability. Cardoon coagulation leads to significantly softer, yellower, and creamier cheeses (Agboola et al. Reference Agboola, Chan, Zhao and Rehman2009).
Therefore the most appropriate cardoons for making this cheese are those which show greater clotting activity and moderate proteolytic activity on β-casein mainly, suggesting that the plants of Cluster 1 and Cluster 2 (Fig. 1) provide rennets with desirable characteristics for the cheese. Samples grouped in these clusters, correspond to the C. cardunculus extracts with higher peak areas of the protein profile obtained with capillary zone electrophoresis, and these peaks were identified as quality control marker extracts by Ordiales et al. (Reference Ordiales, Martín, Benito, Hernández, Ruíz-Moyano and Córdoba2012). So, a high ratio of clotting-to-β-casein proteolytic activity is an essential parameter for the classification of the cardoons used in the Torta del Casar process.
The use of controlled and characterised cardoons in the manufacturing process of Torta del Casar is fundamental to obtaining the homogeneous and quality product demanded by the Registry of the Protected Designation of Origin ‘Torta del Casar’.
The authors are grateful to M. Cabrero and C. Cebrián for technical assistance and PDO ‘‘Torta del Casar’’ for technical support.