



No CrossRef data available.
SEGREGATION AND STRATIFICATION: A Biosocial Perspective
Published online by Cambridge University Press: 11 March 2004
Abstract
Thirty years after the civil rights era, the United States remains a residentially segregated society in which Blacks and Whites inhabit different neighborhoods of vastly different quality. Given high levels of racial segregation and elevated rates of Black poverty, it is axiomatically true that African Americans will experience more neighborhood poverty than other groups. Moreover, because poverty is associated with crime and delinquency, they will also be exposed to far higher rates of social disorder and violence. In this article I argue that long-term exposure to social disorder and violence because of segregation produces a high allostatic load among African Americans, which leads, in turn, to a variety of deleterious health and cognitive outcomes. After summarizing recent research on stress and allostatic load, I specify a biosocial model of racial stratification and draw upon it to explicate well-documented racial differentials with respect to health and cognition.
Information
- Type
- STATE OF THE DISCIPLINE
- Information
- Copyright
- © 2004 W.E.B. Du Bois Institute for African and African American Research
W. E. B. DuBois himself first noted the close connection between a group's ecological and social circumstances (see Anderson and Massey, 2001). This fundamental insight was subsequently elaborated and extended by theorists and researchers associated with the Chicago School of Urban Sociology, beginning with the seminal work of Park (1926) and extending through studies by Drake and Cayton (1945), Duncan and Duncan (1957), and Taeuber and Taeuber (1965). All of these researchers recognized that within an urban residential landscape governed by market transactions, social mobility was to a great extent built on an underlying foundation of spatial mobility.
This perspective has come to be known as the spatial assimilation model (Massey 1985; Massey and Denton, 1985; Massey and Mullan, 1984). In order to gain access to better schools, safer streets, beneficial peer influences, lower insurance rates, and greater housing wealth, individuals and households move residentially. As they move up the economic ladder, they seek to translate their socioeconomic gains into improved neighborhood circumstances, which puts them and their children into a better position to progress further up the ladder of social mobility. Most new arrivals in American cities started out in central city neighborhoods of modest circumstances and then relied on this interplay between socioeconomic and residential mobility to ratchet themselves up the class hierarchy over time.
Because of pervasive racial discrimination, strong anti-Black prejudice, and continuing high levels of residential segregation, however, this path of upward mobility has been largely inaccessible to Blacks. Despite this fact, the connection between Black segregation and racial stratification remained largely unexamined from the mid-1960s through the mid-1980s, until the 1987 publication of William Julius Wilson's book, The Truly Disadvantaged. Wilson triggered renewed interest in the ecological bases of stratification by specifying the neighborhood as a critical factor mediating access to social, economic, and human capital (Massey 2001a).
Wilson noted that by the mid 1980s a remarkable transformation had taken place in urban America—poor Black neighborhoods were themselves getting steadily poorer, yielding a new geographic concentration of poverty that undermined the life chances of ghetto residents. Subsequent work showed a powerful interaction between high segregation and high poverty rates which caused poor African Americans to experience much higher concentrations of poverty than other groups (Massey et al., 1991; Massey and Eggers, 1990; Massey and Fischer, 2000). Subsequent research has confirmed the importance of neighborhoods in the process of stratification. In general, people who grow up and live in areas of concentrated poverty display lower levels of school completion, college attendance, and employment, and higher rates of incarceration, single parenthood, and welfare dependency (Brooks-Gunn et al., 1997; Sampson et al., 2002).
To date, theoretical speculation on how these deleterious outcomes are produced has focused on social mechanisms such as peer influences, cultural diffusion, the imitation of role models, access to networks, and collective efficacy (Jencks and Mayer, 1990; Sampson et al., 1997, 1999). Much less attention has focused on potential biosocial pathways. Recent research, however, suggests that biosocial mechanisms may be quite important in stratifying individuals across a variety of dimensions, not simply in the dimensions of health and mortality, but also in cognition and social status (Bremner 2002; McEwen and Lasley, 2002; Sampson 2003).
In this article, I review recent evidence to establish the continued salience of racial segregation in American society and link its perpetuation to ongoing prejudice and discrimination. Having done so, I outline a biosocial model that connects residential segregation to a variety of social, psychological, and health outcomes through its intervening effects on neighborhood poverty and allostatic load. My review of research on the causal linkages that comprise this model reveals only one link that remains to be established empirically. I conclude by outlining a research agenda to corroborate this link and suggest the potential importance of biosocial research to understanding the process of racial stratification in the United States.
THE PERSISTENCE OF RACIAL SEGREGATION
Some observers have considered trends in average Black–White segregation across all metropolitan areas. After noting the downward drift in the mean segregation values since 1970, they have concluded that segregation is declining in importance and that there is little cause for action or concern (Thernstrom and Thernstrom, 1997). This reading of the data, however, confounds two distinct trends. In the subset of U.S. metropolitan areas that contain a relatively small percentage of Black residents, levels of Black–White segregation have indeed been declining, often quite precipitously (Krivo and Kaufman, 1999; Massey and Gross, 1991). The downward trend has been especially pronounced in newer and smaller metropolitan areas of the south and west with relatively small Black populations, and in areas that contain colleges, military bases, and large stocks of post-1970 housing (Farley and Frey, 1994). In contrast, among older metropolitan areas that contain a disproportionate share of the nation's Black population, segregation levels remain stuck at very high levels. Considering the average across all metropolitan areas misrepresents the situation of African Americans because the declines are concentrated in places where few African Americans live.
Iceland et al. (2002) provide the latest data on levels and patterns of racial segregation. I draw upon their figures to consider the degree of residential segregation experienced by African Americans in the United States, dividing the population into three groups: those living in metropolitan areas characterized by low to moderate levels of segregation; those living in areas of high segregation; and those living in areas characterized by an intense form of racial isolation known hypersegregation (Massey and Denton, 1989, 1993). Iceland and colleagues present Black–White dissimilarity indices for all U.S. metropolitan areas in the year 2000. The dissimilarity index measures the unevenness of Black and White settlement across neighborhoods, and is the most widely used measure of residential segregation (see Massey and Denton, 1988).
Following convention, I define dissimilarity values of sixty or more as “high” and those below this mark as either low or moderate. I then divide highly segregated metropolitan areas into two categories: those that are hypersegregated and those that are not. Hypersegregation exists whenever Blacks display an index value of sixty or greater on four of the five dimensions of segregation defined by Massey and Denton (1988, 1989): evenness, isolation, clustering, centralization, and concentration. Some thirty metropolitan areas satisfy the criteria for hypersegregation.
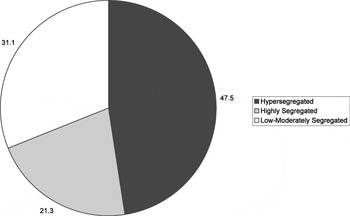
Rather than considering the share of cities experiencing each level of segregation, I focus on the percentage of African Americans living under each segregation regime. At the dawn of the twenty-first century, a clear majority of African Americans (almost 60%) lived in a metropolitan area that was highly segregated, and a substantial minority (some 41%) lived under conditions of hypersegregation. Not all Blacks live in metropolitan areas, of course, so in Figure 1, I present a pie chart that includes only metropolitan residents.

Segregation experienced by URBAN African Americans in 2000. Source: Iceland et al. (2002.)
As can be seen, nearly half of all metropolitan Blacks (48%) live under conditions of hypersegregation, and another fifth (21%) live under a regime of racial segregation that is “merely” high. In other words, among African Americans who reside in U.S. metropolitan areas, a distinct minority—less than a third—currently enjoy conditions of low or moderate residential segregation.
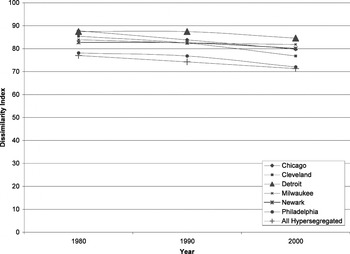
Recent trends in Black–White segregation within the nation's hypersegregated metropolitan areas are not very encouraging. Figure 2 presents Black–White dissimilarity indices for 1980, 1990, and 2000 for the five most segregated metropolitan areas and for the aggregate of all thirty areas that satisfy the criteria for hypersegregation. Across all hypersegregated areas, the average level of Black-White segregation went from seventy-seven in 1980 to seventy-one in 2000, a drop of just 8% in twenty years. In some metropolitan areas, change was barely detectable. For example, Chicago, Detroit, Newark, and Milwaukee display indices above eighty throughout the period. No other group in the history of the United States has ever experienced such high levels of segregation, even for a brief historical moment (Lieberson 1980).

Trends in Black-White residential segregation for hypersegregated metropolitan areas 1980–2000. Source: Iceland et al. (2002).
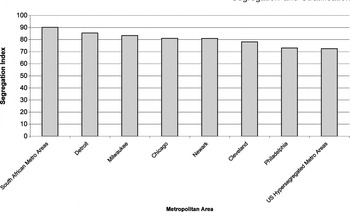
In their 1993 book, Massey and Denton referred to the regime of Black-White segregation in the United States as “American Apartheid.” Figure 3 brings this metaphor to life by comparing levels of Black–White dissimilarity in hypersegregated U.S. metropolitan areas with the degree of segregation experienced by Africans in the Union of South Africa under apartheid (taken from Christopher 1993). Whereas the de jure apartheid of South Africa produced an average dissimilarity index of ninety in South African urban areas as of 1991, the de facto apartheid in the United States yielded values that were not much lower: Eighty-six for Detroit in the year 2000, eighty-three in Milwaukee, and eighty-one in both Chicago and Newark. The average across all hypersegregated areas was seventy-two.

Degree of Black-White segregation in hypersegregated metro areas of the U.S. compared with metro areas in South Africa under apartheid. Sources: Christopher (1993); Iceland et al. (2002).
EXPLAINING RACIAL SEGREGATION
Data thus reveal that a majority of all African Americans, and the large majority of urban African Americans, continue to experience high levels of residential segregation in U.S. cities, and that about half of all urban Blacks and more than 40% of all African Americans experience hypersegregation, a degree of racial separation that is little different from that achieved in South Africa under apartheid. A variety of hypotheses have been offered to explain persistent Black segregation. The easiest hypothesis to dismiss is the hypothesis that racial segregation reflects socioeconomic differences between African Americans and Whites. This explanation proposes that because the former generally have lower incomes than the latter, more African Americans are channeled into lower-class neighborhoods, on average, than Whites.
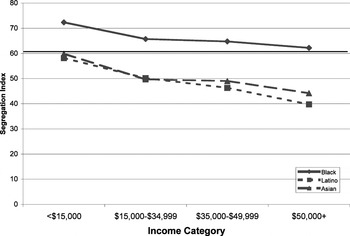
To test this hypothesis, Figure 4 presents Black–White dissimilarity indices (taken from Massey and Fischer, 1999) that were computed within income categories of the fifty largest metropolitan areas. A line corresponding to a high level of segregation is positioned just above the Segregation Index of 60 to facilitate interpretation. As can be seen, at all income levels the degree of Black–White segregation remains “high.” Although we observe a slight decline from the poorest to the lower-middle income category, thereafter the trend is flat. At all levels of income, Blacks are highly segregated. In contrast, among Latinos and Asians, the level of segregation is moderate among the poorest families and falls even lower as income rises. Indeed, the poorest Latinos and Asians (those earning under $15,000) are more segregated than the most affluent African Americans (those earning at least $50,000).

Segregation of Blacks, Latinos, and Asians from Whites by income in 1990. Source: Massey and Fischer (1999).
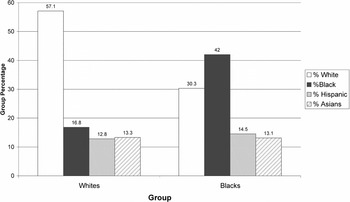
Other social scientists have argued that persistent racial segregation reflects the preference of African Americans for living in segregated Black neighborhoods (Clark 1992; Patterson 1998). When Charles (2003) tabulated nationally representative survey data on housing preferences, however, she found that Blacks expressed weaker preferences for co-residence with members of their own group than did Whites, Asians, or Latinos. The bar chart in Figure 5 shows the ideal neighborhood racial composition expressed by White and Black respondents to the General Social Survey. The data come from a “show card experiment” where respondents were shown a picture of a neighborhood containing blank houses and were asked to color them in to indicate their preferred distribution of Black, White, Asian, and Latino neighbors.

Ideal neighborhood desired by Whites and Blacks in 2000. Source: Charles (2003).
This figure makes it clear that Whites very strongly prefer same-race neighbors, but that Blacks do not. Whereas the ideal neighborhood for the typical White person is 57% White (containing just a smattering of other groups), the ideal neighborhood for Blacks is only 30% Black and would, in fact, contain a larger share of Whites (42% on average). As of the year 2000, therefore, the degree of in-group preference expressed by Whites was about twice that of Blacks whereas the willingness of African Americans to tolerate out-group neighbors was 2.6 times that of Whites.
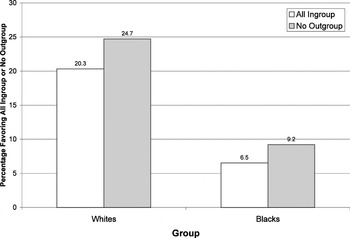
The exceptional nature of White racial intolerance is indicated forcefully by Figure 6, which shows the percentage of Whites reporting an ideal neighborhood that is all White (with no other groups present), and the percentage reporting an ideal neighborhood with no Blacks present (although allowing in other minorities). Some thirty years after the civil rights era, about a fifth of White Americans would still prefer to inhabit a neighborhood that was all White, and a quarter would prefer to live in a neighborhood that had no African Americans. In contrast, only 6.5% of African Americans wished to live in an all-Black neighborhood and just 9% preferred one with no Whites.

Preference for all in-group and no-outgroup neighborhoods in 2000. Source: Charles (2003).
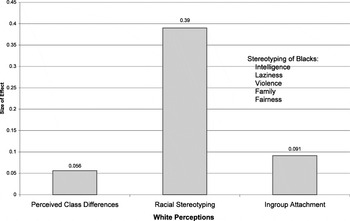
These racial preferences appear to be driven more by negative stereotyping toward African Americans than by attachment to other Whites. When Charles (2003) developed indicators of stereotyping, in-group attachment, and perceptions of class difference and used them to predict White avoidance of Blacks within neighborhoods, she found that avoidance was most powerfully explained by the holding of negative images about Blacks. As shown in Figure 7, the standardized effect of racial stereotyping on neighborhood preferences (0.390) was about seven times that of perceived class differences (0.056), and about four times that of in-group preferences (0.091).

Explaining White avoidance of Black neighbors. Source: Charles (2003).
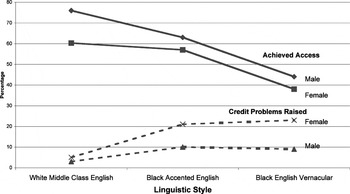
Black residential segregation is not only a function of anti-Black attitudes, of course. Substantial evidence suggests that discrimination remains a powerful force in American housing (Galster 1990a, 1990b; Ross and Yinger, 2002; U.S. Department of Housing and Urban Development 2002; Yinger 1993). The limitation of housing opportunities for African Americans was clearly demonstrated in a recent analysis done by Massey and Lundy (2001), who assigned auditors to call advertised rental units in the Philadelphia metropolitan area and inquire about the availability of apartments. Male and female speakers of White, middle-class English, Black-accented English, and Black English Vernacular called selected listings and read a standardized script inquiring about the unit's cost and availability. Results showed that callers who spoke an identifiably “Black” linguistic register achieved far less access to rental housing than callers speaking White, middle-class English.
Figure 8 shows the percentage of auditors who reached a rental agent and were told that a unit was still available. Access is always greater for Whites and a significant interaction between race, class, and gender appears to exist. Middle-class White males always achieve the greatest access, followed by middle-class White females and middle-class Black males. Behind them are lower-class Black males, and in last place are lower-class Black females (assuming that Black English Vernacular indicates lower class origins). Whereas White, middle-class males gained access to rental housing on 76% of their attempts, Black lower-class females did so on only 38% of theirs. Moreover, having gained access, Black females were far more likely to have the issue of credit problems raised and to be assessed application fees. Whereas rental agents mentioned credit worthiness as a potential problem to 3% of White, middle-class males, they did so to about a quarter of lower-class Black females.

Percentage gaining access to rental units and percentage having credit raised as an issue, Philadelphia 2000. Source: Massey and Lundy (2001).
SEGREGATION AND STRATIFICATION
Persistent residential segregation undermines the social and economic well-being of African Americans in a variety of ways. First, by restricting spatial mobility it necessarily limits social mobility because of the close interconnection between the two processes (Massey et al., 1987; Massey and Fong, 1990). Second, by segmenting Black housing demand and channeling White buyers away from Black neighborhoods, it reduces the value of Black housing, making it more difficult for African Americans to accumulate wealth in the form of home equity (Conley 1999; Oliver and Shapiro, 1995; Yinger 1993). As a result, Black wealth remains a small fraction of White wealth despite improvements in employment and earnings (Keister 2000). Third, segregation contributes to the spatial mismatch between the geographic placement of jobs and the residential location of the people who need them (Kain 1968; Preston and McLafferty, 1999).
Consistent with Wilson's (1987) emphasis on concentration effects and their role in perpetuating socioeconomic disadvantage, perhaps the most important mechanism of racial stratification operates through segregation's role in promoting the spatial concentration of poverty. As already noted, high levels of racial segregation interact with shifts in the distribution of income to concentrate poverty geographically (Massey and Fischer, 2000). Under conditions of high or rising Black poverty, segregation necessarily produces neighborhoods of concentrated poverty because the disadvantage created during economic downturns is confined to a small number of racially isolated neighborhoods that are clustered together in space and concentrated in high densities at the center of the metropolitan area.
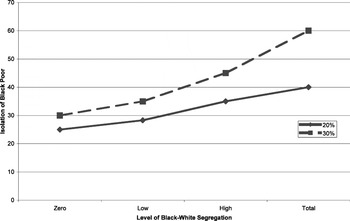
The interactive effect of rising segregation and increasing poverty is illustrated in Figure 9 (drawn from the simulation developed by Massey 1990). The bottom (solid) line shows what happens to the spatial concentration of poverty as the level of Black-White segregation increases from minimum to maximum, assuming a constant Black poverty rate of 20% and a fixed but moderate level of class segregation between poor and non-poor Black households. Under conditions of racial integration with a 20% poverty rate, the average poor African American lives in a neighborhood that is 25% poor (owing to modest class segregation). As racial segregation increases, however, the concentration of poverty nearly doubles. Under conditions of complete segregation, the average poor African American lives in a neighborhood where 40% of the families are poor.

Effect of racial segregation on concentration of Black poverty: simulation results for city of 128,000 inhabitants that is 25% Black and has class segregation. Source: Massey (1990).
The top (dashed) line shows what happens to the concentration of poverty when the rate of Black poverty is increased to 30%. Under conditions of racial integration, this shift in the distribution of income raises the concentration of poverty somewhat: the share of poor in the neighborhood of the typical poor black person goes from 25% to 30%. Under conditions of total segregation, in contrast, an already disadvantaged neighborhood environment becomes markedly worse, with the concentration of poverty rising from 40% to 60%. The difference between a neighborhood where the poverty rate is 25% and one where it is 60% is a slightly higher rate of poverty, and a much higher level of segregation.
SEGREGATION, STRESS, AND STRATIFICATION
As segregation concentrates poverty, it also concentrates anything that is correlated with poverty to create a uniquely disadvantaged social environment characterized by high rates of joblessness, welfare dependency, substance abuse, and single parenthood. Because crime is also associated with poverty, segregation likewise ends up concentrating social disorder and violence, yielding an unusually hostile and threatening environment to which poor African Americans must adapt (Anderson 1999; Massey 1995).
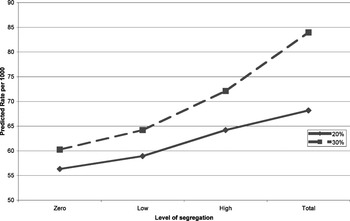
Figure 10 shows how segregation increases exposure to major crimes within neighborhoods because of the observed correlation between the poverty rate and crimes such as murder, rape, assault, robbery, burglary, larceny, and auto theft (taken from Massey 2001b). As can be seen, given complete integration and a Black poverty rate of 20%, the average poor African American is predicted to reside in a neighborhood with a crime rate of around 56 per 1000 inhabitants. In contrast, given total racial segregation and a Black poverty rate of 30%, the typical poor African American is expected to live in a neighborhood where the crime rate is 84 per 1000, and in some cases, 50% or higher.

How segregation increases exposure to major crime (murder, rape, assault, robbery, burglary, larceny, auto theft). Source: Massey (2001a, 2001b).
Because African Americans experience elevated rates of poverty and high levels of segregation, they are fated to live in environments characterized by much higher rates of crime and violence compared with other groups. This fact is clearly illustrated by recent data from the National Longitudinal Survey of Freshmen, which interviewed African Americans and Latinos entering twenty-eight selective colleges and universities in the Fall of 1999 (see Massey et al., 2003). Respondents were asked to estimate the racial composition of the schools and neighborhoods they inhabited at ages 6, 13, and 18, and to report the frequency with which they witnessed various examples of violence (shootings, stabbings, beatings, etc.) and social disorder (graffiti, prostitution, drunkenness, etc.).
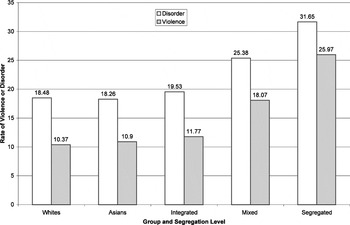
Using these data, Massey and Fischer (2002) constructed severity-weighted indices of exposure to violence and disorder. Figure 11 presents the resulting indices for African Americans and Latinos classified by the average level of segregation they experienced while growing up, and then compares these measures to indices computed for Asians and Whites. The figure clearly reveals that African Americans and Latinos who grew up in segregated schools and neighborhoods (>70% minority, on average) experienced far greater exposures to dangerous and threatening events than those who grew up in integrated circumstances (<30% minority). Those who came of age in racially mixed schools and neighborhoods (30%–70% minority) generally fell in-between.

Exposure of freshmen at selective schools to social disorder and violence in schools and neighborhoods while growing up. Source: Massey and Fischer (2002).
Consider the index of exposure to social disorder. African Americans and Latinos who grew up in integrated circumstances were exposed to about the same level of social disorder as Whites and Asians. Whereas the index of exposure to social disorder was 18.5 for Whites and 18.3 for Asians, it was only slightly higher at 19.5 for those African Americans and Latinos who grew up in integrated schools and neighborhoods. Among those coming of age in racially mixed settings, in contrast, the index was 25.4; and among those growing up under conditions of segregation, the index was 31.7. Thus, moving from integration to segregation increased a student's exposure to social disorder by around 63%.
The effect of segregation on exposure to violence is even more pronounced. Whereas the severity-weighted index of exposure to violence stood at 11.8 for African Americans and Latinos from integrated backgrounds—only slightly more than the values of 10.9 and 10.3 observed for Asians and Whites—it was 18.1 for minorities from racially mixed backgrounds and 26.0 for those from segregated backgrounds. In other words, segregation was responsible for increasing a student's prior exposure to violence by a factor of around 2.5 compared with Whites, Asians, and minorities who grew up within integrated schools and neighborhoods. Recall that these particular African Americans and Latinos had already been admitted into the most elite segment of American higher education, suggesting that the differential in exposure to disorder and violence by level of segregation would probably be even greater among African Americans and Latinos generally.
Large differences in lifetime exposure to disorder and violence carry important implications for the process of stratification because of the well-documented effects of chronic stress on human capacities. Frequent or prolonged exposure to disorder and violence within schools and neighborhoods because of racial segregation is quite likely to produce a chronic activation of the human stress response. To understand the manifold effects of stress on human beings, biomedical researchers have developed the concept of allostasis, which refers to the tendency of organisms to perpetuate their survival and maintain stability through bodily change in response to changes in the environment (McEwen and Lasley, 2002; Sterling and Ayer, 1988)
Whenever a person perceives an external threat, a brain organ known as the hypothalamus triggers an allostatic response, which is a complex interaction between the brain, the endocrine system, and the immune system. Upon perceiving the threat, the hypothalamus immediately signals the adrenal glands to release adrenaline (McEwen and Lasley, 2002). The flow of this hormone into the bloodstream accelerates the heartbeat, constricts blood vessels in the skin, increases blood flow to internal organs, dilates the bronchial tubes, triggers the release of fibrogen into the circulatory system (to promote clotting), releases glucose and fatty acids into the bloodstream from stored fats (to provide a ready source of energy), and signals the brain to produce endorphins (to mitigate pain).
While all this is going on, the hypothalamus simultaneously signals the pituitary gland to release an adrenocorticotropic hormone, which, in turn, causes the adrenal glands to secrete cortisol into the blood (McEwen and Lasley, 2002). Cortisol acts to replace the energy stores depleted by adrenaline, converting energy into glycogen and fat. Cortisol also promotes the conversion of muscle protein to fat, blocks insulin from taking up glucose, subtracts minerals from bones, and changes the external texture of white blood cells to make them “stickier” and more adhesive.
The allostatic response is nature's way of maximizing an organism's resources to meet an immediate, short-term threat. Long-term functions such as the building of muscle, bone, and brain cells are temporarily sacrificed to put more energy into the bloodstream for evasive or aggressive action (McEwen and Lasley, 2002). The hypothalamic-pituitary-adrenal (HPA) axis is common to all mammals and is designed for infrequent and sporadic use. Unlike most mammals, however, humans are capable of keeping the HPA axis turned on indefinitely because humans are capable of experiencing stress from ideas in addition to actual events. Human beings can anticipate threatening circumstances mentally—imagining events that might occur or recalling past traumas (Bremner 2002; McEwen and Lasley, 2002).
Repeated triggering of the allostatic response through chronic exposure to stressful events—as when someone is compelled by poverty and discrimination to live in a dangerous and violent neighborhood—yields a condition known as allostatic load. As allostatic load increases and persists over time, it has powerful negative effects on a variety of bodily systems (McEwen and Lasley, 2002).
One important set of effects is cardiovascular. Chronically elevated levels of adrenaline increase blood pressure and raise the risk of hypertension. Elevated fibrogen levels increase the likelihood of blood clots and increase the likelihood of thrombosis. The build-up of “sticky” white blood cells causes the formation of arterial plaques that contribute to atherosclerosis. Elevated cortisol levels, meanwhile, cause the production of excess glycogen and fat, raising the risk of obesity, while the suppression of insulin leads to excessive blood sugar and a greater risk of Type II diabetes (McEwen and Lasley, 2002).
Chronically elevated levels of adrenaline also disrupt the functioning of the vagal nervous system. This system is responsible for slowing down the heart rate and reducing bodily tension, acting as a “brake” for the ACH axis. Disruption of the vagal system contributes to the expression of a Type A personality, which is associated with aggressiveness, impulsiveness, frustration, and a low threshold for anger. People with Type A personalities often try to reduce tension by self-medicating with drugs, alcohol, and tobacco, and through these poor coping choices end up exacerbating allostatic load and causing secondary damage to vital organs such as the liver, lungs, and heart (McEwen and Lasley, 2002).
Allostatic load also compromises the human immune system. Long term exposure to elevated cortisol usually lowers the immune response to increase susceptibility to illness and infection (Schulz et al., 1998). In some circumstances, however, cortisol appears to overstimulate the immune system to mistakenly goad it into attacking targets within the body that don't normally pose a threat, leading to the expression of inflammatory diseases such as asthma and autoimmune diseases such as multiple sclerosis, arthritis, and Type I diabetes (McEwen and Lasley, 2002).
Finally, allostatic load has serious consequences for a variety of brain systems, and hence, influences cognitive functioning. The organ of the brain that is primarily responsible for the consolidation and storage of memory is the hippocampus (Carter 1999). Because stressful events are important to remember, the hippocampus is rich in cortisol receptors and people are indeed more likely to remember things that are associated with strong emotions (McEwen and Lasley, 2002). Our ancestors who recalled where and under what circumstances danger occurred were more likely to survive and pass on their genes. Chronically elevated cortisol, however, causes the receptors to become permanently saturated, leading to atrophy of the hippocampus and an impairment of memory, both short-term and long-term (Bremner 2002).
Excessive cortisol also appears to interfere with the normal operation of neurotransmitters such as glutamate, which is a critical ingredient in the formation of synaptic connections. By disrupting the production and operation of glutamate at the synapse, allostatic load inhibits long-term potentiation—the formation of a relatively permanent neural connection—which is the fundamental chemical event in human learning. In this way, chronic exposure to disorder and violence may compromise the very process of learning itself (McEwen and Lasley, 2002).
Finally, the hippocampus plays an important role in shutting down the HPA axis by reducing cortisol production. As a result, damage to it is doubly detrimental. Through its effect on the hippocampus, chronic stress creates a viscous cycle whereby excessive cortisol causes shrinkage of the hippocampus, which causes less inhibition of cortisol production, which also causes more hippocampal shrinkage (McEwen and Lasley, 2002). Over the long run, this cycle leads to dendritic remodeling, wherein neurons become shorter and sprout fewer branches, as well as to the suppression of neurogenesis, or the creation of new brain cells (Gould et al., 1998). Simply put, people who are exposed to high levels of stress over a prolonged period of time are at risk of having their brains re-wired in a way that leaves them with fewer cognitive resources (Bremner 2002; McEwen and Lasley, 2002).
A BIOSOCIAL APPROACH TO STRATIFICATION
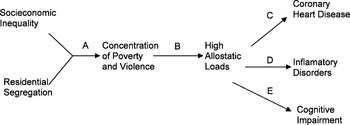
The foregoing review suggests a biosocial model of stratification that connects elements of social structure (racial segregation and income inequality interacting to produce concentrated poverty and its correlate, spatially concentrated violence) to distinctively high allostatic loads among African Americans (through their involuntary confinement in areas of concentrated poverty and violence) to an elevated risk of coronary heart disease (hypertension, thrombosis, atherosclerosis, diabetes, and obesity), a greater likelihood of inflammatory disorders (asthma, multiple sclerosis, arthritis), and impaired cognition (atrophy of memory, inhibition of synaptic learning, dendritic remodeling, and suppression of neurogenesis).
This hypothesized biosocial model is summarized in Figure 12 with the various links in the causal chain labeled A through E. Pathway A, the interaction of segregation and inequality to produce the concentration of poverty and its correlates is very well established in the research (Massey 1990, 2001b; Massey and Denton, 1993; Massey and Fischer, 2000). Likewise, pathways C, D, and E, which connect allostatic load to compromised health and cognitive outcomes, have been confirmed in a growing number of clinical and laboratory studies (reviewed in Bremner 2002; McEwen and Lasley, 2002). At the same time, Black-White differentials in mortality, and morbidity from a variety of causes are well-documented (Collins and Hawkes, 1997; Hayward and Heron, 1999; Hummer 1996; Manton et al., 1987; Stockwell and Goza, 1996), and persistent gaps in measured cognitive skills are similarly well known (Jencks and Phillips, 1998).

Biosocial model of racial stratification.
To date, these stubborn racial differentials with respect to health and cognition have been resistant to full explanation using the usual array of socioeconomic and demographic control variables (Geronimus et al., 1996; Hummer 1993; Navarro 1990; Phillips et al., 1998). Even after exhaustive background controls are added to statistical models, a significant racial gap generally remains, leading some observers to fall back on genetic explanations (Herrnstein and Murray, 1999; Rushton 2000).
The only link in the model that has not been established empirically is pathway B, the connection between concentrated poverty/violence and high allostatic loads. No matter how reasonable or logical this pathway might seem, researchers have not yet documented it empirically, though there is substantial evidence connecting segregation to excess Black mortality (Collins and Williams, 1999; Fang et al., 1998; Guest et al., 1998; Polednak 1997). The absence of empirical evidence for pathway B is not because investigators have tried and failed to produce such evidence. Rather, owing to a lack of appropriate data, no one has yet been in a position to document the connection.
What the field needs at this point is a dataset that contains biosocial markers indicating allostatic load gathered from a large multi-racial sample whose individual, family, and neighborhood characteristics are well-defined and measured at various points in time. Compiling such a dataset should be a top priority for stratification research. The leading candidate for such a dataset is the National Longitudinal Survey of Adolescent Health, a nationally representative survey of students enrolled in grades 7 through 12 during September 1994 through April 1995 (when they were roughly 12–18 years of age). Eligible respondents were re-interviewed during April–August of 1996 (when they were aged roughly 14–20) and again during August 2001 through April of 2002 (when they were aged 19–25). Some 15,197 respondents participated in the last wave of the survey, and each person was asked to contribute 15 cc of urine to test for the presence of sexually transmitted diseases. However, 2 ml were set aside and frozen with the date and time of the collection recorded. The existence of these urine samples provides a unique opportunity to generate data on the missing link between neighborhood conditions and health outcomes.
Although measurement of allostatic load from a single urine specimen is likely to be unreliable (Stewart and Seeman, 2000) and influenced by a variety of sources of unobserved heterogeneity (individual differences in diet, sleep, diurnal patterns of hormonal secretion, etc.), these problems are common in social science. The validity and reliability of measurement will probably be no less than for widely used social science indices of self-esteem, racial prejudice, liberalism-conservatism, and other attitudes. As with these indices, access to a large sample size compensates for the lack of reliability and provides sufficient statistical power to separate patterns from noise. To the extent that the measure is unreliable, however, error will mitigate against finding any significant relationship between neighborhood conditions and allostatic load. Thus, if statistically significant relationships are found between neighborhood conditions, cortisol, and health or cognitive outcomes, they can therefore be regarded as conservative. A better approach, of course, would be to build measurement of allostatic load into the next round of the Adolescent Health survey (currently planned for 2004–2005), using multiple biomarkers and assays to achieve greater validity and reliability.
Compiling a multi-level, longitudinal data file that links individuals with measures of allostatic load is important because the biosocial model just outlined offers plausible, objective accounts of racial differentials with respect to health, cognition, and mortality that do not require one to fall back on essentialist genetic theories, which make little sense when applied to the socially constructed category of race. In the biosocial model of stratification I have sketched, racial differentials are explained by the unique social structure to which African Americans are subjected in the United States. Among all U.S. social groups, only they simultaneously experience high rates of poverty and high levels of segregation. As a result, they experience far higher rates of neighborhood poverty than members of other groups (Massey and Eggers, 1990; Massey and Fischer, 2003), thus exposing them to higher levels of violence and disorder and driving up their allostatic loads to produce a host of negative health and cognitive outcomes that undermine their ability to compete in the socioeconomic order.
In the past, many social scientists have shunned biologically grounded explanations of racial gaps for fear of legitimizing racist theories or out of a fear of being labeled a racist; but an appreciation of the biosocial mechanisms by which racial differentials are produced turns these fears on their heads. Indeed, by understanding and modeling the interaction between social structure and allostasis, social scientists should be able to discredit explanations of racial difference in terms of pure heredity. In an era when scientific understanding is advancing rapidly through interdisciplinary efforts, social scientists in general—and sociologists in particular—must abandon their hostility to biological science and incorporate its knowledge and understandings into their work.
References
REFERENCES
Anderson, Elijah
(1999).
Code of the Street: Decency, Violence, and the Moral Life of the
Inner City.
New York:
Norton.
Anderson, Elijah and
Douglas S. Massey
(2001).
The sociology of race in the United States. In
Elijah Anderson and
Douglas S. Massey (Eds.),
Problem of the Century: Racial Stratification in the United States,
pp.
3–13.
New York:
Russell Sage Foundation.
Bremner, J. Douglas
(2002).
Does Stress Damage the Brain?: Understanding Trauma-Related
Disorders from a Neurological Perspective.
New York:
Norton.
Brooks-Gunn, Jeanne,
Greg J. Duncan, and
J. Lawrence Aber
(1997).
Neighborhood Poverty: Context and Consequences for Children.
New York:
Russell Sage Foundation.
Carter, Rita
(1999).
Mapping the Mind.
Berkeley, CA:
University of California Press.
Charles, Camille Z.
(2003)
The dynamics of racial residential segregation.
Annual Review of Sociology,
29:
67–207.Google Scholar
Christopher, A. J.
(1993)
Segregation levels in the late-apartheid city 1985–1991.
Tijdschrift voor Economische en Sociale Geografie,
83:
111–134.Google Scholar
Collins, Chiquita A. and
David R. Williams
(1999)
Segregation and mortality: The deadly effects of racism?
Sociological Forum,
14:
495–523.Google Scholar
Collins, James W. and
Elizabeth Hawkes
(1997)
Racial differences in post-neonatal mortality in Chicago: What risk
factors explain the black infant's disadvantage?
Ethnicity and Health,
2:
117–125.Google Scholar
Clark, William A. V.
(1992)
Residential preferences and residential choices in a multi-ethnic
context.
Demography,
30:
451–466.Google Scholar
Conley, Dalton
(1999).
Being Black, Living in the Red: Race, Wealth, and Social Policy in
America.
Berkeley, CA:
University of California Press.
Drake, St Clair and
Horace R. Cayton
(1945).
Black Metropolis: A Study of Life in a Northern City.
New York:
Harcourt, Brace, and Co.
Duncan, Otis D. and
Beverly Duncan
(1957).
The Negro Population of Chicago: A Study of Residential Succession.
Chicago:
University of Chicago Press.
Fang, Jing,
Shantha Madhavan,
William Bosworth, and
Michael H. Alderman
(1998)
Residential segregation and mortality in New York City.
Social Science and Medicine,
47:
469–476.Google Scholar
Farley, Reynolds and
William H. Frey
(1994)
Changes in the segregation of whites from blacks during the 1980s:
Small steps toward a more integrated society.
American Sociological Review,
59:
23–45.Google Scholar
Galster, George C.
(1990a)
Racial discrimination in housing markets during the 1980s: A review
of the audit evidence.
Journal of Planning Education and Research,
9:
165–175.Google Scholar
Galster, George C.
(1990b)
Racial steering in urban housing markets: A review of the audit
evidence.
The Review of Black Political Economy,
18:
105–129.Google Scholar
Geronimus, Arline T.,
John Bound,
Timothy A. Waidmann,
Marianne Hillemeier, and
Patricia B. Burns
(1996)
Excess mortality among Blacks and Whites in the United States.
New England Journal of Medicine,
335(21):
1522–1558.Google Scholar
Gould, Elizabeth,
P. Tanapat,
Bruce S. McEwen,
G. Flugge, and
E. Fuchs
(1998)
Proliferation of granule cell precursors in the dentate gyrus of
adult monkeys is diminished by stress.
Proceedings of the National Academy of Sciences USA,
95:
3168–3171.Google Scholar
Guest, Avery M.,
Gunnar Almgren, and
Jon M. Hussey
(1998)
The ecology of race and socioeconomic distress: Infant and
working-age mortality in Chicago.
Demography,
35:
23–34.Google Scholar
Hayward, Mark D. and
Melonie Heron
(1999)
Racial inequality in active life among adult Americans.
Demography,
36:
77–91.Google Scholar
Herrnstein, Richard J., and
Charles Murray
(1999).
The Bell Curve: Intelligence and Class Structure in American Life.
New York:
Free Press.
Hummer, Robert A.
(1993)
Racial differentials in infant mortality in the U.S.: An
examination of social and health determinants.
Social Forces,
72:
529–554.Google Scholar
Hummer, Robert A.
(1996)
Black-White differences in health and mortality: A review and
conceptual model.
Sociological Quarterly,
37:
105–125.Google Scholar
Iceland, John,
Daniel H. Weinberg, and
Erika Steinmetz
(2002).
Racial and Ethnic Residential Segregation in the United States
1980–2000.
Washington, DC:
U.S. Bureau of the Census.
Jencks, Christopher and
Susan E. Mayer
(1990).
The social consequences of growing up in a poor neighborhood. In
Laurence E. Lynn_Jr. and
Michael G. H. McGeary (Eds.),
Inner City Poverty in the United States, pp.
111–186.
Washington, DC:
National Academy of Sciences.
Jencks, Christopher and
Meredith Phillips
(1998).
The Black–White test score gap: An introduction. In
Christopher Jencks and
Meredith Phillips (Eds.),
The Black-White Test Score Gap, pp.
1–54.
Washington, DC:
The Brookings Institution Press.
Kain, John F.
(1968)
Housing segregation, Negro employment, and metropolitan
decentralization.
Quarterly Journal of Economics,
82:
175–197.Google Scholar
Keister, Lisa A.
(2000).
Wealth in America: Trends in Wealth Inequality.
New York:
Cambridge University Press.
Krivo, Lauren J. and
Robert L. Kaufman
(1999)
How low can it go? Declining Black–White segregation in a
multiethnic context.
Demography,
36:
93–109.Google Scholar
Lieberson, Stanley.
(1980).
A Piece of the Pie: Blacks and White Immigrants Since 1880.
Berkeley, CA:
University of California Press.
Manton, Kenneth G.,
Clifford H. Patrick, and
Katrina W. Johnson
(1987)
Health differentials between Blacks and Whites: Recent trends in
mortality and morbidity.
Milbank Quarterly,
65:
129–199.Google Scholar
Massey, Douglas S.
(1985)
Ethnic residential segregation: A theoretical synthesis and
empirical review.
Sociology and Social Research,
69:
315–350.Google Scholar
Massey, Douglas S.
(1990)
American apartheid: Segregation and the making of the underclass.
American Journal of Sociology,
96:
329–358.Google Scholar
Massey, Douglas S.
(1995)
Getting away with murder: Segregation and violent crime in urban
America.
University of Pennsylvania Law Review,
143(5):
1203–1232.Google Scholar
Massey, Douglas S.
(2001a).
The prodigal paradigm returns: Ecology comes back to sociology. In
Alan Booth and
Ann C. Crouter (Eds.),
Does it Take a Village? Community Effects on Children, Adolescents,
and Families, pp.
41–48.
Mahwah, NJ:
Lawrence Erlbaum Associates.
Massey, Douglas S.
(2001b).
Segregation and violent crime in urban America. In
Elijah Anderson and
Douglas S. Massey (Eds.),
Problem of the Century: Racial Stratification in the United States,
pp.
317–346.
New York:
Russell Sage Foundation.
Massey, Douglas S.,
Camille Z. Charles,
Garvey A. Lundy, and
Mary J. Fischer
(2003).
Source of the River: The Social Origins of Freshmen at
America's Selective Colleges and Universities.
Princeton, NJ:
Princeton University Press
Massey, Douglas S.,
Gretchen A. Condran, and
Nancy A. Denton
(1987)
The effect of residential segregation on Black social and economic
well-being.
Social Forces,
66:
29–57.Google Scholar
Massey, Douglas S. and
Nancy A. Denton
(1985)
Spatial assimilation as a socioeconomic process.
American Sociological Review,
50:
94–105.Google Scholar
Massey, Douglas S. and
Nancy A. Denton
(1988)
The dimensions of residential segregation.
Social Forces,
67:
281–315.Google Scholar
Massey, Douglas S. and
Nancy A. Denton
(1989)
Hypersegregation in U.S. metropolitan areas: Black and Hispanic
segregation along five dimensions.
Demography,
26:
373–393.Google Scholar
Massey, Douglas S. and
Nancy A. Denton
(1993).
American Apartheid: Segregation and the Making of the Underclass.
Cambridge, MA:
Harvard University Press.
Massey, Douglas S. and
Mitchell L. Eggers
(1990)
The ecology of inequality: Minorities and the concentration of
poverty, 1970–1980.
American Journal of Sociology,
95:
1153–1189.Google Scholar
Massey, Douglas S. and
Mary J. Fischer
(1999)
Does rising income bring integration? New results for Blacks,
Hispanics, and Asians in 1990.
Social Science Research,
28:
316–326.Google Scholar
Massey, Douglas S. and
Mary J. Fischer
(2000)
How segregation concentrates poverty.
Ethnic and Racial Studies,
23:
670–691.Google Scholar
Massey, Douglas S. and
Mary J. Fischer
(2002).
The long-term consequences of segregation.
Paper presented at the Annual Meetings of the Population Association of
America, Atlanta, Georgia.
Massey, Douglas S. and
Mary J. Fischer
(2003).
The geography of inequality in the United States 1950–2000.
In
William G. Gale and
Janet Rothenberg Pack, eds.,
Brookings-Wharton Papers on Urban Affairs 2003, pp.
1–40.
Washington, DC:
Brookings Institution.
Massey, Douglas S. and
Eric Fong
(1990)
Segregation and neighborhood quality: Blacks, Hispanics, and Asians
in the San Francisco metropolitan area.
Social Forces,
69:
15–32.Google Scholar
Massey, Douglas S. and
Andrew B. Gross
(1991)
Explaining trends in residential segregation 1970–1980.
Urban Affairs Quarterly,
27:
13–35.Google Scholar
Massey, Douglas S.,
Andrew B. Gross, and
Mitchell L. Eggers
(1991)
Segregation, the concentration of poverty, and the life chances of
individuals.
Social Science Research,
20:
397–420.Google Scholar
Massey, Douglas S. and
Garvey Lundy
(2001)
Use of Black English and racial discrimination in urban housing
markets: New methods and findings.
Urban Affairs Review,
36:
470–496.Google Scholar
Massey, Douglas S. and
Brendan P. Mullan
(1984)
Processes of Hispanic and Black spatial assimilation.
American Journal of Sociology,
89:
836–873.Google Scholar
McEwen, Bruce and
Elizabeth N. Lasley
(2002).
The End of Stress as We Know It.
Washington, DC:
The Joseph Henry Press.
Navarro, Vincente
(1990)
Race or class versus race and class: Mortality differentials in the
United States.
Lancet,
336:
1238–1240Google Scholar
Oliver, Melvin L. and
Thomas M. Shapiro
(1995).
Black Wealth/White Wealth: A New Perspective on Racial
Inequality.
New York:
Routledge.
Park, Robert E.
(1926).
The urban community as a spatial pattern and a moral order. In
Ernest W. Burgess and
Robert E. Park (Eds.),
The Urban Community, pp.
3–18.
Chicago:
University of Chicago Press.
Patterson, Orlando
(1998).
The Ordeal of Integration: Progress and Resentment in
America's “Racial” Crisis.
New York:
Perseus.
Phillips, Meredith,
Jeanne Brooks-Gunn,
Greg J. Duncan,
Pamela Klebenov, and
Jonathan Crane
(1998).
Family background, parenting practices, and the Black–White
test score gap. In
Christopher Jencks and
Meredith Phillps (Eds.),
The Black–White Test Score Gap, pp.
103–148.
Washington, D.C.:
Brookings Institution Press.
Polednak, Anthony P.
(1997).
Segregation, Poverty, and Mortality in Urban African Americans.
New York:
Oxford University Press.
Preston, Valerie and
Sara McLafferty
(1999)
Spatial mismatch research in the 1990s: Progress and potential.
Papers in Regional Science,
78:
387–402.Google Scholar
Ross, Stephen L. and
John Yinger
(2002).
The Color of Credit: Mortgage Discrimination, Research Methodology,
and Fair-Lending Enforcement.
Cambridge, MA:
MIT Press.
Rushton, J. Philippe
(2000).
Race, Evolution, and Behavior: A Life History Perspective (Third
Edition).
Port Huron, MI:
Charles Darwin Research Institute.
Sampson, Robert J.
(2003)
The neighborhood context of well-being.
Perspectives in Biology and Medicine,
46:
S53–S64.Google Scholar
Sampson, Robert J.,
Jeffrey Morenoff, and
Felton Earls
(1999)
Beyond social capital: Spatial dynamics of collective efficacy for
children.
American Sociological Review,
64:
633–660.Google Scholar
Sampson, Robert J.,
Jeffrey D. Morenoff, and
Thomas Gannon-Rowley
(2002)
Assessing ‘neighborhood effects’: Social processes and
new directions in research.
Annual Review of Sociology,
28:
443–478.Google Scholar
Sampson, Robert J.,
Stephen Raudenbush, and
Felton Earls
(1997)
Neighborhoods and violent crime: A multilevel study of collective
efficacy.
Science,
277:
918–924.Google Scholar
Schulz, P.,
C. Kirschbaum,
J. Prüssner, and
D. Hellhammer
(1998)
Increased free cortisol secretion after awakening in chronically
stressed individuals due to work overload.
Stress Medicine,
14:
91–97.Google Scholar
Sterling, P. and
J. Ayer
(1988).
Allostatis: A new paradigm to explain arousal pathology. In
S. Fischer and
J. Reason (Eds.),
Handbook of Life Stress, Cognition, and Health, pp.
629–649.
New York:
John Wiley and Sons.
Stewart, J. and
T. Seeman
(2000).
Salivary cortisol measurement.
John D. and Catherine T. MacArthur Research Network on Socioeconomic
Status and Health.
Webpage located at
www.macses.ucsf.edu/research/allostatic/.
Stockwell, Edward G. and
Franklin W. Goza
(1996)
Racial differences in the relationship between infant mortality and
socioeconomic status.
Journal of Biosocial Science,
28:
73–84.Google Scholar
Taeuber, Karl E. and
Alma F. Taeuber
(1965).
Negroes in Cities: Residential Segregation and Neighborhood Change.
Chicago:
Aldine.
Thernstrom, Stephen and
Abigail Thernstrom
(1997).
America in Black and White: One Nation, Indivisible.
New York:
Simon and Schuster.
U.S. Department of Housing and Urban Development
(2002).
Discrimination in metropolitan housing markets: National results
from phase I of HDS2000.
Washington, DC:
U.S. Department of Housing and Urban Development.
Wilson, William J.
(1987).
The Truly Disadvantaged: The Inner City, the Underclass, and Public
Policy.
Chicago:
University of Chicago Press.
Yinger, John
(1993).
Closed Doors, Opportunities Lost: The Continuing Costs of Housing
Discrimination.
New York:
Russell Sage.
Segregation experienced by URBAN African Americans in 2000. Source: Iceland et al. (2002.)
Trends in Black-White residential segregation for hypersegregated metropolitan areas 1980–2000. Source: Iceland et al. (2002).
Degree of Black-White segregation in hypersegregated metro areas of the U.S. compared with metro areas in South Africa under apartheid. Sources: Christopher (1993); Iceland et al. (2002).
Segregation of Blacks, Latinos, and Asians from Whites by income in 1990. Source: Massey and Fischer (1999).
Ideal neighborhood desired by Whites and Blacks in 2000. Source: Charles (2003).
Preference for all in-group and no-outgroup neighborhoods in 2000. Source: Charles (2003).
Explaining White avoidance of Black neighbors. Source: Charles (2003).
Percentage gaining access to rental units and percentage having credit raised as an issue, Philadelphia 2000. Source: Massey and Lundy (2001).
Effect of racial segregation on concentration of Black poverty: simulation results for city of 128,000 inhabitants that is 25% Black and has class segregation. Source: Massey (1990).
How segregation increases exposure to major crime (murder, rape, assault, robbery, burglary, larceny, auto theft). Source: Massey (2001a, 2001b).
Exposure of freshmen at selective schools to social disorder and violence in schools and neighborhoods while growing up. Source: Massey and Fischer (2002).
Biosocial model of racial stratification.
 You have
Access
- 220
- Cited by