Implications
The most common breeding goal of dairy sheep selection programs is the total milk yield; fat and protein contents are considered only in some breeds, mainly for economic reasons. As previously reported for dairy cattle, the existence of a genetic variability for fatty acid (FA) profile and the feasibility of the routine measurement of this trait at population level by Fourier-transform IR (FTIR) spectroscopy, may enable future scenarios of selection for such traits in sheep. Fat composition can be therefore included in breeding programs, with potential positive implications on the nutritional quality of milk and dairy products.
Introduction
Sheep milk represents about 1.52% of total milk produced worldwide (Food and Agriculture Organization of the United Nations Statistics Division, 2014). Approximately one-third of world sheep milk is produced in Europe, especially in Southern Countries (about 2 million tones in 2014). Total milk yield per lactation is the most common breeding goal for dairy sheep. Fat and protein contents are considered only in some breeds (Barillet et al., Reference Barillet, Marie, Jacquin, Lagriffoul and Astruc2001), mostly because of the high the cost of individual performance recording (Carta et al., Reference Carta, Casu and Salaris2009).
On the other hand, there is an increasing interest of consumers in milk nutritional quality, especially fat composition. Some FA have been found to have positive effects on human health. For example, antiatherogenic effects have been reported for the c9,t11-C18:2 (rumenic acid), which is the most abundant CLA isomer in milk (Banni et al., Reference Banni, Heys and Wahle2003). The diet is considered the most important source of FA composition variation (Nudda et al., Reference Nudda, Battacone, Boaventura Neto, Cannas, Francesconi, Atzori and Pulina2014). Other factors are season of production, flock, breed, stage of lactation and age (Nudda et al., Reference Nudda, McGuire, Battacone and Pulina2005; Signorelli et al., Reference Signorelli, Contarini, Annicchiarico, Napolitano, Orrù, Catillo, Haenlein and Moioli2008). The existence of genetic variability for FA composition in sheep milk has been highlighted (Sánchez et al., Reference Sánchez, San Primitivo, Barbosa, Varona and De La Fuente2010; Boichard et al., Reference Boichard, Govignon-Gion, Larroque, Maroteau, Palhiere, Tosser-Klopp, Rupp, Sánchez and Brochard2014) confirming previous reports in dairy cattle (Soyeurt et al., Reference Soyeurt, Gillon, Vanderick, Mayeres, Bertozzi and Gengler2007). However, a routine recording of milk FA composition is strongly hampered by phenotyping costs and logistics. An alternative to the standard method of gas chromatography (GC) is represented by the FA prediction using FTIR spectroscopy (FAFTIR). Good accuracies of FAFTIR predictions were recently reported for sheep (Caredda et al., Reference Caredda, Addis, Ibba, Leardi, Scintu, Piredda and Sanna2016) comparable with those observed in cattle (Soyeurt et al., Reference Soyeurt, Dardenne, Dehareng, Lognay, Veselko, Marlier, Bertozzi, Mayeres and Gengler2006). The FAFTIR exhibited genetic variability in cattle (Soyeurt et al., Reference Soyeurt, Gillon, Vanderick, Mayeres, Bertozzi and Gengler2007) and therefore could be proposed as accurate proxies of FA profile in large scale phenotyping of dairy animals.
This study was aimed at estimating genetic parameters of major individual FA and principal groups of FA in dairy sheep milk. Moreover, a comparison between results obtained from GC analysis and from FTIR predictions was carried out to evaluate the feasibility of a routine measurement of these traits at population level.
Material and methods
Animals and milk sample collection
The study was carried out on a sample of 989 Sarda breed ewes farmed in 48 flocks located in the four provinces of Sardinia (Italy). Ewes were sired by 480 rams (average number of daughter per sire 2.05). Animal distribution across parity, province and altitude of flock location is reported in Supplementary Table S1. Ewes were in mid–late lactation (average days in milk: 156±37.4). Individual milk samples (one per animal) were collected from April to July 2014 by the Provincial Association of Animal Breeders. Each sample was split into two aliquots; (i) one was analyzed in the milk lab of the Regional Association of Animal Breeders of Sardinia for routine milk composition, performed by FTIR spectroscopy and for the spectrum acquisition; (ii) the other was added with preservative and stored at −20°C for GC analysis.
Fatty acid analysis by gas chromatography
For the FA determination, milk fat was obtained by extraction, according to the method detailed in Nudda et al. (Reference Nudda, McGuire, Battacone and Pulina2005). A base catalyzed procedure (Nudda et al., Reference Nudda, McGuire, Battacone and Pulina2005) was followed to prepare FA methyl esters, that were separated and quantified using a 7890A GC System (Agilent Technologies, Santa Clara, CA, USA), equipped with a capillary column (CP-Sil 88; 100 m×0.250 μm i.d., 0.25 μm; Agilent Technologies), an autosampler (7693; Agilent Technologies) and a flame ionization detector. The gas carrier used was helium at 1 ml/min and 28 psi; 1 μl of sample was injected (split ratio 1 : 80). The initial temperature of the oven was set at 45°C, held for 4 min and increased at 13°C/min to 175°C. This temperature was held for 27 min, then it was increased at 4°C/min to reach the final temperature of 215°C, which was held for 35 min. The temperatures of injector and detector were both set at 250°C. Individual FA were identified by the comparison between each retention time, computed by a ChemStation Upgrade software (OpenLAB CDS GC; Agilent Technologies), with those of methyl ester standards and previously published isomeric profile as reported by Nudda et al. (Reference Nudda, McGuire, Battacone and Pulina2005). Individual FA were expressed as g/100 g of total FA. Groups of FA were calculated using the same FA profile for all milk samples. The FA profile did not include few FA (at very low concentration) that were not detected in a large number of analyzed samples. Short-chain FA, sum of FA from C4:0 to C10:0; medium-chain FA, sum of FA from C11:0 to C17:0; long-chain FA, sum of FA from C18:0 to C22:6; saturated FA, sum of the individual saturated FA; monounsaturated FA, sum of the monounsaturated FA; polyunsaturated FA, sum of the polyunsaturated FA; trans-FA, sum of the trans-FA, except CLA isomers and t11-C18:1; odd- and branched-chain FA, sum of odd- and branched-chain FA; de novo, sum of de novo synthesized FA (C6:0+C8:0+C10:0+C10:1+C11:0+C12:0+iso-C13:0+C14:0).
Fourier-transform IR analysis acquisition and fatty acids predictions
The milk composition analysis was carried with a MilkoScanFT6000 equipment (Foss Electric, Hillerød, Denmark). The spectrum for each individual sample was stored. Regions corresponding to wavenumber of water absorption (from 3 105 to 3 444 cm−1 and from 1 628 to 1 658 cm−1) were excluded. The partial least squares (PLS) regression was used to predict individual FA and groups of FA using the PLS procedure of SAS/STAT software version 9.4 (SAS Institute Inc.).
The whole archive was divided into two sub data sets: the first consisted of 700 ewes and it was used for estimating parameters of the prediction model; the remaining 289 animals were used to validate the model. In order to account for sampling effect, 100 replicates were performed assigning randomly animals to estimation and validation data sets, respectively.
The number of factors to be extracted in the PLS model was set to 18. It was assessed by fitting the PLS model on validation data based on the value of the PRESS (predicted residual sum of squares) statistics obtained by cross-validation (we used the split option of SAS proc PLS that performs validations using different sub-data sets of validations extracted from the whole data sets). The increase from 18 to 19 factors did not result in a significant decrease of PRESS. The PLS model was fitted on raw spectral data using the NIPALS algorithm.
Prediction accuracy for each individual or group of FA was assessed by comparing GC measured FA (FAGC) and FAFTIR in the validation data sets. In particular, were calculated the root mean squared error of prediction (RMSEP), the coefficient of determination (R 2) and the slope of the regression:
 $${\rm FA}_{{{\rm GC}}} \,{\equals}\,{\rm }b\,{\rm FA}_{{{\rm FTIR}}} {\plus}e$$
Genetic parameter estimation
Data were analyzed with the following animal model:
 $$\eqalignno{ y_{{ijklmnop}} &{\, \equals \,}\mu {\plus}{\rm PAR}_{i} {\plus}{\rm DIM}_{j} {\plus}{\rm LM}_{k} {\plus}{\rm PROV}_{l} {\plus}{\rm ALT}_{m} \cr & \hskip10pt {\plus} {\rm anim}_{n} {\plus}{\rm FTD}_{o} {\plus}e_{{ijklmnop}} $$
where y is the response variable; μ the overall mean; PAR the fixed effect of the parity class (1, … , 7, >7); DIM the fixed effect of the days in milking interval (<110, 110 to 140, 141 to 170, 171 to 200, >200); LM the fixed effect of the lambing month class (1: January; 2: February to March; 3: October to November; 4: December); PROV the fixed effect of the province of location of flocks (four provinces); ALT the fixed effect of the altitude of location of flocks (mountain⩾500; hill⩽500 and ⩾200; plain <200 m above the sea level, respectively); anim the random additive genetic effect of the animal (1, … , 6252), distributed as
 $\,\sim\,N\left( {0,\,{\bf A}\sigma _{a}^{2} } \right)$
, where A is the additive genetic relationship matrix and
 $\sigma _{a}^{2} $
the additive genetic variance the random effect of the flock-test date (FTD) combination (o = 1, … , 66); e the residual term.
The model was solved by using the restricted maximum likelihood methodology implemented in VCE v. 6.0 software (Groeneveld et al., Reference Groeneveld, Kovac and Mielenz2010). The A matrix included 6252 animals. Ancestors were traced back up to four generations, the average inbreeding coefficient was 1.7%.
Heritability was calculated as the ratio between the additive genetic variance
 $\left( {\sigma _{a}^{2} } \right)$
and the total variance
 $\left( {\sigma _{a}^{2} {\plus}\sigma _{{{\rm FTD}}}^{2} {\plus}\sigma _{e}^{2} } \right)$
; while the proportion of variance due to the FTD as the ratio between the FTD variance
 $\left( {\sigma _{{{\rm FTD}}}^{2} } \right)$
and the total variance.
Standard errors of estimates were based on the observed Hessian matrix (Groeneveld et al., Reference Groeneveld, Kovac and Mielenz2010). Genetic correlations among FAGC, and between each FAGC and corresponding FAFTIR were estimated by bivariate analysis with the same structure of [1]. Although a multiple-trait could be more appropriate then a bivariate model in the case of the genetic analysis of milk FA composition, a simplest multivariate structure was kept also considering the limited size of the data set analyzed.
Results and discussion
Descriptive statistics
Values of FAGC observed in the present work (Table 1), both individual and groups, are generally in agreement with previous reports on Sarda (Caredda et al., Reference Caredda, Addis, Ibba, Leardi, Scintu, Piredda and Sanna2016) and other sheep breeds. In particular, concentrations of t11-C18:1, c9,t11-C18:2, C18:2 n-6, C18:3 n-3 and polyunsaturated FA are similar to those reported for Spanish Churra (Sánchez et al., Reference Sánchez, San Primitivo, Barbosa, Varona and De La Fuente2010), Altamurana and Gentile di Puglia (Signorelli et al., Reference Signorelli, Contarini, Annicchiarico, Napolitano, Orrù, Catillo, Haenlein and Moioli2008) breeds. Although the concentration of most of the FA groups was quite similar to that reported for other ruminant species, such as cattle (Pegolo et al., Reference Pegolo, Cecchinato, Casellas, Conte, Mele, Schiavon and Bittante2016), goats (Tudisco et al., Reference Tudisco, Grossi, Calabrò, Cutrignelli, Musco, Addi and Infascelli2014) and buffaloes (Correddu et al., Reference Correddu, Serdino, Manca, Cosenza, Pauciullo, Ramunno and Macciotta2017), some differences can be observed. Of particular interest is the value for polyunsaturated FA that, in the present study, is approximately double the value observed in other cited species.
Mean, SD, minimum, maximum and CV of fatty acids (FA) and groups of FA measured in sheep milk by gas chromatography (N=989)

Expressed as g/100 g of total FA.
SCFA=short-chain FA, sum of the individual FA from C4:0 to C10:0; MCFA=medium-chain FA, included FA from C11:0 to C17:0; LCFA=long-chain FA included FA from C18:0 to DHA; SFA=saturated FA; MUFA=monounsaturated FA; PUFA=polyunsaturated FA; TFA=trans-FA, except conjugated linoleic isomers and t11-C18:1; OBCFA=odd- and branched-chain FA; de novo= sum of C6:0, C8:0, C10:0, C10:1, C11:0, C12:0, iso-C13:0, C14:0.
Predictions
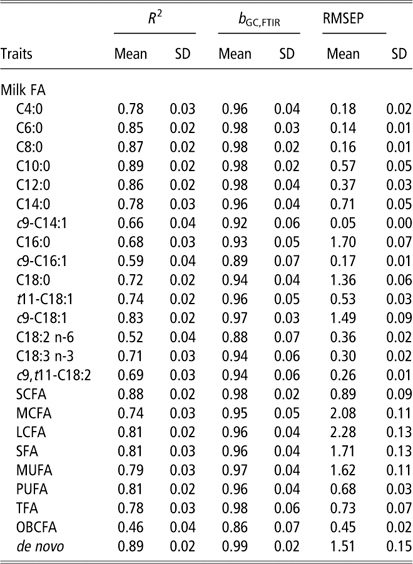
The R 2 for the validation data set (Table 2) ranged from moderate (about 0.50) to high values (about 0.90). A small variability was observed between the different replicates, as evidenced by the value of SD of the R 2. In general, the short-chain FA showed larger R 2 compared with the medium- and long-chain FA. No relevant differences were observed among FA grouped according to the unsaturation degree. As far as the metabolic origin is concerned, smallest and largest values were observed for odd- and branched-chain FA (0.46) and de novo FA (0.89), respectively. Similar pattern was obtained for the slope of the regression between FAGC and FAFTIR, in most cases very close to 1 (Table 2), and for the RMSEP. The comparison of the results of the present study with previous reports on FTIR predictions in dairy sheep does not show a definite pattern. As far as R 2 is concerned, some values agree other slightly differ. Differences can be explained with the sample structure, statistical model and validation method used. Caredda et al. (Reference Caredda, Addis, Ibba, Leardi, Scintu, Piredda and Sanna2016), for example, used a smaller size sample containing either individual and bulk milk, and performed a preselection of most informative wavelength spectra. Ferrand-Camels et al. (Reference Ferrand-Camels, Palhiere, Brochard, Leray, Astruc, Aurel, Barbey, Bouvier, Brunschwig, Caillat, Douguet, Faucon-Lahalle, Gelé, Thomas, Trommenschlager and Larroque2014) used also a smaller sample size (200 ewes), preselected informative regions and compared different prediction models. Moreover, in both studies, outlier animals were excluded from the analysis. In the present study no outlier elimination was performed in order to be as much closer a possible to field conditions.
Coefficient of determination (R 2), slope of regression between observed and predicted values (b GC,FTIR) and root mean squared error of prediction (RMSEP) of fatty acids and groups of fatty acids in sheep milk

Expressed as g/100 g of total FA; SCFA=short-chain FA, sum of the individual FA from C4:0 to C10:0; MCFA=medium-chain FA, included FA from C11:0 to C17:0; LCFA=long-chain FA included FA from C18:0 to DHA; SFA=saturated FA; MUFA=monounsaturated FA; PUFA=polyunsaturated FA; TFA=trans-FA, except conjugated linoleic isomers and t11-C18:1; OBCFA=odd- and branched-chain FA; de novo=sum of C6:0, C8:0, C10:0, C10:1, C11:0, C12:0, iso-C13:0, C14:0.
In previous studies on dairy cattle, FA with larger content in milk showed better prediction accuracies than those with lower content (Soyeurt et al., Reference Soyeurt, Dardenne, Dehareng, Lognay, Veselko, Marlier, Bertozzi, Mayeres and Gengler2006; De Marchi et al., Reference De Marchi, Penasa, Cecchinato, Mele, Secchiari and Bittante2011). Results of the present study, in agreement with previous reports in sheep, did not confirm a clear relationship between FA concentration and prediction R 2. As far as FA with positive implications for human health are concerned, t11-C18:1, C18:3 n-3 and c9,t11-C18:2 showed moderate values of R 2 (from 0.69 to 0.74), in general of similar magnitude of those reported for dairy sheep (Ferrand-Camels et al., Reference Ferrand-Camels, Palhiere, Brochard, Leray, Astruc, Aurel, Barbey, Bouvier, Brunschwig, Caillat, Douguet, Faucon-Lahalle, Gelé, Thomas, Trommenschlager and Larroque2014; Caredda et al. Reference Caredda, Addis, Ibba, Leardi, Scintu, Piredda and Sanna2016) and higher than those reported for dairy cattle (Soyeurt et al., Reference Soyeurt, Dardenne, Dehareng, Lognay, Veselko, Marlier, Bertozzi, Mayeres and Gengler2006; Lopez-Villalobos et al., Reference Lopez-Villalobos, Spelman, Melis, Davis, Berry, Lehnert, Holroyd, MacGibbon and Snell2014).
The R 2 has been suggested an indicator for evaluating the usefulness of model FA predicted values for practical applications. Soyeurt et al. (Reference Soyeurt, Dehareng, Gengler, McParland, Wall, Berry, Coffey and Dardenne2011) indicated 0.95 and 0.75 as R 2 thresholds for payment and breeding purposes, respectively. Thus, on the basis of results of the present work, FTIR – predicted values for important individual FA, such as C4:0, c9-C18:1 and for most of FA groups, including polyunsaturated FA and de novo FA, could be considered as phenotypes in breeding programs.
Heritability
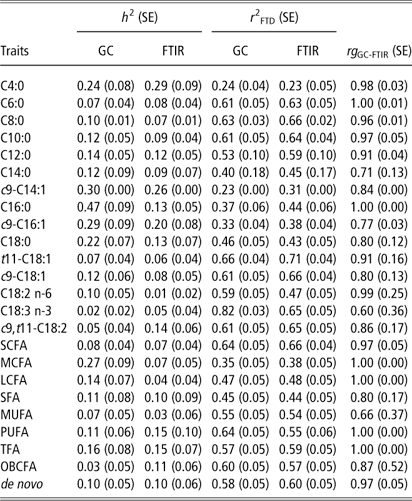
Heritability estimates exhibited low–to-moderate values (Table 3), for both individual and groups of FA. The largest values (0.47 and 0.27) were observed for C16:0 and medium-chain FA, for individual and group of FAGC, respectively. On the other hand, the contribution of FTD to the phenotypic variance was large for all FA (either measured and predicted), on average around 50% (Table 3), confirming the great influence of management and environmental factors on milk FA composition. For most of the investigated traits (measured and predicted) the value of r 2 FTD was higher than heritability, in agreement with previous reports in dairy cattle (Pegolo et al., Reference Pegolo, Cecchinato, Casellas, Conte, Mele, Schiavon and Bittante2016; Bonfatti et al., Reference Bonfatti, Vicario, Lugo and Carnier2017). The relevance of the FTD contribution should be evaluated also considering that other environmental factors affecting milk composition, such as altitude of location of flocks and lambing month, were included in the statistical model.
Heritability (h 2), flock test date contribution (r 2 FTD), and genetic correlations (rg GC-FTIR) estimated for individual fatty acids (FA) and groups of FA measured in sheep milk by gas chromatography (GC) or predicted by Fourier-transform infrared (FTIR) spectroscopy

Expressed as g/100 g of total FA; SCFA=short-chain FA, sum of the individual FA from C4:0 to C10:0; MCFA=medium-chain FA, included FA from C11:0 to C17:0; LCFA=long-chain FA included FA from C18:0 to DHA; SFA=saturated FA; MUFA=monounsaturated FA; PUFA=polyunsaturated FA; TFA=trans-FA, except conjugated linoleic isomers and t11-C18:1; OBCFA=odd- and branched-chain FA; de novo=sum of C6:0, C8:0, C10:0, C10:1, C11:0, C12:0, iso-C13:0, C14:0; SE=0.00 indicates a value lower than 0.001.
Compared to previous researches on dairy sheep, heritabilities estimated in the present study were generally larger than those reported for Churra (Sánchez et al., Reference Sánchez, San Primitivo, Barbosa, Varona and De La Fuente2010) and smaller than those reported for Lacaune (Boichard et al., Reference Boichard, Govignon-Gion, Larroque, Maroteau, Palhiere, Tosser-Klopp, Rupp, Sánchez and Brochard2014), respectively. Actually, it is quite difficult to make comparisons among studies. Literature on milk FA heritability in cattle and sheep is characterized by marked differences in magnitude of estimates. Pegolo et al. (Reference Pegolo, Cecchinato, Casellas, Conte, Mele, Schiavon and Bittante2016) pointed out that the poor concordance of results among studies can be due to a number of reasons: the analytical methods for measuring FA, the way FA composition is expressed, the sample structure (number of animals, breed, parity, distribution across farms, use of repeated records, lactation stage), the statistical model and way of calculating heritability. In the present study, a single sample per animal has been analyzed, according most of studies on FAGC heritability in dairy cattle (Schennink et al., Reference Schennink, Heck, Bovenhuis, Visker, van Valenberg and van Arendonk2008; Heck et al., Reference Heck, van Valenberg, Bovenhuis, Dijkstra and van Hooijdonk2012; Pegolo et al., Reference Pegolo, Cecchinato, Casellas, Conte, Mele, Schiavon and Bittante2016), but the sample was distributed across many flocks. The study on Churra ewes (Sánchez et al., Reference Sánchez, San Primitivo, Barbosa, Varona and De La Fuente2010) used a sample of comparable size with repeated records but a smaller number of flocks was considered (about one-third compared with the present study). On the other hand, Boichard et al. (Reference Boichard, Govignon-Gion, Larroque, Maroteau, Palhiere, Tosser-Klopp, Rupp, Sánchez and Brochard2014) used more than one thousand ewes in their study with repeated records, but only FAFTIR was used as phenotype.
In 17 out of 23 considered traits FAGC exhibited larger heritability compared with FAFTIR (Table 3). Sometimes these differences were rather relevant, as for C16:0, c9-C16:1, C18:0, C18:2 n-6, medium- and long-chain FA. Only in few cases, as C4:0, C18:3 n-3 and c9,t11-C18:2, polyunsaturated FA, and odd- and branched-chain FA heritability was slightly larger for FAFTIR. These results are in agreement with a previous report on dairy cattle (Bonfatti et al., Reference Bonfatti, Vicario, Lugo and Carnier2017) that found larger heritabilities for FAGC basically due to a relevant reduction of the additive genetic variance in FAFTIR. Moreover, in the present work, estimates of variance components for FAGC showed larger values of additive genetic variance (results not reported for brevity) than FAFTIR. In dairy sheep, larger heritabilities for FAFTIR were found (Boichard et al., Reference Boichard, Govignon-Gion, Larroque, Maroteau, Palhiere, Tosser-Klopp, Rupp, Sánchez and Brochard2014) in comparison with FAGC (Sánchez et al., Reference Sánchez, San Primitivo, Barbosa, Varona and De La Fuente2010), but in different studies. Pegolo et al. (Reference Pegolo, Cecchinato, Casellas, Conte, Mele, Schiavon and Bittante2016), suggested that differences heritability estimates between FAGC and FAFTIR could also be due to the different unit of measure used to express FA concentration. In the present work, both FAGC and FAFTIR were expressed in the same unit, as weight of a given FA on the weight of total FA.
Among individual FA, the value of heritability obtained for C16:0 (large for FAGC and moderate for FAFTIR, respectively) could suggest a possible use of this trait for the genetic improvement of milk nutritional quality. In fact, C16:0 represents the main FA of sheep milk, and it largely contributes to milk saturated FA content (mean of 38%). There is a general interest in reducing the dietary intake of saturated FA, due to their possible association with the risk of coronary heart disease events. Moderate-to-high values of heritability for C16:0 were found also in French sheep breeds (Boichard et al., Reference Boichard, Govignon-Gion, Larroque, Maroteau, Palhiere, Tosser-Klopp, Rupp, Sánchez and Brochard2014).
The moderate value of heritability obtained for C4:0 was quite unexpected from a metabolic point of view, being this FA is mostly produced by rumen bacteria. On the other hand, this FA exhibited one of the largest heritability values estimated in French dairy sheep breeds (Boichard et al., Reference Boichard, Govignon-Gion, Larroque, Maroteau, Palhiere, Tosser-Klopp, Rupp, Sánchez and Brochard2014). It is worth noticing that C4:0 is not completely out of enzymatic control. The milk concentration of this FA depends on its incorporation into triacylglycerols, operated by the diacylglycerol acyl-transferase in the mammary gland. Moreover, an effect of diacylglycerol acyl-transferase 1 gene polymorphism on milk C4:0 has been reported in sheep (Dervishi et al., Reference Dervishi, Serrano, Joy, Sarto, Somera, González-Calvo, Berzal-Herranzd, Molino, Martinez-Royo and Calvo2015). A high content of C4:0 in milk is desirable from a nutritional point of view, considering the important antineoplastic activity attributed to this FA (Parodi, Reference Parodi1999).
As far as most popular FA with reported positive implications on human health are concerned, low heritabilities were estimated for C18:2 n-6, C18:3 n-3 and t11-C18:1, c9, t11-C18:2, both FAGC and FAFTIR (Table 3). These results are in agreement with previous works on sheep (Sánchez et al., Reference Sánchez, San Primitivo, Barbosa, Varona and De La Fuente2010; Boichard et al., Reference Boichard, Govignon-Gion, Larroque, Maroteau, Palhiere, Tosser-Klopp, Rupp, Sánchez and Brochard2014) and cattle (Garnsworthy et al., Reference Garnsworthy, Feng, Lock and Royal2010; Pegolo et al., Reference Pegolo, Cecchinato, Casellas, Conte, Mele, Schiavon and Bittante2016). A high contribution of FTD to their phenotypic variance (on average 0.69) was found in this study, in agreement with studies on dairy cattle (Pegolo et al., Reference Pegolo, Cecchinato, Casellas, Conte, Mele, Schiavon and Bittante2016; Bonfatti et al., Reference Bonfatti, Vicario, Lugo and Carnier2017). Estimates of heritability and r 2 FTD for these FA obtained in the present work are consistent with their metabolic origin. They derive exclusively from the diet and can be, for a large part, modified by the biohydrogenation activity of rumen bacteria.
FA groups, apart from medium-chain FA measured by GC, exhibited low heritability (Table 3). Low values of heritability for FA groups have been observed also in Churra ewes by Sánchez et al. (Reference Sánchez, San Primitivo, Barbosa, Varona and De La Fuente2010). These authors explained the low heritability with the occurrence, in the same group, of FA with different metabolic origin that are negatively correlated. The observed moderate heritability of medium-chain FA is clearly due to the large value (about 0.5) found for its main component, the C16:0 (55% of medium-chain FA in the present study).
Genetic correlations among fatty acids measured by gas chromatography
The pattern of genetic correlations among individual FA is rather complex, due to the kind of relationships existing among them (some FA are precursors of others, for example) and to the metabolic pathways involved in their (co)variation. For brevity, only results for FAGC are reported in the present study.
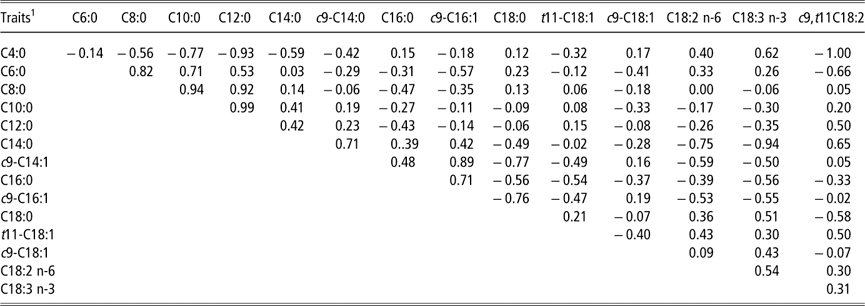
In general, genetic correlations exhibited a large variability in magnitude and sign (Table 4). An interesting example is represented by the C16:0. This FA showed the highest heritability (Table 3), a moderate positive correlation with C14:0, and moderate-to-high negative correlations with unsaturated C18 FA (Table 4). These findings, that partially agree with reports in cattle (Stoop et al., Reference Stoop, Van Arendonk, Heck, Van Valenberg and Bovenhuis2008; Mele et al., Reference Mele, Dal Zotto, Cassandro, Conte, Serra, Buccioni, Bittante and Secchiari2009), could open interesting perspectives for the improvement of sheep milk FA profile by genetic selection.
Additive genetic correlation among individual sheep milk fatty acids (FA) measured by gas chromatography

1 Expressed as g/100 g of total fatty acids.
By examining the genetic correlation pattern, some interesting insights on the relationships between different metabolic pathways could be drawn. The C6:0 to C14:0 FA are de novo synthesized in the mammary gland. The large negative genetic correlation between C4:0 and the de novo FA group (Supplementary Table S2), in agreement with a recent report on cattle (Pegolo et al., Reference Pegolo, Cecchinato, Casellas, Conte, Mele, Schiavon and Bittante2016), confirmed the role of this FA as substrate of mammary FA synthesis.
The negative genetic correlations between individual FA from C8:0 to C16:0 and polyunsaturated FA (Supplementary Table S2) may be partially explained with the mechanism of milk fat fluidity regulation (Gama et al., Reference Gama, Garnsworthy, Griinari, Leme, Rodrigues, Souza and Lanna2008). The mammary gland tends to maintain milk fat fluidity by balancing the concentration of unsaturated FA, characterized by a low melting point, with the regulation of saturated FA synthesis (Gama et al., Reference Gama, Garnsworthy, Griinari, Leme, Rodrigues, Souza and Lanna2008).
Genetic correlations between measured and predicted fatty acids
The inclusion of novel and expensive-to-measure traits in breeding programs by using proxies for their large-scale phenotyping basically depends on genetic correlations. If a large genetic correlation exists between the proxy (in this case FAFTIR) and the phenotype of interest (FAGC), an indirect selection could be efficiently implemented (De Marchi et al., Reference De Marchi, Toffanin, Cassandro and Penasa2014). In the present study, genetic correlations between predicted and measured traits were large (>0.6) for all investigated traits, on average 0.89±0.12 (Table 3). Values are in agreement with previous reports on dairy cattle (Rutten et al., Reference Rutten, Bovenhuis and Van Arendonk2010; Bonfatti et al., Reference Bonfatti, Vicario, Lugo and Carnier2017). As far as most important FA from a nutritional point of view are concerned, such as C4:0, t11-C18:1, c9,t11-C18:2, polyunsaturated FA and de novo FA, showed very large genetic correlations values (on average 0.94).
Genetic correlations between fatty acids and milk coagulation properties
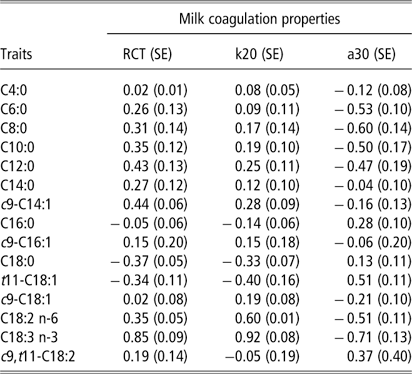
Sheep milk is almost all destined to cheese processing (Manca et al., Reference Manca, Serdino, Gaspa, Urgeghe, Ibba, Contu, Fresi and Macciotta2016). Therefore, a genetic improvement of milk nutritional quality should not neglect relationships between FA composition and milk technological properties. Genetic correlations between FAGC and milk coagulation properties (data available from another study carried out on the same sample of sheep) were then estimated (Table 5). In general, the rennet coagulation time and curd firming time were positively correlated with most of all individual FA, whereas the curd firmness was negatively related with FA content. The pattern, although the magnitude of correlation values exhibited a large variation, appears to indicate a worsening of milk coagulation properties with the increase of FA content in milk. However, it should be noticed that the C16:0, that is, the most abundant FA in sheep milk, showed no correlation with the rennet coagulation time, a weak negative with curd firming time and a moderate positive with curd firmness (i.e. favorable). Interestingly, polyunsaturated FA C18:2 n-6 and C18:3 n-3 presented high positive correlations with rennet coagulation time and curd firming time, and high negative correlations with curd firmness (i.e. unfavorable). Previous studies showed that physical properties of dairy products can be affected by milk FA composition; in particular, the texture can be reduced by a high unsaturation degree of milk FA (Chen et al., Reference Chen, Bobe, Zimmerman, Hammond, Luhman, Boylston, Freeman and Beitz2004). In some cases, cheeses with high polyunsaturated FA content tended to be rubbery (Czulak et al., Reference Czulak, Hammond and Horwood1974), characterized by high oiling-off at higher temperatures and by a loss of structure (Kieseker and Eustace, Reference Kieseker and Eustace1975). Therefore, a contemporary improvement of FA with positive effects on human health (polyunsaturated FA) and of milk coagulation properties should be carefully considered and appropriate selection indexes should be developed.
Additive genetic correlations between individual milk fatty acids and milk coagulation properties in sheep

RCT=rennet coagulation time ; k20=curd firming time ; a30=curd firmness.
Conclusions
Results of this work confirm that sheep milk FA composition exhibits genetic variability, even though of low-to-moderate magnitude. A large effect of environmental and management factors has been also highlighted. All these findings suggest the possibility of selecting for milk FA composition in sheep dairy breeds by using appropriate selection indices that could take account of the complex pattern of genetic correlation among the different FA. The prediction of FA composition by using the FTIR milk spectra yielded good results in terms of prediction accuracies. The high genetic correlations observed in most of cases between GC measured and FTIR predicted FA opens interesting perspectives for the large scale phenotyping of these traits for breeding purposes in dairy sheep.
Acknowledgments
This research was supported by the Regional Government of Sardinia (Grant no. CRP 61608 ‘Il latte Ovino della Sardegna’). The authors thank the Provincial Breeders Farmers Associations (AIPA) of Cagliari, Nuoro, Sassari and Oristano (Italy) for their support in sample collection; the laboratory of Associazione Regionale Allevatori della Sardegna (Oristano, Italy); the Italian Associations of Animal Breeders (AIA) and of Sheep Breeders (ASSONAPA) for providing pedigree information. The authors also acknowledge Dr G. Gaspa and A. Puledda for their help. This paper has been written in part on the basis of the fourth chapter of the PhD thesis of the 3rd author: Serdino, Jessica (2017) Genetic and phenotypic investigation of milk composition and technological properties in dairy sheep (available on http://eprints.uniss.it/11672/).
Declaration of interest
The authors declare no conflicts of interest.
Ethics statement
Milk samples were taken during the routinely milk recording according to ICAR protocols.
Software and data repository resources
None of the data were deposited in an official repository.
Supplementary material
To view supplementary material for this article, please visit https://doi.org/10.1017/S1751731118001659