I. INTRODUCTION
Fatigue failure is mainly the predominant failure mode for engineering structures and components and may account for 50–90% of all the mechanical failure modes. The relevant research on fatigue behaviors of materials can be traced back to the middle of the 19th century. In general, low-cycle fatigue is associated with high applied stress and relatively few fatigue cycles (<105), whereas high-cycle fatigue is associated with low applied stress and a fatigue regime of 105 to 107 cycles. The conventional fatigue limit normally is equal to the constant fatigue strength at 107 cycles. Below this fatigue limit, it is assumed that a material has an infinite life. However, according to the test results of carburized steel in 1984,Reference Naito, Ueda and Kikuchi1 the specimens continued to fail even over 108 stress cycles, which was in contrast to the classical concept of fatigue limit. In the following decades, based on the observations that an endurance limit can not be obtained for most engineering materials,Reference Bathias2–Reference Zettl, Mayer, Ede and Stanzl-Tschegg4 the fatigue property of materials in the very high cycle (VHC) fatigue regime (>107 cycles) has become a considerable research field.
With the aging of a great deal of industrial equipment, the security and reliability of many components in continuing service in VHC fatigue regime need urgently to be verified because these crucial components were designed based on the theory of fatigue limit when manufactured. Furthermore, modern engineering, such as aerospace industry, high-speed railway industry, heavy-load equipment, and so on, requires that most of the engine parts should be designed to have a minimum fatigue life of giga-cycles. On the other hand, the application of an ultrasonic fatigue testing system with a cyclic frequency of about 20 kHz solves the problems of extremely long-term test time and expensive test cost with an ordinary 100 Hz-level testing machine and offers a realistic method for performing efficient VHC fatigue tests.Reference Bathias5–Reference George, Seidt, Shen, Nicholas and Cross7 According to the above points, the deep study of VHC fatigue behaviors is attracting increased interests from industry.
FV520B steel, developed by Firth–Vickers Materials Lab in British, is a kind of martensitic precipitation hardening stainless steel and has been widely adopted for the manufacturing of mechanical equipment such as centrifugal compressor impeller due to its high strength, corrosion resistance and weld formability. These excellent mechanical properties of FV520B steel originated from the low carbon martensite matrix and precipitation phases (carbide or intermetallics particles) dispersed at the grain boundaries or intragranular dislocation positions in the process of aging treatment.Reference Zhou and Zhai8–Reference Fan, Guo, Wu, Crupi and Guglielmino11 Fatigue characteristic and mechanism of FV520B steel, even in the VHC fatigue regime, becomes an importance research topic in the field of manufacturing engineering.Reference Chu, Zhang and Li12–Reference Guo, Guo, Fan, Syed and Wu14 The present achievements on this field show that the S–N curve can be divided into two apparent segments by the initiation modes of fatigue crack transiting from surface initiation to subsurface initiation, just like many other materials.Reference Zhang, Wang, Sun, Zhang and Jiang15,Reference Zhang, Wang, Wang, Liu and Li16 In the VHC fatigue regime, fatigue cracks initiated from internal inclusions in almost all specimens, while granular bright facet and “fish-eye”, the most significant characteristic of giga-cycle fatigue fracture, were observed clearly.
However, the evaluation on the fatigue property of the actual compressor impeller was insufficient only based on the above axial tensile fatigue tests due to that the impeller was subjected to cyclic bending stress in service. The stress distribution for the specimen under axial test is different from that under bending test. Meanwhile, fretting wear, an accelerated surfaced damage, occurs when two contacting bodies are subjected to small relative oscillatory motion and cyclic stress loading at the contact interface, which is mainly caused by mechanical vibrations or some other force. In the process of fretting wear, severe surface damage leads to the formation of areas of high stress concentration and the initiation and propagation of fatigue cracks are located at the local stress concentration area. In this regard, the fatigue strength of metallic materials with fretting wear is significantly reduced compared to that without fretting.
In the present work, a double cantilever bean bending vibration fatigue test method was introduced so as to investigate the VHC bending fatigue behaviors of FV520B steel under fretting wear. The P–S–N curve was calculated based on experimental data. The fatigue failure mechanism was discussed through observations of fretting wear surface and fracture surface using scanning electron microscope (SEM).
II. MATERIAL AND METHODS
A. Experimental material
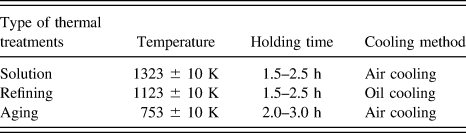
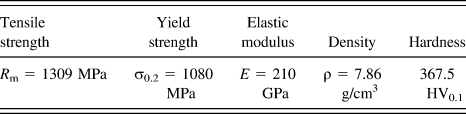
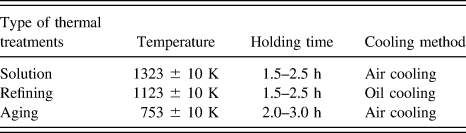
The material used in the present study is a martensitic precipitation stainless steel, FV520B, whose chemical composition (wt%) is listed in Table I. The material was prepared following the thermal treatments as listed in Table II for fatigue tests and the mechanical and physical properties were showed in Table III.Reference Fan, Guo, Wu and Zhao17
Chemical composition of FV520B steel (wt%).

Process of thermal treatments.
Mechanical and physical properties of FV520B steel.

B. Ultrasonic fatigue testing system
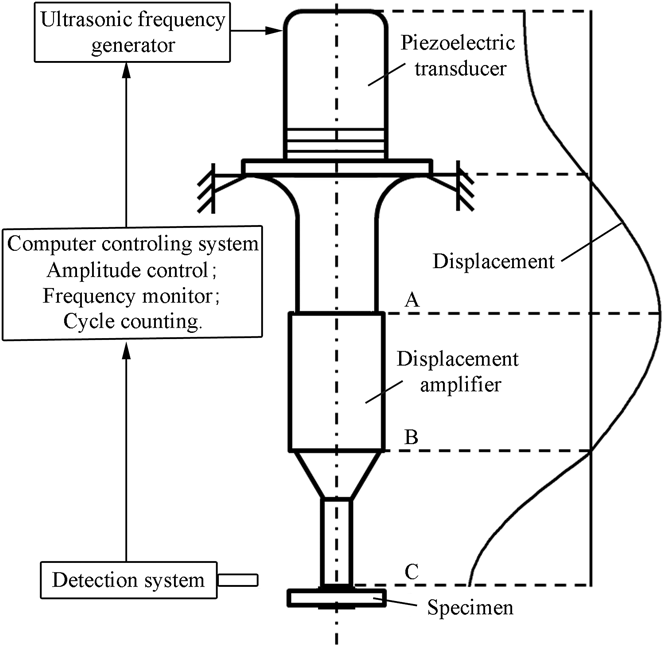
Fatigue tests were conducted using an ultrasonic bending fatigue testing system, which was composed of ultrasonic frequency generator, piezoelectric transducer, displacement amplifier, water-cooling unit, computer-controlling system, and detection system, as shown in Fig. 1. The piezoelectric transducer is devised to convert the ultrasonic sinusoidal electrical signal generated by the ultrasonic frequency generator into axial mechanical vibration with a frequency of 20 kHz, and the amplitude of vibration is not only related to the output voltage of the generator, but also to the amplification coefficient of displacement amplifier. The displacement distribution of the loading system is also given in Fig. 1. Maximum stress S max in the specimen is proportional to the maximum displacement A 0 of end part (C-cross section in Fig. 1) as follows:
 $${S_{\max }}{\rm{\ }} = {\rm{\ }}{A_0}{C_{\rm{S}}}\quad ,$$
where C S is a stress-displacement coefficient related to the specimen's density, elastic modulus, and geometrical shape. Prior to ultrasonic fatigue tests, the vibration amplitude A 0 is measured and calibrated by the detection system to acquire the amplification coefficient of displacement amplifier.Reference Marines, Dominguez, Baudry, Vittori, Rathery, Doucet and Bathias18 During the fatigue tests, the specimens were cooled by greenhouse water to avoid the effect of excessive temperature rising.
Ultrasonic bending fatigue testing system and displacement distributing curve.

C. Design of fatigue specimen
Specimen system composed of testing specimen and two clamps was designed, as shown in Fig. 2(a). In the process of bending fatigue test, the fretting wear occurs from the tiny relative displacement between tested specimen and the clamp. The modal analysis of the specimen system was applied using finite element analysis software ABAQUS.Reference Ding, Xie, Zhang, Zhang, Song and Zhou19,Reference Aghdam, Hassanifard, Ettefagh and Nanvayesavojblaghi20 The geometrical dimension of the titanium clamp with a density of 4.40 g/cm3 and an elastic modulus of 114 GPa is 10 mm × 10 mm × 2 mm with a comer radius of 1 mm. To simulate bending deformation of the testing specimen more accurately, a thin film of 0.01 mm, with a smaller elastic modulus by decreasing 4 orders of magnitude, was arranged to adhere the specimen and the clamps. According to the finite element results, the geometrical dimension of 22.3 mm × 10 mm × 2 mm was determined for the testing specimen. The frequency of bending vibration mode is 19.839 kHz and the error is 0.805% compared with the standard frequency 20 kHz, which is less than the tolerance of 2.5%. From the stress distribution cloud of the finite element model in Fig. 2(b), the maximum stress is located at the surface of fatigue specimen adhering to the comer of clamps. The future analysis can be performed based on the stress distribution curves at the different cross-sections along the Y direction, as shown in Fig. 2(c). It can be seen more clearly that the position of stress concentration, namely the critical site of fatigue failure, is about 4 mm far from the line of X = 0 at the specimen surface. And the degree of the stress concentration becomes smaller from the surface to the line of Y = 0.
Finite element analysis for fatigue specimen system: (a) finite element model; (b) contour plot of stress distribution; (c) stress distribution curve in X direction.
The displacement of the upper surface (C-cross section in Fig. 1) of the upper clamp can certainly be calculated by this method to deduce the stress-displacement coefficient C S according to Eq. (1).
III. RESULTS AND DISCUSSION
A. Microstructure characterization
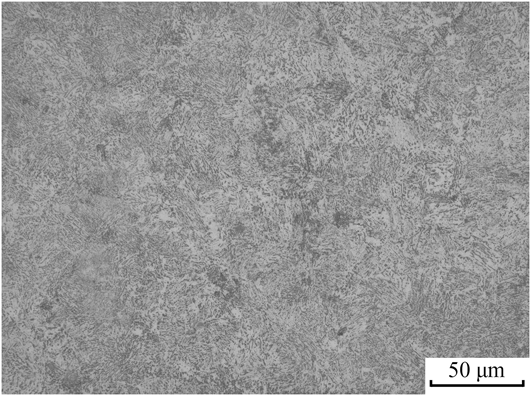
The microstructure of FV520B steel observed by using an optical microscope is shown in Fig. 3, which mainly consists of tempered lath martensite with fine organization structure, ferrite with uniform distribution and precipitation particles dispersed on the martensite matrix. These precipitation phases can refine the microstructure due to the fact that their pinning effect efficiently inhibits grain growth,Reference Nie and Mutoh21,Reference Lin, Cao, Wu, Yang, Chen and Huang22 which improves the resistance to crack initiation and propagation.
Metallographic structure of FV520B steel.
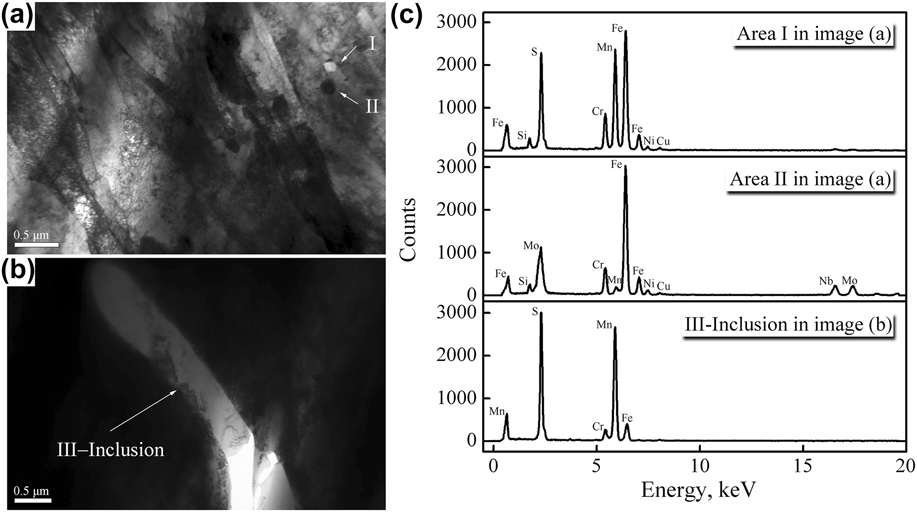
The microstructure and element composition of FV520B steel are also researched by means of transmission electron microscope (TEM) and energy-dispersive spectroscope (EDS), as showed in Fig. 4. It can be seen that the microstructure with lath martensite parallel substantially and the second phase particles are more clearly observed. Meanwhile some internal MnS inclusions are observed in the microstructure, which may become the main sources of fatigue cracks.
TEM photographs of base metal (a) and internal inclusion (b) with corresponding element composition (c).
B. P–S–N curve
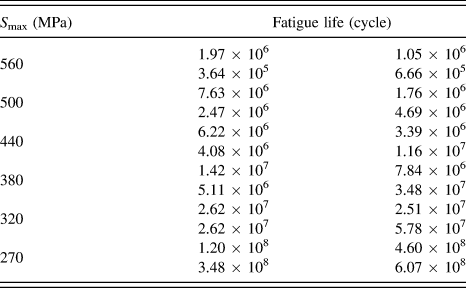
Ultrasonic bending fatigue tests under six stress levels were carried out. The experimental data are listed in Table IV. For each set of data under each stress level, it is assumed that they all conform to a two-parameter Weibull distribution, then the distribution function can be written as follows:
 $$P\left( N \right) = 1 - \exp \left[ { - {{\left( {{{{N \mathord{\left/ {\vphantom {N N}} \right. \kern-\nulldelimiterspace} N}}_{\rm{a}}}} \right)}^{\rm{\beta }}}} \right]\quad ,$$
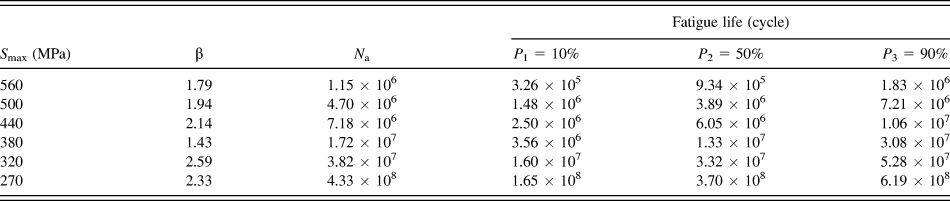
where P(N) is the failure probability of fatigue test, N is the fatigue life, β is the shape parameter or Weibull slope, a measure of the dispersion of sample data, and N a is the scale parameter. The two parameters are estimated by using a maximum likelihood estimation method and the analysis results are listed in Table V. Then the fatigue life under different failure probabilities (10, 50 and 90%) is calculated by the Weibull functions and is also listed in Table V.Reference Song, Xu, Wang, Liu and Piao23
VHC fatigue life of FV520B steel.
Weibull distribution function under each stress level.
The functional relationship between maximum stress and fatigue life can be represented by Basquin equation as follows:
 $$N{\rm{\ }}\mathop {{S_{\max }}}\nolimits^m = C\quad {\rm{,}}$$
where C and m are the Basquin exponents and can be solved by ordinary least squares method based on the fatigue life data in Table V.Reference Piao, Xu, Wang and Pu24 Then the P–S–N curve equations are obtained as follows for different failure probabilities.
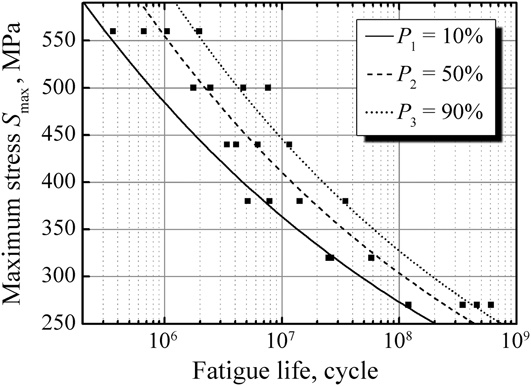
 $$P = 10\% :\quad N\mathop {{S_{\max }}}\nolimits^{8.03} = 3.76 \times {10^{27}}\quad {\rm{.}}$$
 $$P = 50\% :\quad N\mathop {{S_{\max }}}\nolimits^{7.64} = 9.18 \times {10^{26}}\quad {\rm{.}}$$
 $$P = 90\% :\quad N\mathop {{S_{\max }}}\nolimits^{7.45} = 5.61 \times {10^{26}}\quad {\rm{.}}$$
The corresponding P–S–N curve plots of FV520B steel are showed in Fig. 5. It can be seen that the fatigue life of FV520B decreases with the increase of applied stress S max and there exists no “conventional fatigue limit” in vicinity of 107 cycles.
P–S–N curve of FV520B steel under P = 10, 50, 90%.
C. SEM observations of fretting wear surface and fracture surface for fatigue specimen
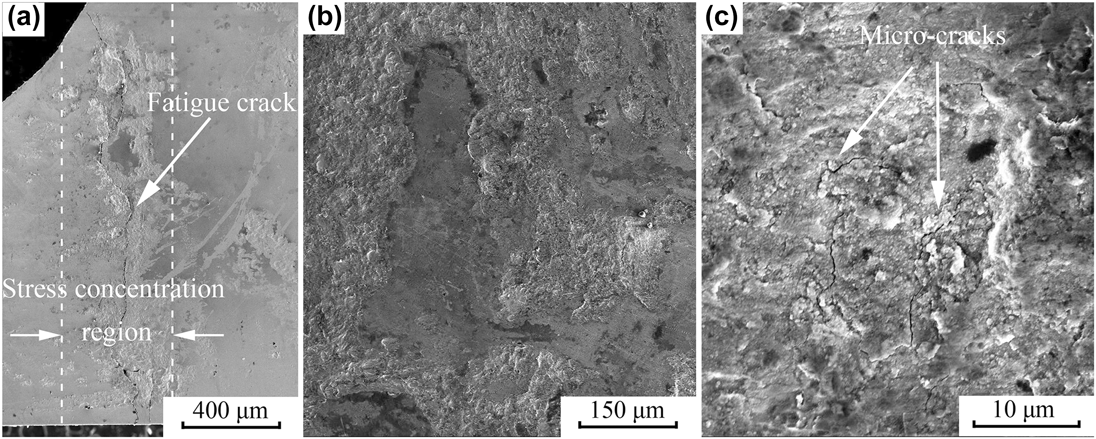
The microstructures of fretting wear surface of fatigue specimen with titanium clamp are firstly observed using SEM, as shown in Fig. 6. The main fatigue crack initiation and propagation area [Fig. 6(a)] exists mostly in the worn zone and is matched to the position of stress concentration derived from the finite element method in Sec. II. C. In the meantime, it can also be seen that the worn morphology is characterized by adhesion wear with lots of scrapes, surface moping, and surface peeling off [Fig. 6(b)]. The locally enlarged image [Fig. 6(c)] shows that a lot of microcracks originate in the chipping pit and the microcracks in stress concentration region grow to fatigue main cracks further.
SEM observations of fretting wear surface for fatigue specimen: (a) S max = 500 MPa, N = 7.63 × 10⁶; [(b) and (c)] S max = 320 MPa, N = 2.51 × 10⁷.
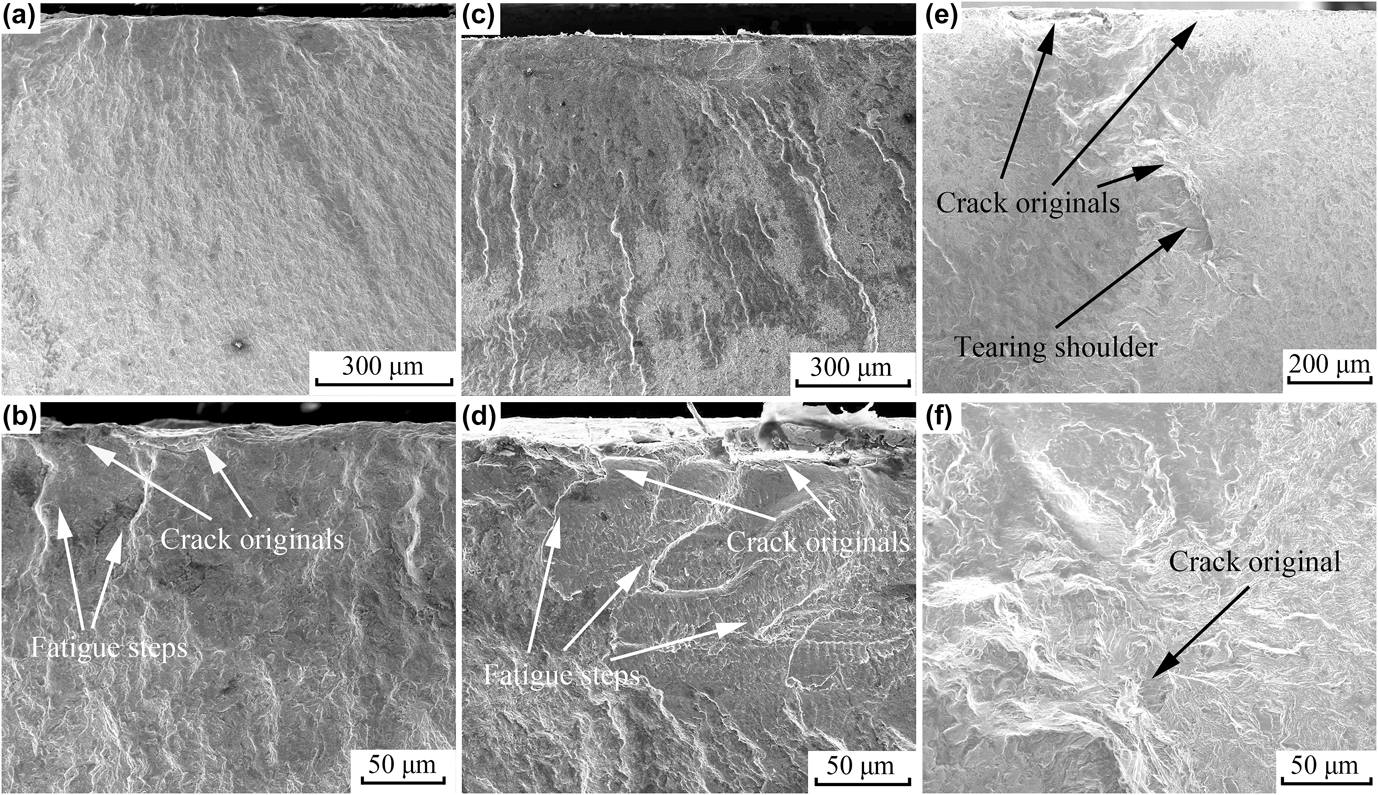
The observations of fatigue fracture surface under different stress levels (after different fatigue cycles) indicate that there are multiple fatigue crack initiation sites on the fractography and almost all the cracks initiate from surface wear scars of specimen as shown in Fig. 7. It is also observed clearly that the fracture morphology is of characteristics of typical fatigue striations and various patterns of fatigue steps. As for the damaged specimens of VHC fatigue, there exists internal fatigue crack source where tearing shoulder of fatigue failure is observed [Fig. 7(d)].
SEM observations of fracture surface for fatigue specimen: [(a) and (b)] S max = 560 MPa, N = 1.97 × 10⁶; [(c) and (d)] S max = 380 MPa, N = 3.48 × 10⁷; [(e) and (f)] S max = 270 MPa, N = 3.48 × 10⁸.
According to the above results, it is apparent that the fracture failure is attributed to fretting wear between fatigue specimen and titanium clamp and ultrasonic bending vibration fatigue.Reference Wang, Zhuang, Wang and Liu25–Reference Yildiz, Yetim, Alsaran, Celik, Kaymaz and Efeoglu28 At the initial stage of fretting wear, the summits of the asperities of the two nominally flat solid bodies are sheared in sliding contact between tested specimen and titanium clamp, which results in the formation of massive quantities of flake-shaped debris. These fragments may attach to the original surface (adhesion wear), or else may be squashed into loose wear particles. The wear particles that get trapped at the interface result in a three-body abrasive were with a series of grooves parallel to the direction of sliding. At the same time, the repeated cycles may induce the formation of subsurface or surface cracks [Fig. 6(c)], which eventually, after a certain number of cycles, will result in the breakup of the surface with the formation of large fragments, leaving large pits in the surface, also known as pitting.Reference Ding, Houghton, Williams and Leen29–Reference Wang, Zhuang, Wang and Liu31
In the worn zone, especially around the edge of wear scar, the initiation and propagation of fatigue cracks are accelerated due to the high strain, large deformation, and local stress concentration. Of course, the high bending stress at surface stress concentration area [Fig. 2(c)] is another reason to promote the fatigue cracks to initiate at the specimen surface. Certainly, these fatigue cracks are also prone to propagation through these pits as shown in Fig. 6(a). Under cyclic bending stresses, the numerous cracks originating at different sections continuously extend in a longitudinal manner along their respective sections. After the continuous intersection and connection of neighboring cracks, the leading fatigue crack forms perpendicularly to the specimen surface and results in ultimate fracture failure.Reference Wang, Zhang and Ge32–Reference Li, Sun, Zhang, Deng and Sakai34 During the failure process, the connection of small cracks gives rise to the formation of fatigue step while the connection of large cracks gives rise to the formation of tearing shoulder on the fractography.
IV. CONCLUSIONS
The VHC bending fatigue behaviors of FV520B steel under fretting wear were investigated by using ultrasonic fatigue testing system. For ultrasonic fatigue specimen, the geometrical dimensions were designed and the stress distribution was analyzed by the finite element method. The microstructure of FV520B steel was evaluated by means of optical microscope, TEM, and EDS. The P–S–N curve was calculated based on fatigue data. The micromorphology characteristics of fretting wear surface and fracture surface for fatigue specimen were analyzed by SEM. On the basis of the above discussion, it can be concluded that:
(1) The microstructure of FV520B steel is mainly composed of lath martensite, ferrite, and precipitation particles dispersed on the martensite matrix. Some internal MnS inclusions also distribute in the microstructure.
(2) The P–S–N curve of FV520B steel shows that there exists no “conventional fatigue limit” in vicinity of 107 cycles and the fatigue life decreases continuously with the increase of applied stress S max.
(3) Most of fatigue cracks are observed on fractography and initiate from the overlap region of fretting wear zone and stress concentration zone. The fracture failure for tested specimen is ascribed to fretting wear and bending vibration fatigue. The surface damage in the worn zone accelerates the initiation of numerous microcracks at different sections. Under cyclic bending stresses, the surface cracks grow along their respective sections, intersect, and connect with neighboring cracks. As a result, the leading fatigue crack forms perpendicularly to the specimen surface and leads to ultimate fatigue fracture.
ACKNOWLEDGMENTS
This paper was financially supported by NSFC (51535011), 973 Project (61328304).