1 Introduction
While examining 401(k) plans has offered considerable insight into private sector employees’ retirement saving, much less is known about saving in 403(b) plans, a related retirement saving plan option available to school district employees.Footnote 1 In fact, the internal revenue service (IRS) tax code that extended 403(b) coverage to public education employees predates the code that created 401(k) plans by about 17 years (1961 and 1978, respectively). Even so, 403(b) plans have traditionally been subject to less oversight and scrutiny than the heavily-regulated 401(k) plans.Footnote 2 Mercado (Reference Mercado2014) notes in an InvestmentNews article that the number of vendors and lack of oversight have created an environment where vendors charge high administration fees and offer investment options with high surrender charges. She writes, “Historically, the 403(b) market has been thought of as the Wild West of retirement savings plans.” Writing in Kiplinger's Personal Finance, Lankford (Reference Lankford2012) argues that the biggest differences between 401(k) and 403(b) plans are in plan management and marketing. She writes, ‘Instead of a menu of funds – with easy access to information about fees and performance – many school systems just hand out a list of sales reps.”
Despite this concern in the popular press, few systematic studies of 403(b) plans exist, in part due to the lack of large enough sample sizes in nationally-representative datasets. Nevertheless, the widely prevalent 403(b) plans have the potential to play an important role in teachers’ ultimate accumulation of retirement wealth. To shed light on the questions surrounding supplemental retirement saving in the public sector, this analysis focuses on how teachers and other school district personnel respond to the retirement saving options offered to them. Using survey data from school districts’ 403(b) plan managers merged with detailed administrative records from over half of all school districts in North Carolina, this study documents the variation in plan administration and offerings across districts and then explores the factors that predict individuals’ plan participation.
Beshears et al. (Reference Beshears, Choi, Laibson and Madrian2011) provide a discussion of how lessons learned from retirement saving in the private sector might be applied to the public sector. In general, the literature from the private sector may not be especially informative with regard to employee behaviors and the employer's impact on retirement savings in the case of public employees with access to 403(b) plans for several reasons. First, employer-provided supplemental retirement saving plans in the public sector differ from their counterparts in the private sector. In the private sector, employers generally provide a single tax-qualified defined contribution plan, such as the 401(k), and participation is optional. In contrast, full-time employees of public employers are typically enrolled in a mandatory pension plan, usually a defined benefit plan (Clark et al., Reference Clark, Craig and Sabelhaus2011). Most public employers also offer one or more voluntarily supplemental retirement saving plans. Public education employers, in particular, can offer three different types of tax-deferred supplemental retirement plan– the 403(b) plan, the 457 plan, and, occasionally, the 401(k) plan.Footnote 3
In addition, multiple vendors are often allowed to offer products to school district employees under these plans, whereas private-sector employers generally offer a 401(k) plan serviced by a single vendor. The fact that public employers can offer multiple retirement saving plans to their employees raises a number of important issues that have received little, if any, attention, since they do not arise in the private sector.
Furthermore, findings on supplemental plan participation from the private sector might not apply in the public sector because of differences in worker characteristics and preferences. Public employers may be providing different retirement saving plans in order to cater to these differences and target their workers’ distinct preferences. For example, North Carolina teachers who have at least 30 years of service are eligible to retire at any age. Thus, retirees who began their careers early in life can expect to spend 30 or more years in retirement. Younger retirement ages and longer periods spent in retirement mean that retirees are likely to need additional resources during their retirement years to accommodate an active lifestyle in the early years of retirement or to supplement a pension that does not keep pace with inflation.
On the other hand, given the level of guaranteed retirement income typically provided by defined benefit plans, public sector workers may have less need for additional retirement saving relative to most private sector employees for whom the 401(k) plan is their only employer-provided retirement plan. However, workers who change jobs or have short tenures may not be able to take advantage of the value of a defined benefit plan. Obviously, not all school personnel will remain with the district or within the state for their entire career. As a result, the value of their defined benefit pension will be significantly lower compared with those who remain for their entire career.Footnote 4
North Carolina schools offer a useful setting for an analysis of supplemental retirement savings plans because all of the employees are covered by the same defined benefit pension plan, the same health plan, and the same retiree health plan. In contrast, there is considerable variation across the districts in the supplemental retirement saving plan offerings and the management and oversight the district provides for these plans. While all North Carolina school districts offer the state-managed NC 401(k) plan, districts vary in whether they offer the state-managed NC 457 plan and/or a district-managed 457 plan. All districts also offer a 403(b) plan, but the management and oversight of the vendors and vehicles offered under each district's 403(b) plan vary considerably. Thus, our analysis has the advantage of examining workers who are covered by the same mandatory pension plan, but who have access to a broad menu of supplemental retirement plan options that differ remarkably from district to district.
2 Retirement saving plans in North Carolina school districts
This study relies primarily on individual-level payroll records from March 2013 collected from more than half of the school districts in North Carolina. These data include basic economic and demographic information on school district employees, in addition to individual-level contributions to the supplemental plans offered in each district. The payroll data are merged with responses to a survey of each school district's Chief Finance Officer, Director of Business Operations, or Director of Human Resources.Footnote 5 The survey asked for information on all retirement saving plans offered by each district, the management and oversight of these plans and vendors, as well as for information about any employer-provided communications and other informational efforts related to retirement plans.Footnote 6 See Clark et al. (Reference Clark, Hanson, Morrill and Pathak2015) for detailed information about the data.
The richness of the combined individual- and district-level data allow us to investigate a number of questions concerning the influence of retirement plan management and the availability of retirement-related information on employee retirement saving behavior. Using this data set, we estimate the saving choices of teachers within and across school districts. Public school personnel in all school districts across North Carolina are enrolled in the Teachers’ and State Employees’ Retirement System (TSERS) and in the State Health Plan (SHP).Footnote 7 TSERS and the SHP are broadly representative of pension and health plans available to teachers in other states.Footnote 8 While most of the annual salary for school district personnel is paid by the state according to a fixed pay scale, most districts provide a local supplement to some employees’ state-funded base salary. Average annual supplements for teachers vary from zero dollars in six districts to more than $6,000.Footnote 9 Other employee benefits (e.g., vacation) and job requirements (e.g., number of work days and number of hours worked per day) are similar throughout North Carolina's school districts.
Historically, 403(b) retirement saving plans have been the most prevalent retirement saving plan available to teachers and other school district employees.Footnote 10 In addition to district-managed 403(b) plans, school districts may offer state-managed 401(k) and 457 plans as well as district-managed 457 plans.Footnote 11 Importantly, tax treatments differ for the various plans. There is a single combined annual contribution limit for 401(k) and 403(b) plans while there is a separate limit on contributions for 457 plans. The similarity of these plans and their tax treatment raises the question of why a school district would want to spend resources to offer two or more saving plans.
Public employers must consider three important elements concerning retirement saving plans when deciding upon the number and type of retirement options to offer to their employees: (a) the number and type of tax-qualified saving plans to offer; (b) the number of vendors allowed to provide retirement plans and products to employees under each tax-qualified plan type offered; and (c) the extent of responsibility to assume in overseeing the plan(s) and in communicating information about the plans, vendors, and fees to district personnel.Footnote 12
It should be noted that the plan offerings by districts often reflect the various objectives of school board members, influential employees within the district, and finance and human resource administrators charged with the day-to-day operations and administration of the district’s plan(s) and product(s).Footnote 13 Finance and business operations staff may be concerned about the time needed to oversee plans and the expertise necessary to develop and manage an optimal variety of plan types and vendors. Human resource staff may be concerned with the time and expertise required to select the most effective methods of communicating retirement plan information to employees, the time needed to develop such materials, and the expertise required to offer guidance to employees attempting to choose a supplemental retirement plan. While all districts offer at least two optional savings plans, the assortment of supplemental plan offerings and vendors may also reflect the preferences of workers to save.
The neoclassical model of individual choice suggests that more plans and vendors will lead to higher participation rates, all else equal, since individuals are more likely to find a plan that suits them (i.e., is above their reservation price for purchasing). However, behavioral economics suggests two alternative scenarios. First, too many choices could lead to ‘information overload.’Footnote 14 On the other hand, a new or particularly aggressive vendor might make the need to save more salient and increase participation in all plans. Sims (Reference Sims2003) introduces a model of rational inattention whereby economic agents face constraints on the ability to process large amounts of information. Applying this idea to our setting, the advertising and promotional activities of one plan or vendor might have a spillover effect such that participation increases overall. In a static environment, we are not able to provide a clean test between these hypotheses. However, we do consider the role of plan design, management, and oversight in employee participation in supplemental retirement saving plans.
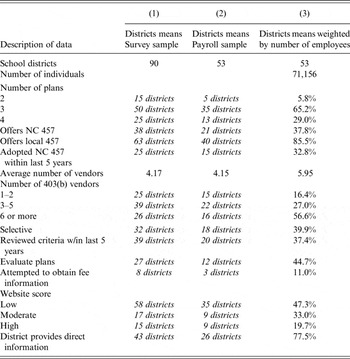
We begin with an overview of plan design, management, and oversight. Table 1 presents district characteristics for the 90 districts that responded to our survey and for the 53 districts with payroll records that were successfully merged with survey responses. Columns (2) and (3) provide payroll data at the district level and at the individual level, respectively. We use payroll records for 71,156 full-time employees in our analysis.Footnote 15 Table 1 illustrates a wide variety of plan offerings, plan oversight, and management decisions.
Sample means and descriptive statistics

Notes: Numbers in italics are the count of districts that fall into each category. Data are gathered from the district survey. Columns (2) and (3) restrict the sample to districts that provided payroll data, with population weights applied in Column (3) using employment levels from the payroll data.
2.1 Choice of plan types
Historically, 403(b) plans have dominated the retirement plan market among school districts, possibly due to the 403(b) plan's comparatively more relaxed federal regulations governing plan sponsors and vendors or the fact that these plans were available to school personnel years prior to the availability of other forms of retirement saving plans. School administrators often have to decide whether to provide access to a district-managed 457 plan and whether to allow their employees to participate in state-managed 401(k) or 457 plans. State-managed 401(k) and 457 plans tend to be more closely monitored, have fewer vendors, and vendors are more likely to have been selected through a formal bidding process. Why and how school districts decide to adopt and manage alternative retirement saving plans is an interesting puzzle.
As shown in the first portion of Table 1, all school districts in our sample offer a 403(b) plan and the NC 401(k) plan – North Carolina's state-managed 401(k) retirement saving plan. Thus, all districts in our sample offer at least two plans. Further, 75 out of 90 (over 80%) of the districts allow their employees to select from at least three different retirement saving plans. Twenty-five of the 90 districts added the state-managed NC 457 plan within the past 5 years.Footnote 16 Among the districts included in our individual-level analysis, the patterns are similar and indicate variation in plan offerings.
2.2 Choice of plan characteristics and oversight
The management of 403(b) plans differs significantly from most 401(k) plans in both the public and private sectors and in that multiple vendors are allowed and there are relatively fewer restrictions placed by the IRS on plan characteristics and vendor practices.Footnote 17 In some states, the 403(b) plans are overseen at the state level, meaning that centralized state agencies are responsible for selecting, regulating, and overseeing the vendors approved to offer products in the local school districts’ 403(b) plans within the state. In other states, local school districts are entirely responsible for managing their supplemental retirement saving plans. The benefit programs offered by state and local governmental employers are exempt from the participation, vesting, reporting, and fiduciary standards of The Employee Retirement Income Security Act of 1974 (ERISA).Footnote 18
In addition to influencing employees’ participation in retirement saving at the extensive margin, the degree of control the plan sponsor maintains over the plan is an important factor influencing wealth accumulation. Some school districts allow all interested vendors to offer 403(b) products, provided they meet certain specified criteria. This open access environment can result in a large number of vendors offering products to employees. Since each vendor offers numerous investment options, employees face the significant challenge of finding information on the providers and their investment options and comparing the differences between them.Footnote 19 In such an open access environment with little district oversight, individual teachers and school district employees bear the burden of deciding which vendor among all of those approved to offer a 403(b) plan provides the best mixture of products, services, and fees. Of course, employers can reduce the informational cost by providing information directly to employees, such as an online comparison of fees and investment options, as discussed further below. Interestingly, only 8 out of the 90 districts that responded to the survey reported even attempting to obtain fee information from the 403(b) vendors that offer products to their employees. Although we do not have systematic evidence in this study, less oversight and no formal selection process typically results in vendors charging higher fees for the same products.Footnote 20
The management and oversight practices in North Carolina districts vary from being completely open access to highly controlled environments. Although we do not have information on the reasons why each district chose the management model in place, we can evaluate the associations between different management models on retirement saving plan participation. Among the districts responding to the survey, the 403(b) plans have between 1 and 13 different vendors. The modal structure of the 403(b) plans is to have between 3 and 5 vendors, which 39 out of 90 (or 43%) of the districts report having. Employers can limit the number of vendors through a competitive bidding process by issuing a solicitation such as a Request for Proposals (RFP), although very few school districts in North Carolina have done so.Footnote 21
In 2008, new IRS regulations were imposed that forced school districts to reevaluate their 403(b) offerings in an effort to meet the new standards. Districts began deselecting vendors that were not in compliance with the new rules.Footnote 22 In personal interviews conducted by the authors, district plan administrators reported removing some 403(b) vendors from their plans because the vendors would not provide the information required under the new provisions. If a district recently removed several 403(b) vendors from their plan offerings, then new employees might find it less appealing to participate because of confusion or concerns over the future of 403(b) plan offerings.
Throughout our analysis, we classify districts in three ways based on the management and oversight of the 403(b) plans. First, if the district imposed any selection criteria beyond a minimum enrollment requirement, we classify them as selective. Only 32 of the 90 districts that responded to our survey had employed some criteria for selecting vendors beyond just a minimum number of enrollees; however, these selective districts employed almost 40% of employees. Note that participation and vendor count are mechanically related since most districts require minimum enrollments for vendors to be listed.
The second classification of oversight we consider is whether the district formally reviewed the selection criteria for 403(b) vendors within the last 5 years (39 out of 90 districts recently reviewed criteria). Finally, the third classification is whether the district reported having evaluated their plan offerings. We find that 27 out of 90 districts reported having evaluated their plan offerings to determine whether significant changes needed to be made. Not surprisingly, there is a positive correlation between district size and the amount of oversight as captured by these measures. In summary, its seems clear that, with a few exceptions, the management of school districts in North Carolina have devoted limited time and effort to the oversight of the supplemental retirement plans offered in their district.
2.3 Choice of promotional activities
Once a school district has determined the plan types and characteristics of the plans, the finance officer or human resource manager must decide how best to promote and advertise the plan offerings. One easy venue for disseminating retirement plan information is the district's website. We examined the websites of the school districts in North Carolina to determine what information is provided pertaining to the supplemental retirement plans. We evaluated the availability of key information concerning 403(b) plan vendors, investment options, fees, and methods of enrollment in the plan. As shown in the final rows of Table 1, we created three groups based on the quality of the website in terms of information about supplemental retirement saving plans: low (58 districts), moderate (17 districts), and high (15 districts).Footnote 23
Although the websites sometimes contain information on all plan types, in general the marketing strategies for the local plans will differ from the state-managed plans. There are currently more than 150,000 active school system employees who are potential participants in at least one of the North Carolina state-administered plans. Prudential markets these plans largely through e-mail and the plan website and field representatives occasionally attend employee events.Footnote 24 These plans are coordinated through the North Carolina Retirement Systems, and account balances are available online and as part of employee's annual benefit statements.
In contrast, since each school district approves vendors for its locally administered 403(b) plan (and 457 plan, if any), vendors typically identify company representatives to be account managers for these local plans which cover only the school personnel in the district. The vendors’ account managers are usually responsible for marketing the plan directly to employees through benefit fairs and personal communications. Sales representatives from approved 403(b) vendors arrange school visits and attend benefits fairs to provide information to teachers about their plans and enroll new participants. Both 403(b) vendors and Prudential provide retirement planning workshops. A team of financial advisors visits an employer, who hosts a ‘retirement workshop’ and encourages employees to visit during their work hours and learn about their retirement needs and plan offerings.
Thus, one important difference between the 403(b) plans and local 457 plans and the state-managed NC 401(k) and NC 457 plans appears to be the in-person element, whereby sales representatives sell products directly to employees at school districts. We do not have systematic data on differences in marketing strategies across districts, so we cannot quantify the extent to which these differences predict plan choices and participation rates.
A final aspect of district management that we consider is whether the district provides contact information for the approved 403(b) vendors directly to employees or whether employees must obtain the information from a third party. Specifically, our survey asks whether school personnel can get the district's list of approved 403(b) vendors and vendor contact information directly from the district via the website, benefit fairs, payroll inserts, or by request from a school/district-level department. This is related to website quality because one criterion for being classified as having a ‘high-quality’ website is providing contact information for vendors directly on the website. But, here we are more specifically considering whether the district is providing information directly to employees. Of the 90 districts responding to the survey, 43 provide information directly to employees.
3 School district employees’ retirement saving decisions
North Carolina school district employees have the option to contribute to employer-sponsored tax-advantaged accounts, so they must make decisions about whether to participate and how much to contribute.Footnote 25 One unique consideration of the retirement saving choices of school district employees is the decision regarding which retirement saving plan is best for them among 403(b), 457, and 401(k) plan offerings. While the provisions and tax regulations of these plans are similar, there are differences that could make one plan more appealing to teachers with different career patterns or alternative financial needs and objectives.Footnote 26
While all districts offer at least one 403(b) plan and the state-managed 401(k) plan, variation in the offerings and management of 403(b) plans may reflect the preferences and characteristics of the workforce. Multiple-vendor plans might provide options that are more appealing to employees or, alternatively, might increase the information costs that teachers must bear in order to determine the optimal choice of investments. Or, promotional activities associated with a highly competitive market for supplemental savings could lead to lower information costs in a ‘rational inattention’ model. This study examines how various aspects of the plan offerings are associated with teacher saving decisions including the availability of the state-managed or a district-managed 457 plan, the number of 403(b) vendors, the amount of oversight of the 403(b) plans, the quality of the information provided by the district or state, and the fees charged by the vendors.
3.1 Summary of supplemental plan participation and contribution rates
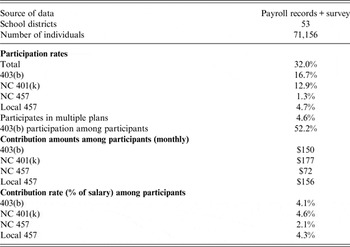
To begin, we present the average participation and contribution rates in each of the plan types for our sample. We focus here on our regression sample of 53 school districts and 71,156 employees (i.e., the merged payroll and survey data, as described in Section 2). The first row of Table 2 shows that 32.0% of school district employees participate in any supplemental retirement saving plan. The most common supplemental type is the 403(b) plan, with 16.7% of employees participating in a 403(b), while 12.9% of employees participate in NC 401(k). In Table 2, we see that only about 1% of the sample participates in NC 457. This is somewhat surprising given that in Table 1, Column (3) we found that 37.8% of employees had access to NC 457. Similarly, almost 5% are participating in a locally-managed 457 plan. Only 4.6% of all employees participate in multiple plans.Footnote 27
Mean participation and contribution rates

Notes: Data are from merged records from administrative data and district survey data for 53 school districts in North Carolina in March 2013.
We next consider contribution rates among school employees who participate in one of the supplemental plans. Conditional on participating, those in the 403(b) plan are contributing on average $150 per month, which would be equivalent to about $1,800 annually if contributions were made in identical amounts each month. Finally, we see that the average of the contribution rates in each of the plans is low, between 2% and 5% of salary. In results not shown, we find that over 93% of those contributing do so at a level that is less than 6% of salary. We do not formally model contribution rates in the regression analysis because we observe only one pay period, and therefore cannot determine annual contributions for individuals who do not contribute an identical amount each pay period.
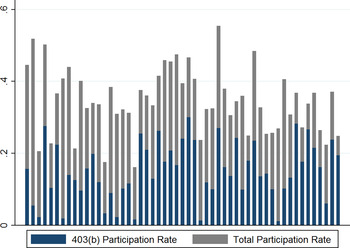
Figure 1 shows how the participation rate in any plan and, specifically, in the 403(b) plan varies across the school districts. The proportion of district employees enrolled in any plan differs by about 40 percentage points from the lowest to the highest level while the rates for participation in the 403(b) plan vary by 30 percentage points. These are remarkably large differences when we consider that all of the districts are covered by the same defined benefit retirement plan (TSERS) and health plan and retiree health plan.Footnote 28 In the subsequent subsections, we explore reasons for these large differences across districts.
(Colour online) Participation rates by district. Notes: Each bar represents a district ordered by smallest to largest district by number of employees. The vertical axis is participation rate in any supplemental plan at the district level.

3.2 Participation in retirement saving plans by school personnel in North Carolina
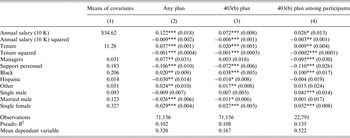
We now consider how individual characteristics are related to supplemental plan participation by estimating a series of participation regressions. Table 3, Column (1) shows the means of the covariates included in the regression model. Statistics on the sample size and means of dependent variables are included in the bottom rows of Table 3. Table 3, Column (2) presents the results from estimating whether the employee contributes to any supplemental retirement plan offered by the district. The proportion of school employees who contribute to any saving plan is 32.0%. Table 3, Column (3) reports the estimated marginal effects from a Probit regression on the probability that a worker will be contributing to a 403(b) plan (mean of the dependent variable is 16.7%). Column (4) repeats this analysis but only for workers who are contributing to any plan (mean is 52.2%). All regressions reported in Table 3 include district fixed effects to control for all district-level characteristics, and therefore only reflect variation within districts and not differences in plan offerings.Footnote 29 All regression models are estimated with a Probit, and marginal effects calculated at the mean are presented with standard errors clustered by district in parentheses.
Plan participation, individual characteristics, and district fixed effects

Notes: Data are from payroll records. All models include district fixed effects. Marginal effects, calculated at the mean, are estimated from Probit regressions. Robust standard errors are in parentheses and are clustered at the district level. ***p < 0.01, **p < 0.05, *p < 0.1.
First, we see that participation rates overall, and in 403(b) in particular, are quadratic in both salary and tenure.Footnote 30 In Table 3, Column (2), the estimated coefficients on salary suggest that participation rates rise with salary at a decreasing rate with a maximum at about $65 K.Footnote 31 Tenure is associated with higher participation with a maximum at about 21 years of service.Footnote 32 The estimated relationship between saving and tenure may be complicated by the fact that teachers who expect to have short tenures have a bigger incentive to save because their defined benefit pension will be much less valuable (Ingersoll, Reference Ingersoll2001; Chingos and West, Reference Chingos and West2015).
Using information in the payroll records on job classifications, we group school district employees into the following job categories: (1) managers, (2) instructional staff, and (3) support personnel. The management category includes district leadership, principals, and assistant principals, but also anyone in a management role such as the cafeteria staff supervisor or front office manager. Here we find that managers are 7.7 percentage points more likely to be participating in any plan, but conditional on participation are 9.5 percentage points less likely to be contributing to a 403(b) plan. On the other hand, support personnel are 10.6 percentage points less likely to be participating in any plan, and, conditional on participating, are 11.0 percentage points less likely to be contributing to a 403(b) plan. All else equal, instructional staff are more likely to be choosing the 403(b) plan than other plan options.
There are several interesting differences by racial/ethnic group, gender, and marital status. In Table 3, Column (2), we find that Hispanics are 3 percentage points less likely to be participating in any plan while blacks and those categorized as other racial/ethnic group are about 2.0 percentage points and 2.4 percentage points, respectively, more likely to be participating relative to non-Hispanic whites. But, among those participating in any plan (Column 4), non-Hispanic black workers are 10.0 percentage points more likely than non-Hispanic whites to be contributing to a 403(b) plan, holding constant salary.
Married men are 2.6 percentage points less likely to be contributing to a saving plan compared with married women.Footnote 33 On the other hand, single females are 2.9 percentage points more likely to contribute to a plan than married women. Among participants, both unmarried males and females are significantly more likely to be participating in a 403(b) plan. Since contributions to 403(b) plans are grouped with contributions to 401(k) plans for IRS tax purposes, contributions to 457 plans are counted separately, the findings in Table 3, Column (4) are consistent with married individuals strategically participating in 457 plans to maximize contributions. However, we see very few individuals contributing at levels at or near the IRS maximum limits.
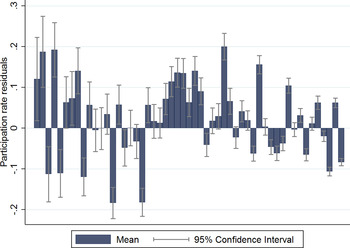
To determine how important individual characteristics are in explaining cross-district variation in participation rates, we calculate the deviation from model predictions by capturing the residual of the actual participation rate minus the predicted participation rate generated from the regression reported in Table 3, Column (2) except without district fixed effects.Footnote 34 We then aggregate these individual residuals to the district-level. These means of residuals and the 95% confidence interval by district are plotted in Figure 2 in ascending order of district population size.Footnote 35 While the predicted and actual participation rates are quite similar for many districts, the lowest participation rate district has nearly −0.2 residual while the highest participation rate district has nearly a positive 0.2 residual. Thus, there remains about a 40 percentage point spread between the participation rates of districts, even when adjusting the means for a host of individual demographic characteristics.
(Colour online) Residuals controlling for individual characteristics. Notes: Each bar represents a district ordered by smallest to largest district by number of employees. The vertical axis is the residual participation rate in any supplemental plan at the district level with a 95% confidence interval, where the residual is calculated as the difference between the actual and predicted total participation rate. Predicted values are calculated from the regression of participation in any plan on individual characteristics, as in Table 3, Column (1), except without district fixed effects.

3.3 District characteristics
Since all employees in all of the districts are covered by the same state retirement plan, the same state health plan, and the same state managed retiree health plan, these large differences across the districts cannot be explained by these factors. Thus, we now examine what other factors might explain the variation in participation rates across the school districts. First, there are unobserved (to the researchers) differences in the underlying population in terms of propensity to save, along with individual-level heterogeneity in desire/need to save that is unmeasured in the data (e.g., spouse's income or financial literacy).Footnote 36 These unobserved characteristics might be correlated with district plan offerings and plan management if districts respond to the requests and preferences of their workers, or it might be that district offerings affect individuals differentially in ways that the district fixed effects cannot capture. Differences might also be due to peer effects or the effects of an influential school leader, as discussed further below.Footnote 37
Still, district management choices and oversight practices are likely to be an important determinant of the propensity for employees in a particular district to enroll in the retirement saving plan. The participation equations are re-estimated with additional district variables added to the specification in an attempt to identify specific practices that are associated with retirement saving decisions. While we expect that district factors, such as management policies, play a role in encouraging employees to contribute to supplemental retirement plans, the regression analysis described below does not uncover any robust systematic patterns.
An interesting policy question is whether school district employees are more likely to contribute to a retirement saving plan when there is a small or large number of vendors. As described above, the neoclassical model predicts more investment options leads to higher participation rates, all else equal. But, behavioral economics suggests that ‘information overload’ may lead to lower participation rates. On the other hand, ‘rational inattention’ suggests that more advertising and an emphasis on saving, in general, will lead to higher participation rates. An industry group report claims that more choice leads to higher participation, on average (Davis et al., Reference Davis, Miller and Miller2011).Footnote 38 Academic studies find that in the 401(k) world information overload associated with a large number of vendors and investment options typically leads to lower participation rates (e.g., Iyengar et al., Reference Iyengar, Huberman, Jiang, Mitchell and Utkus2004; Brown et al., Reference Brown, Liang and Weisbenner2007).
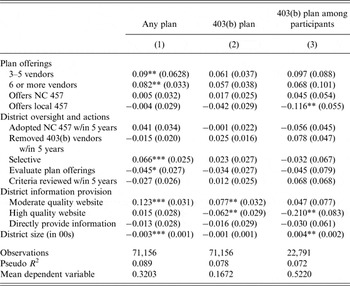
In Table 4, we present parallel regression estimates to Table 3, except here we have replaced the district fixed effects with certain district-level characteristics. Note that individual-level demographics reported in Table 3 (but not district fixed effects) are also included in the regressions in Table 4, but are not reported in the table.Footnote 39 Many of our measures of management and oversight are likely collinear and all are measured with considerable error, thus any lack of statistical significance might reflect Type II error and insufficient power.Footnote 40
Plan participation and district characteristics

Notes: Data are from payroll records merged with district survey responses. All models include individual characteristics reported in Table 3 (salary, tenure, race, gender, and marital status) but exclude district fixed effects. Marginal effects, calculated at the mean, are estimated from Probit regressions. Robust standard errors are in parentheses and are clustered at the district level. ***p < 0.01, **p < 0.05, *p < 0.1.
First, while we do not find a significant relationship between the number of 403(b) vendors and 403(b) participation, we do see that working in a district that has more 403(b) vendors is positively related to participation overall.Footnote 41 When considering participation in any plan, districts offering three-five 403(b) vendors have a 6.9 percentage point higher participation rate and districts offering six or more vendors have an 8.2 percentage point higher participation rate, with both estimated coefficients being statistically significant. While the signs of the estimated marginal effects in columns (2) and (3) are positive and large, none are statistically significant. These findings do not support the behavioral theory of ‘information overload’, whereby many vendors or many plan offerings would lead to lower participation rates. Similarly, the neoclassical model would suggest that more 403(b) vendors would lead to higher participation rates in 403(b) plans but this direct effect of multiple vendors is not supported here. The model that is most consistent with our findings is the behavioral model of ‘rational inattention,’ which suggests that more vendors, and the associated marketing activities, will increase supplemental plan participation rates in general even if individuals do not sign up with the marginal vendor. Thus, one possible mechanism is that having a greater number of 403(b) vendors has a positive effect in getting workers interested in retirement saving, but employees decide to save in the single vendor state-managed plans rather than the multi-vendor 403(b) plans.
Next, when considering other aspects of plan offerings, we show in Column (3) that, among participants, the existence of a local 457 plan reduces the probability of being in a 403(b) plan, suggesting that at least some of the employees view local 457 plans as substitutes for 403(b) plans.Footnote 42 Similarly, we do not find a significant relationship between having removed a 403(b) vendor and participation. When considering district oversight activities, we find that districts that are more selective in allowing 403(b) vendors (i.e., impose more than a minimum enrollment criteria) have higher participation rates in any supplemental plan. However, again selectivity does not predict 403(b) participation in particular. It might be that districts whose population is more interested in supplemental plans invest more time and resources into managing and promoting plans. Having evaluated, 403(b) plan offerings is associated with lower overall participation, which could be explained by districts responding to low overall participation by evaluating their 403(b) options. The estimated coefficients on an indicator having reviewed the criteria for 403(b) vendors within the past 5 years are not statistically significant in all three regression models.
The relationship between website quality and supplemental plan participation is non-monotonic. In Table 4, Column (1), we see that moderate website quality is associated with significantly higher probabilities of participating in any plan and in 403(b) plans. Moderate quality websites provide some basic information on plan offerings but no contact information. On the other hand, high website quality is associated with significantly lower 403(b) plan participation in total and among participants. One explanation is that high quality websites provide more detail on the product offerings (and sometimes on fees) and retirement planning information and so make more transparent that 403(b) plans are not superior to the state-managed 401(k) or 457 plan. Alternatively, it could be that the highest quality websites are those that are newly revised so that most individuals in the data made their decisions about participation based while the website was of inferior quality.Footnote 43 Furthermore, districts that have low participation rates might respond by revamping their websites.
Interestingly, we find no significant association between districts providing vendor lists and contact information directly to employees and supplemental plan participation, all else equal. Finally, while the probability of participation is lower in larger districts, participants in those large districts are more likely to be in 403(b) plans. It might be that 403(b) vendors are more attentive to a larger pool of potential customers.
4 Discussion and conclusions
Public school teachers are like many other American workers – they need to save for retirement. Retirement saving through tax-qualified, employer-provided plans is one of the most effective methods of accumulating resources to provide sustainable income during retirement. The options available to K-12 school personnel differ substantially from the 401(k)-dominated retirement saving environment in the private sector. First, the traditional retirement saving vehicle for public schools has been the 403(b) plan; however, school districts can, and often do, offer state- and/or district-managed 401(k) and 457 plans alongside their 403(b) options. Thus, the typical public school district employee might have to select from among several distinct tax-qualified retirement saving vehicles – a choice that most private-sector employees do not need to make.
The management of 403(b) plans by school districts varies considerably across states and across school districts within each state. School boards and district administrators are responsible for overseeing a number of important elements of their supplemental retirement plans, including the number of vendors allowed to offer retirement savings products to district employees, the vendor selection process, the restrictions on investment options offered and on fees charged by participating vendors, and the manner in which, as well as the extent to which, school districts communicate information about their retirement plan(s) to district employees. In many cases, employees who choose to enroll in the 403(b) plan must decide on their preferred vendor. After selecting the vendor, the individual then must select the desired investments for their retirement saving. Without considerable employer oversight, the cost of identical investments can vary greatly across vendors.
This paper examines retirement saving plans among school districts in North Carolina. Using individual-level data from payroll records merged with district-level characteristics from a survey, we estimate the probability of contributing to any supplemental plan and then focus specifically on participation in 403(b) plans. Considering the residuals from the regression on individual characteristics, we illustrate that participation varies significantly across the districts, holding constant individual characteristics and state benefits that are common to all school personnel. Even with detailed control variables for district plan management and oversight activities, much of the variation across districts in participation rates is left unexplained. The differences may reflect unobserved population characteristics or the effects of peers or school leadership. Regressions estimating the probability of participation that include district characteristics provide evidence that having more vendors in the 403(b) plan is associated with higher overall participation rates, but is not associated with higher participation in 403(b) plans in particular. Plans with many vendors may promote retirement savings through greater marketing efforts, and participants may ultimately decide to enroll in an alternative single-vendor plan. Multiple vendors may also draw more people in through providing greater choice and more tailored products. However, this process could also result in lower quality product offerings, potential ‘information overload,’ and less transparent fees.
This study contributes to the literature on retirement saving plan participation in the following ways. Few studies have looked at public-sector supplemental retirement savings plans, and even fewer have studied the 403(b) plan in particular. Because of the differences in retirement plan design, choices, and offerings in the public sector compared with the private sector, research from case studies of retirement saving behaviors in primary defined contribution plans in the private sector may not apply to this population of workers or their employers. Moreover, this study incorporates data from many different public-sector employers with a similar population of workers who share retirement benefits, health benefits, retiree health benefits, and similar salary schedules.
Future work should consider how product offerings and fees directly affect not only participation and contribution rates but also retirement wealth accumulation. Choi et al. (Reference Choi, Laibson and Madrian2010) find in an experimental setting that subjects ‘overwhelmingly fail’ at the goal of minimizing index fund fees even when fees are made more salient. This suggests that while fee transparency and the availability of information might have some impact on the retirement saving decisions of public employees, access to high quality supplemental plans will likely improve wealth accumulation for participants but will not necessarily draw individuals into saving. Supplemental retirement saving plans with high levels of oversight, whether state-managed or locally-managed, could improve the welfare of public employees who choose to participate through lower fees and greater retirement wealth accumulation. However, increased oversight at the district level typically demands that employers offer fewer saving options, which might also result in lower participation rates among school district employees.
Supplementary material
To view supplementary material for this article, please visit http://dx.doi.org/10.1017/S1474747215000414