


Introduction
In areas of undisturbed snow accumulation it is possible to determine, by using the correct chemical and isotopic tracers, individual snow layers accumulated layer by layer over time. By assuming a close correlation between the atmospheric aerosol composition and the snow composition (Reference Lambert, Ardouin, Mesbach-Bendezu, Pruppacher, Semonin and SlinnLambert and others, 1983; Reference Pourchet, Pinglot and LoriusPourchet and others, 1983) and considering, where possible, the effects of eventual post-de-positional processes, a detailed history of the annual and seasonal variation of the atmospheric composition from the snow chemical analysis can be reconstructed.
In northern Victoria Land, East Antarctica, the relative closeness of plateau-like or high-altitude névé areas to the coastline, and to the ItalianTerra Nova Bay base, makes access to undisturbed snow-accumulation sites easier. Chemical and physical analyses of firn and ice cores sampled in such areas permit the observation of environmental variations over several decades with detailed analyses of the seasonal behaviour of the main and secondary sources of atmospheric aerosol.
The study of carboxylic acid presence in Antarctic snow-can give useful information about sources and transport processes of the oxidation products of substances related to biological cycles (Reference BerresheimBerresheim, 1987; Keenc and Galloway, 1988; Reference Legrand and SaigneLegrand and Saigne, 1988; Reference Andreae, Talbot, Berresheim and BeecherAndreae and others, 1990; Reference Watts, Brimblecombe and WatsonWatts and others, 1990). Although many sources were postulated for carboxylic acids in polar atmosphere (such as direct input from biologic activity or secondary emission by oxidation of marine and continental biogenic hydrocarbons), further studies are indispensable for understanding their atmospheric cycles and their role in the weak acidity of snow precipitation (Reference Legrand and de AngelisLegrand and de Angelis, 1995, Reference Legrand, de Angelis, Cachier, Gaudichet and Delmas1996).
Formate and acetate are directly emitted by vegetation and biomass-burning or from anthropogenic activity (Reference Talbot, Beecher, Harriss and CoferTalbot and others, 1988, Reference Rocklin, Pohl and Schibler1990). The biomass-burning, usually underestimated, can represent a significant input of hydrocarbons in remote areas. in particular, the methane produced yearly by biomass-burning is about 7% of global methane emissions (Reference Dignon and DelmasDignon, 1995). Formic acid production is related to the oxidation processes of hydrocarbons emitted by forest areas (mainly isoprene) and to the natural cycle of formaldehyde (Reference JacobJacob, 1986; Reference Jacob and WofsyJacob and Wbfsy, 1988, Reference Jacob and Wofsy1990). Measurements of acetic and formic acid in polar snow-are sporadiC. The first detailed investigation of carboxylic acid presence in Greenland can be found in two recent papers of Legrand and de Angelis (1995, 1996) concerning GRIP project samples.
The presence of propionate in atmospheric precipitation was shown by measurements in rainwater (Tsidouridou and Puxbaum, 1987; Reference MurrayMurray, 1989), but propionate measurements on snow samples from Antarctica and Greenland are missing. in superficial snow and ice samples collected at Terra Nova Bay, East antárctica, the concentration of propionate was always below the detection limit (Udisti and others, 1991).
In this paper an ion chromatographic (IC) method for the determination of some organic anions and fluoride at sub-μgl−1 concentration levels is applied to a 22 m firn core from Hercules Névé, Antarctica. The first data on distribution and temporal profiles (about 60 years) of some short-chain carboxylic acids (formic, acetic and propionic acid) in northern Victoria Land are reported here. Preliminary concentration/depth results show a probable biomass-burning event, occurring in the 1930s, evidenced by high levels of carboxylic acids, fluorides, potassium and, with less evidence, ammonium.
Methodology
Sampling site
During the 1993-94 Italian Antarctic Campaign, a 22 m firn core was drilled at Hercules Névé station, northern Victoria Land. Figure 1 shows the geographic position of the sampling site. Northern Victoria Land is a region with a complex orography influenced by strong katabatic winds (personal communication from B. Stenni, 1997), so an accurate preliminary study was necessary to isolate relatively undisturbed sampling areas. Satellite photos showed that Hercules Névé is not influenced by snowdrifts and sas-trugi, so that this area seems to be unaffected by wind redistribution effects. A previous shallow firn core (8 m; Udisti, 199fi) confirmed an undisturbed annual snow deposition.
Hercules Neve is a plateau of approximately 1100 km2, about 3000ma.s.l.. and about 75 km from the sea (Lady Newnes Bay). It comprises the largest ice cap of northern Victoria Land with the adjacent Evans Névé. The site is located on the ice divide between the glaciers that flow into the Ross Sea and into the Pacific Ocean.
Mean annual temperature values of about -33°C were estimated for the sampling station from the temperature data (-34.5° and -33.1°C at 7.5 and 10 m depth, respectively) measured during the firn coring (personal communication from B. Stenni, 1997).
Sampling and analytical procedures
During the coring, sampling and analysis procedures, all precautions were taken to minimise contamination, and the personnel wore clean-room clothing. The firn core was drilled using a SIPRE rotating ice-corer (electrical 1000 wengine) with a stainless-steel corer tube (10cm diameter, 120 cm long) and fibreglass corer rods (120 cm long). This corer was accurately cleaned before use and produced core segments 80-90 cm long. These were cleaned externally on site, labelled and placed in double polyethylene scaled bags. The firn-core sections were kept frozen and brought to the clean-cold room of the Laboratoire de Glaciologie in Grenoble, France (Reference Maggi and PetitMaggi and Petit, 1998). The firn core was cleaned by mechanically removing a thin external layer, and subsamples were obtained by cutting the firn cores about every 5 cm. These were stored at -20°C in pre-clcancd polyethylene containers placed in double polyethylene bags. Due to electrical failure of a cold store, the first 4m were not analyzed.
In the analytical laboratory of the University of Florence the samples, still in their containers, were melted just before analysis under a class-100 laminar-flow hood and filtered on a pre-cleaned 0.45 μm Teflon membrane immediately after melting. Particular care was taken to open the containers as little as possible, in order to minimise any uptake of ammonia and carboxylic acid from the laboratory atmosphere (Udisti and others, 1991,1994).
Geographic position of the sampling station: station 36, Hercules Névé (73°06', 165°28' Ε; 2960 m a.s.l), about 90 km from the coastline.

Experimental
Apparatus
The chemical analysis was performed using a Dioncx 4000i IC equipped with a gradient pump and a conductivity detector (CDM-1). The conductivity suppression was performed by an electrochemical anion membrane suppressor (Dionex ASRS-l). The anion separation was obtained by a Dioncx AG11 guard column and a Dioncx ASH separator column. Tetraborate 0.9 and 30 mM was used as eluent according to a slep-eluent separation procedure. The eluent was degassed and pressurised with helium by an eluent degas module (Dionex FDM-2). The chromatographic data were colle cted and elaborated by Dionex PeakNet integration software. A 1 ml loop was used for all sample analysis.
Reagents
Stock standard solutions (1 gl−1) were purchased from Merck when available, or obtained from “reagent grade” Merck or Fluka reagents dissolved in ultra-pure water (resistivity > 18 ΜΩ). Standard solutions with lower concentration were prepared daily in pre-cleaned polyethylene bottles.
Results and Discussion
Analytical method
The organic anions (lactate, acetate, propionate, glycolate, formate, methane sulphonate and pyruvate, plus fluoride) are present in snow from Antarctica at very low concentrations, ranging from sub-μgl−1 to μgl−1 levels. Moreover, these anions are weakly retained into the IC separator columns used for the inorganic anion determination (eluent: carbonate/hydrogencarbonate buffer) so that their separation is difficult An IC method for a complete separation of the considered components and able to determine sub-μgl−1 concentration levels is required.
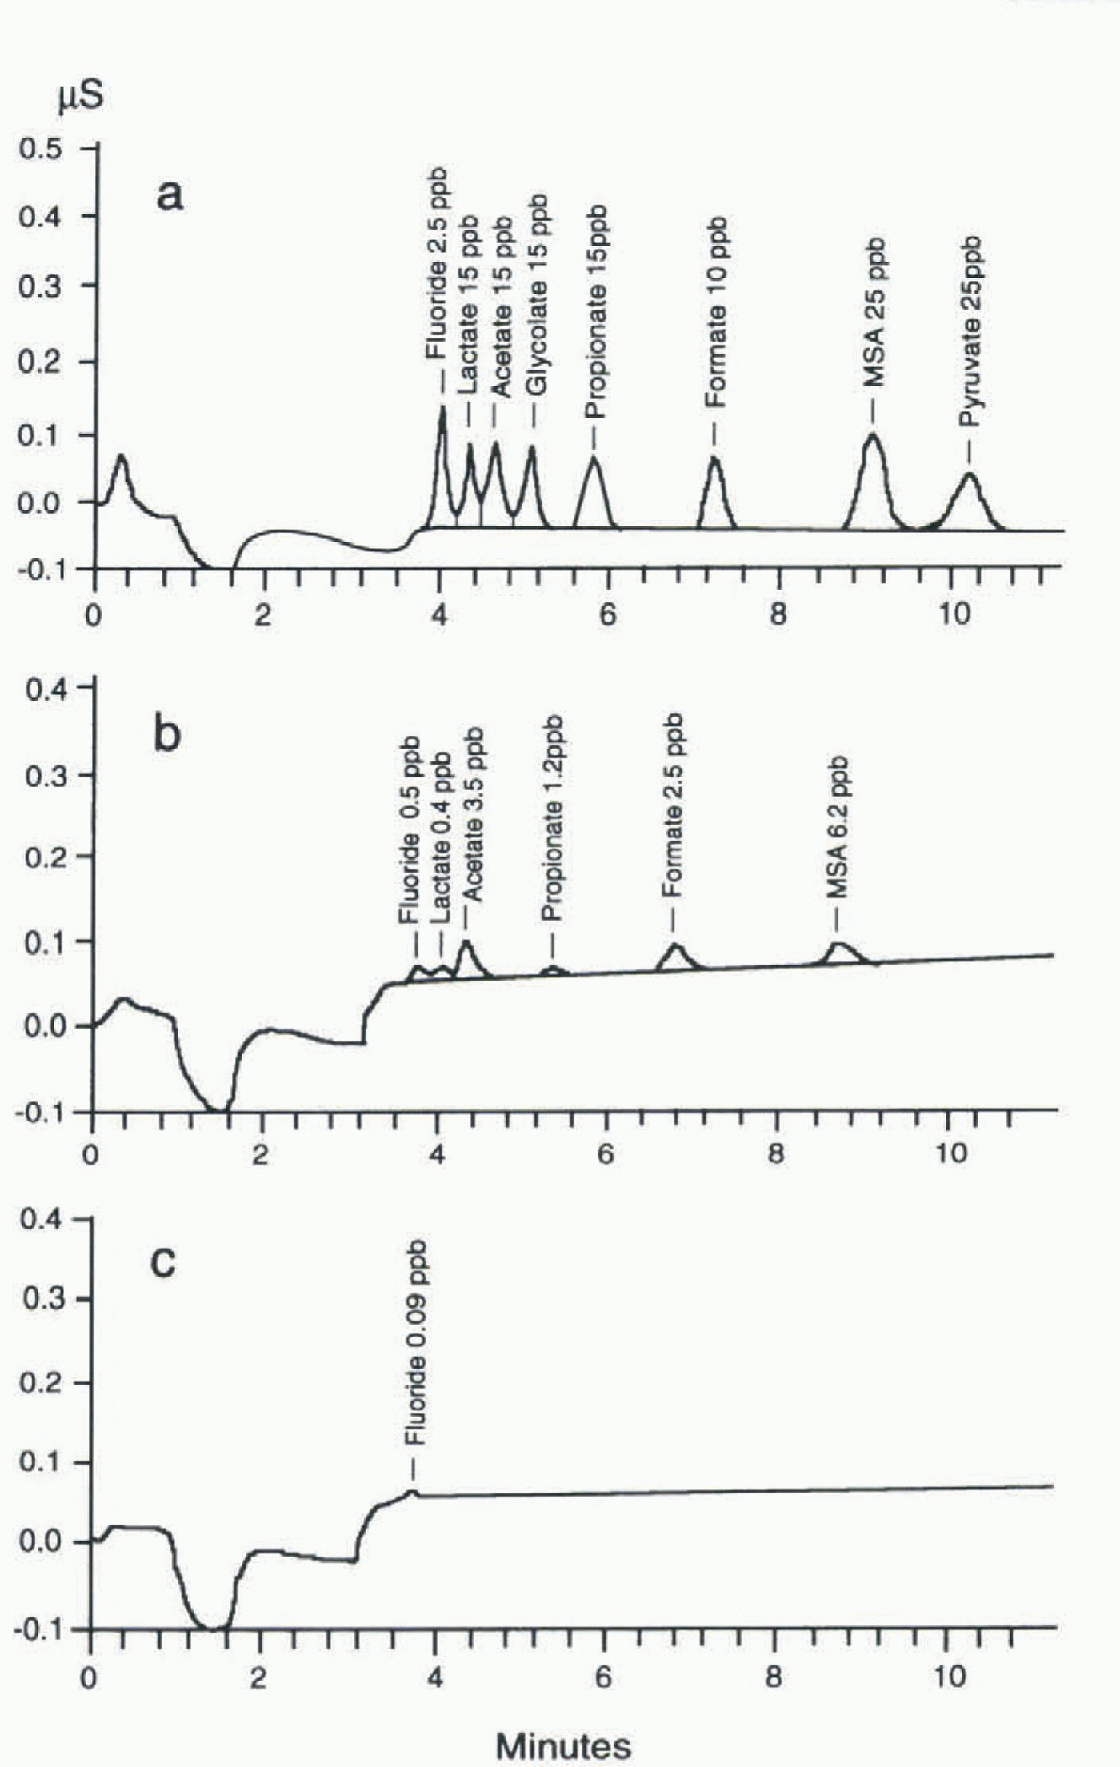
(a)Chromatographic separation of fluoride and some organic anions (standard solution). The components determined and their concentrations are reported at the top of each peak. Operative conditions and step-eluent programme: Separation and guard columns: Dionex AS11+AGJ1; loop: 1 ml; eluent flow: 2 ml min−1
Eluents: El.l = H20 Milli-Q: El.2 = 30m M Na2B4O7, El.3 = 3m M Na2B4O7.  (b, c) Chromatogram of a real sample from Hercules Névé station (b), compared with operational blank (c); same conditions as above. The components determined and their concentrations are reported at the top of each peak (ppb =μgl−1).
Various methods for the simultaneous determination of organic and inorganic anions are reported in the literature Reference Rocklin, Pohl and SchiblerRocklin and others, 1987; Reference CheamCheam, 1989, Reference Cheam1992; Legrand and others, 1993). They are usually based on a gradient clution with NaOH solutions. L oder the reported conditions, however, the separation betweensome components with similar retention times (in particular, acetate/glycolale/propionate and methane sulphonic acid (MSA)/pyruvate) is insufficient for their simultaneous determination. Moreover, the baseline drift, due to the NaOH concentration gradient, prevents the determination of low concentrations. The detection limits reported for the baseline subtraction technique (Cheam, 1989) (10-80μgl−1; loop = 50 μl) are too high to analyze Antarctic samples withμgl−1 or sub-μgl−1 concentrations. After a comparison of three IC methods (ion exclusion and anionic exchange in isocratic and gradient mode), Cheam (1992) concluded thai the isocratic method produces more reproducible results and lower detection limits.
Udisti and others (1994) proposed two alternative methods based on isocratic or gradient separation using a Dionex AS5A-5μm separator column and tetraborate as eluent. The gradient methods gave better separation (in particular between acetate and propionate) but lower reproducibility by baseline drift. The isocratic method, on the other hand, did not fully separate some components. in this paper, the isocratic method was improved using a Dionex ASH separator column and 0.9 mM tetraborate as eluent. in effect, after the separation of the organic acids, a more concentrated Na2,B4O7 solution (30mM) is pumped into the system to elute the inorganic anions trapped in the column, Therefore, the above “isocratic” method should be called a “step-eluent” method. During the cleaning step, the inorganic anions are quickly cluted without effective separation.
Na2B4O7 was preferred to NaOH because of its lower capacity to absorb atmospheric CO2. The carbonate so formed increases the eluent strength to the detriment of the measurement reproducibility. The use of degassed (helium Na2,B4O7 solutions kept retention times stable for more 1 ban a week (Udisti and others, 1991).
The chromatogram of a standard solution containing 2.5-25 μgl−1 of all the analyzed components is shown in figure 2, which also shows the experimental conditions.
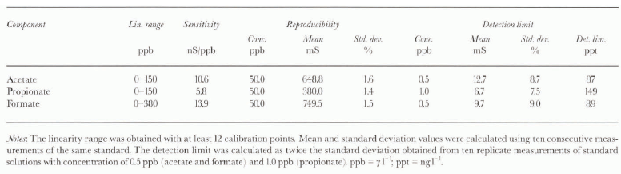
Table 1 shows the analytical performance of the method (linearity range, sensitivity, reproducibility and detection limits) for atétale, propionate and formate. The rcproducibility values (betler than 2.0% at 50μgl−1) and the detection limits (lower than 0.150 μgl−1) permit the effective determination of these components at very low concentration levels in Antarctic snow. The low detection limits are due to the very stable baseline value, to high peak reproducibility and to low blank values. figure 2b shows the ion chromato-gram obtained fora real sample containing fluoride, acetate, propionate, formate and MSA at μgl−1 or sub-μgl−1 concentration levels, with respect to a blank (polyethylene container) plotted on the same scale. Legrand and others (1993) advised against the use of plastics, to avoid possible contamination. in our experience, accurately cleaned plastic containers (either polyethylene or polypropylene containers, disposable and cheaper than glass bottles) showed low blank values: below the detection limits for propionate and in the range 0.1 -1.0μgl−1 for acetate and formate.
Linearity range, reproducibility and detection limit for acetate, propionate and formate. Same conditions as Figure 2
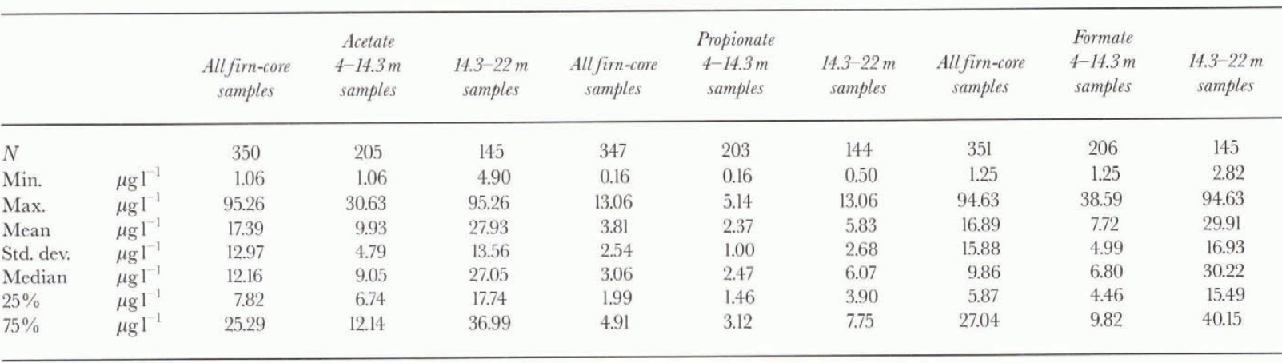
Statistical parameters for acetate, propionate andformate in all the firn core, 4-14.3 m section (background level) and 14,3- 22 m section (biomass-burning events)
Firn-core data discussion
Among the components analyzed in the firn core, in this paper we pay attention to acetate, formate and propionate.
A reliable dating is necessary to obta in the temporal setting of the samples. The firn-core dating was performed by a combination ofseasonal and absolute markers. For seasonal snow-layer identification (relative dating), we used a visual comparison between δ18Ο depth profile (l-22m) and a chemical profile (4-22 m) obtained by a linear combination of the normalised concentration/depth profiles of three summer markers (MSA, nssSO4 2- and H2O2) (Udisti, 1996; personal communication from B. Stenni, 1997). Absolute dating levels were determined by the tritium concentration/ depth profile. This dating has been discussed by Stenni (personal communication, 1997). The dating results showed 64 summer peaks along the firn core (1-22 m below the snow surface) corresponding to 63 years from 1990 to 1928. Chemical data have been measured on a 1-22 m section (1982-28).
Table 2 shows the basic statistical data concerning the distribution of the three carboxylic acids in the firn core. The statistical values can be considered reliable because the three components have been determined on all 351 sub-samples (only four values for propionate and one value for acetate are missing). These compounds are present in the Antarctic snow at very low concentrations. The mean values of 16.9 ±15.9, 17.4 ±13 33 and 3.8 ± 2.5μgl−1, found respectively for formate, acetate and propionate, are very close to those reported by Legrand and others (1993) for Greenland precipitations (only formate and acetate; mean values respectively 12 and 13μgl−1). Legrand and de Angelis (1995 and 1996) reported mean background Holocene values of 9.3 ±1.4 and 10.7 ±1.7μgl−1 for acetate and formate at Summit, Greenland.
Figure 3 shows acetate, formate and propionate distribution graphs (box plots). Each box contains 50% of the data, with the median value displayed as a line. The sample dispersions are quite high, as shown by the relatively large interval between the 25th and 75lh percentile values (box
Box plots of propionate, formate and acetate for all samples (a), 4.0-14.3 m samples (b) and 14.3-22 m sample (c). Each box contains 50% of the data, with the median value displayed as a line. The top and bottom of the box mark the limits of ±25% of the variable population (25th and 75th percentile). The lines extending from the top and bottom of each box mark the minimum and maximum values thatfall within an acceptable range (1.5 times the box width). Any value outside of this range (outlier) is displayed as an individual point.

Concentration/depth profiles of formate (a), acetate (b), propionate (C) potassium (d), ammonium (e) and fluoride (f) at Hercules Neue station.

height) and by the standard deviation value, of the same order of magnitude as the mean value. Moreover, these data dispersions are not symmetrically distributed, as shown by the median values (line in the box) shifted towards the bottom of the box (above all, for formate and acetate) and lower than the mean values. Formate and acetate median values are 58% and 70%, respectively, of the mean values. A few samples, in fact, have concentration values higher than the mean (up to 5.5 times for formate and acetate and 3.5 for propionate). Such high values are not regularly distributed on all the firn core. figure 4a c show the concentration/depth profiles for the three components. in the first 15 m the concentrations for all three compounds are lower than for the total firn-core mean value (4-14.3 m depth mean values of 9.9±4.8,7.7 ±5.0 and 2.4±1.0μgl−1 for acetate, formate and propionate, respectively). This part of the firn core shows no particular concentration/depth trend, and only a slight concentration increase with depth can be observed for all the components. At 14.6 and 15.7 m depth (about 1947 and 1943, respectively; personal communication from B. Stenni, 1997), two sharp spikes with relatively high concentrations (up to nearly 100μgl−1) are found for acetate and formate. Lower maximum values (about 10μgl−1), but 3.5 times higher than the mean, are found at the same depths for propionate. For depths lower than 16.0 m, the concentration profiles show a common sharp increase, with values consistently higher than the background. The 14.3-22m depth (corresponding to the 1948-
Correlations of acetate, propionate and ammonium vsformate concentration for 4.0-14.3 m ( a-c) and 14.3-22 m (d-f) samples.

28 period) mean values of 27.9 ±13.6, 29.9 ±16.9 and 5.8 ± 2.7μgl−1, found for acetate, formate and propionate, respectively, are 2.8,3.9 and 2.4 times higher than the corresponding 4-14.3 m depth mean values. This behaviour is shown also by the box plots in figure 3b-c, where an increase of median values and of data dispersion for the deepest firn-core section is clearly evident. Biomass-burning inputs are a possible explanation. in particular, a long-term event seems to be indicated in the 1930s by the steadily high concentrations from 18 to 22 m (1936-28).
Figure 5 shows the relationships of acetate, propionate and NH4 + with formate (considered as the best biomass-burning marker; Legrand and de Angelis, 1995,1996) in the 4-14.3 m (fig. 5a-c) and 14.3-22 m (fig. 5d-f) firn-core section. We can observe that a linear correlation is missing in the upper firn-core part, but it is clearly evident for the organic acids in the bottom (correlation coefficient R =0.88, 0.89 and 0.39 for acetate/formate, propionate/formate and ammonium/formate, respectively). The correlation between ammonium and formate is lower than that found by Legrand and de Angelis (1995, 1996) for biomass-burning events at Summit, Greenland. The linear regression slopes indicate a mean ratio of 0.64 and 0.14 for acetate/formate and propionate/formate, respectively.
An acetate/formate ratio of around 10 was found by Talbot and others (1988) from atmospheric measurements during biomass-burning events. During the transport, formic acid production occurs in the plume, so that the acetate/formate ratio reaches values lower than 1 (Legrand and de Angelis, 1995). The acetate/formate ratio found in the firn core (0.64 w/w) agrees with this result.
High concentration values for carboxylic acids, NH4 +, K+ and F− are reported as indicating biomass-burning events (Reference Cachier and DelmasCachier, 1995; Legrand and de Angelis 1995, 1996; Legrand and others, 1995). in order to confirm analogous behaviour, the concentrations of K+, NH4 + and F− in the firn core were plotted vs depth. figure 4d-f show the relative concentration/depth profiles: a concentration increase is evident starting from 14.3 m depth for these compounds. This increase is in-phase with carboxylic acid, although a correlation with formate, acetate and propionate spikes at 14.6 and 15.7m depth is not visible for K+, NH4 + and F−.
The mean concentrations in the bottom of the firn core are 4.2±6.4, 4.3±2.9 and 0.67±0.95μgl−1 for K+, NH4 + and F−, 1.3, 1.4 and 2.6 times higher, respectively, than the relative mean values in the 4-14.3 m firn-core part. For K+, the concentration increase is more evident considering the median value (the K+ background mean is affected by some samples with high sea-spray content). An increase of 2.5 times is measured in the firn-core bottom section with respect to the background. This means that a larger number of samples with higher concentration occurs. Similarly, the concentration/depth profiles of Na+ (sea-spray marker), nssSO4 2- (biogenic and volcanic indicator) and Ca2+ (crust a I input) were observed, excluding any alternative explanation of the experimental data. Mean and median values of these compounds did not show any increase trend in the 14.3-22 m firn-core section with respect to background. Therefore, a biomass-burning event seems to be the more probable explanation for carboxylic acid, Κ+, NH4 + and F− contemporaneous increases.
High dust levels found in the same firn core at 14.3-22 m depth (Maggi and Petit, 1998) could reinforce the hypothesis of the biomass-burning effects. Preliminary data show that this particulate has a predominant organic composition (about 50%; personal communication fromV. Maggi, 1997) and could be constituted by ash or other carbonic material. A structural analysis of the particulate will be performed to confirm the presence of ash. The presence of light particles (such as ash) could expla in the very long residence times of the above-mentioned chemical markers and dust in the atmosphere.
Conclusions
The eluent-step IC method used for the determination of acetate, formate and propionate in Antarctic snow samples gives a sensitivity sufficient to obta in the first data concerning the distribution of carboxylic acid in northern Victoria Land. The isocratic separation step permits high peak resolution with better baseline stability and lower detection limits with respect to gradient methods.
The application of this method to a 22 m firn core drilled at Hercules Névé gave background levels of about 10 and 8 μgl−1 for acetate and formate (with a ratio close to 1.0) and of about 2μgl−1 for propionate in the first 14.3 m firn-core depth. Preliminary data on relatively high in-phase concentration values for carboxylic acids, fluoride, ammonium, potassium and dust evidenced a long-term biomass-burning event. Further analyses on the particulate are needed to confirm the latter source, because of its persistence in atmospheric aerosol for a relatively long period. On the other hand, biomass-burning events in Antarctica can only come from long-range transport. Therefore, their fingerprints should be different with respect to the observations of Legrand and de Angelis (1995,1996) and Legrand and others (1995) at Summit, Greenland, where high, sharp concentration spikes were found. The long-range transport smoothing effects could give slight concentration increases for long time periods.
Acknowledgements
This research was carried out with in the framework of a project on glaciology and palaeoclimatology of the Programma Nazionalc di Riccrchc in Antartidc, and financially supported by Ente Xazionale Energia e Ambiente through an agreement wilh Universita'degli Studi di Milano.



