Introduction
One of the most commonly cited patterns in the evolution of animals is the preferential extinction of larger-bodied species (Wallace Reference Wallace1889; Raup Reference Raup1986; Brown Reference Brown1995; Jablonski Reference Jablonski, Jablonski, Erwin and Lipps1996; Rudwick Reference Rudwick1997; Lyons et al. Reference Lyons, Smith and Brown2004; Cardillo et al. Reference Cardillo, Mace, Jones, Bielby, Bininda-Emonds, Sechrest, Orme and Purvis2005; Olden et al. Reference Olden, Hogan and Vander Zanden2007; Boyer Reference Boyer2010). The preferential loss of mammalian megafauna during Pleistocene extinctions was apparent even to the earliest scientists studying extinction (Rudwick Reference Rudwick1997) and evolution (Wallace Reference Wallace1889). This pattern of size-biased extinction among Pleistocene and Holocene land mammals has since been demonstrated on all relevant continents (Lyons et al. Reference Lyons, Smith and Brown2004; Smith et al. Reference Smith, Elliott Smith, Lyons and Payne2018). Current extinction threat is also correlated with body size across living species of mammals (Cardillo et al. Reference Cardillo, Mace, Jones, Bielby, Bininda-Emonds, Sechrest, Orme and Purvis2005; Davidson et al. Reference Davidson, Hamilton, Boyer, Brown and Ceballos2009), birds (Gaston and Blackburn Reference Gaston and Blackburn1995), reptiles (Tingley et al. Reference Tingley, Hitchmough and Chapple2013), and fishes (Olden et al. Reference Olden, Hogan and Vander Zanden2007), suggesting shared causal factors, at least within vertebrates. A bias toward the extinction of larger-bodied species has therefore been included in generalized models of body-size evolution, even those that ultimately predict an overall trend toward larger body sizes (e.g., Maurer et al. Reference Maurer, Brown and Rusler1992; Clauset and Erwin Reference Clauset and Erwin2008).
Despite the long-standing interest in the relationship between body size and extinction across evolutionary time and the extensive analysis of living and fossil terrestrial vertebrates, the extent of size bias in extinction across the history of marine animal life remains largely unknown. Only a few studies have examined the size bias of extinction at the global scale for even a single Linnaean class of animals in one or a few geologic intervals; many of these focus on the end-Cretaceous mass extinction and the Neogene, and most address subclades of classes Bivalvia and Gastropoda (Valentine and Jablonski Reference Valentine and Jablonski1986; Jablonski and Raup Reference Jablonski and Raup1995; Lockwood Reference Lockwood2005; Smith and Roy Reference Smith and Roy2006; Rivadeneira and Marquet Reference Rivadeneira and Marquet2007; Harnik Reference Harnik2011), although there have also been a few studies of non-molluscan taxa (Powell Reference Powell2008; Friedman Reference Friedman2009; Harnik et al. Reference Harnik, Fitzgerald, Payne and Carlson2014; Zhang et al. Reference Zhang, Augustin and Payne2015; Martins et al. Reference Martins, Puckett, Lockwood, Swaddle and Hunt2018) and of size selectivity during earlier mass extinction events (McRoberts and Newton Reference McRoberts and Newton1995; Payne Reference Payne2005). Some of these studies find evidence for preferential extinction of larger-bodied species (Friedman Reference Friedman2009), but there exist at least as many examples of extinction events that were not significantly size biased (Jablonski and Raup Reference Jablonski, Lawton and May1995; Martins et al. Reference Martins, Puckett, Lockwood, Swaddle and Hunt2018) or that preferentially affected smaller-bodied animals (Payne Reference Payne2005; Smith and Roy Reference Smith and Roy2006; Rivadeneira and Marquet Reference Rivadeneira and Marquet2007; Crampton et al. Reference Crampton, Cooper, Beu, Foote and Marshall2010; Payne et al. Reference Payne, Bush, Heim, Knope and McCauley2016). Recent analyses comparing Pleistocene extinctions and modern extinction threat to the fossil record suggest that recent and anticipated extinctions are much more biased against larger animals than events in the fossil record have been (Payne et al. Reference Payne, Bush, Heim, Knope and McCauley2016; Smith et al. Reference Smith, Elliott Smith, Lyons and Payne2018), although this pattern is not universal. For example, larger body size is associated with lower threat levels in living bivalves (Collins et al. Reference Collins, Edie, Hunt, Roy and Jablonski2018), and some vertebrate groups have elevated extinction threat among both the largest and smallest species (Ripple et al. Reference Ripple, Wolf, Newsome, Hoffmann, Wirsing and McCauley2017).
Given the large environmental and phylogenetic differences between the marine and terrestrial biotas, it is not even clear that the same macroecological associations should be expected in both realms. Consequently, a comprehensive analysis of the marine fossil record is critical for determining the overall relationship between body size and extinction risk in the marine fossil record and how this relationship varies across time and among higher taxa. Few previous studies have assessed extinction selectivity across multiple time intervals and multiple higher taxa, leaving unclear the extent to which size bias does or does not vary across time and taxa. The consistent association between smaller body size and elevated extinction probability in a combined analysis of fish and mollusks across the Cenozoic as well as the five major mass extinction events hints at such consistency (Payne et al. Reference Payne, Bush, Heim, Knope and McCauley2016), but the mixing of higher taxa and lack of comprehensive data in that study inhibit a detailed biological interpretation.
Assessing the potential biological meaning of an association between smaller body size and elevated extinction risk is complicated by sampling biases. Evidence from Cenozoic fossil bivalves and gastropods indicates that sampling completeness varies as a function of body size within these groups (Jablonski et al. Reference Jablonski, Roy, Valentine, Price and Anderson2003; Cooper et al. Reference Cooper, Maxwell, Crampton, Beu, Jones and Marshall2006; Valentine et al. Reference Valentine, Jablonski, Kidwell and Roy2006; Sessa et al. Reference Sessa, Patzkowsky and Bralower2009), and gaps in the fossil record of certain Early Triassic gastropod genera are consistent with a similar sampling bias (Payne Reference Payne2005). This sampling bias leaves open the possibility that an inverse association between body size and extinction probability could result from the poorer sampling of smaller-bodied taxa. However, like extinction selectivity, the extent to which fossil record completeness varies as a function of organism size has never been examined for most higher taxa in most intervals of geologic time. And, more germane to the present question, prior analyses of extinction selectivity in the marine realm have taken the observed stratigraphic ranges at face value, rather than assessing and correcting for incompleteness and sampling bias.
Capture–mark–recapture (CMR) approaches provide one statistical method that can be applied to the fossil record to estimate true extinction (and origination) patterns and associated sampling biases from occurrence data (Liow and Nichols Reference Liow, Nichols, Alroy and Hunt2010). Although the approach was first introduced to the paleontological literature in the 1980s (Nichols and Pollock Reference Nichols and Pollock1983; Conroy and Nichols Reference Conroy and Nichols1984; Nichols et al. Reference Nichols, Morris, Brownie and Pollock1986), it has been applied infrequently over the subsequent decades (Connolly and Miller Reference Connolly and Miller2001a,Reference Connolly and Millerb, Reference Connolly and Miller2002; Chen et al. Reference Chen, Melchin, Sheets, Mitchell and Fan2005; Kröger Reference Kröger2005; Liow et al. Reference Liow, Fortelius, Bingham, Lintulaakso, Mannila, Flynn and Stenseth2008; Liow and Finarelli Reference Liow and Finarelli2014; Finarelli and Liow Reference Finarelli and Liow2016; Martins et al. Reference Martins, Puckett, Lockwood, Swaddle and Hunt2018). These previous studies have been aimed primarily at assessing temporal variation in extinction intensity in light of sampling incompleteness rather than at assessing selectivity of extinction. Three studies have assessed size bias of extinction using CMR. Two studies address Neogene terrestrial mammals; one finds preferential extinction of large-bodied species (Liow et al. Reference Liow, Fortelius, Bingham, Lintulaakso, Mannila, Flynn and Stenseth2008), and the other finds no size bias in the extinction of genera (Tomiya Reference Tomiya2013). The sole study of marine animals, focusing on cytheroid ostracods of the Late Cretaceous, finds that size dimorphism, but not large size itself, is associated with elevated extinction risk (Martins et al. Reference Martins, Puckett, Lockwood, Swaddle and Hunt2018). To our knowledge, no previous study has attempted to quantitatively deconvolve the size biases of extinction and sampling simultaneously.
The fossil record of marine animals is an ideal archive of large-scale extinction selectivity patterns due to its high taxonomic diversity and extended temporal coverage. In this study, we use a global data set of 251,124 fossil occurrence records paired with body-size measurements (biovolume) for 9408 genera from four phyla of solitary (i.e., noncolonial), bilaterian animals (Arthropoda, Brachiopoda, Chordata, and Mollusca) to assess the size biases associated with both extinction and sampling across the Phanerozoic (485 to 1 Ma) via CMR analysis.
Materials and Methods
Body-Size Data
Biovolume (in mm3) is the metric of body size used in this study. Body-size data for fossil marine animal genera were obtained and updated from Heim et al. (Reference Heim, Knope, Schaal, Wang and Payne2015). These data represent measurements of fossil specimens that have been compiled at the genus level, with the largest specimen used to represent a genus in cases in which data existed for more than one specimen or species. Because size variation among species and genera is much larger than size variation within species and genera at the scale of the analysis conducted herein (Dommergues et al. Reference Dommergues, Montuire and Neige2002; Payne Reference Payne2005), error associated with size variation within species is unlikely to have a large influence on the results reported in this paper. In addition, log-transformed maximum dimension is generally strongly correlated with other measures of size, such as longest body axis, and so the choice of size metric should have at most minimal effect on the outcomes of the analysis (Novack-Gottshall Reference Novack-Gottshall2008).
In total, the data set analyzed for this study spans 9408 genera of fossil marine animals from eight Linnaean classes (Bivalvia, “bony fish,” Cephalopoda, Gastropoda, Ostracoda, Rhynchonellata, Strophomenata, and Trilobita) spanning four phyla (Arthropoda, Brachiopoda, Chordata, and Mollusca). Genera assigned to classes Actinopteri, Actinopterygii, and Teleostii were combined into an informal class of “bony fish.” Higher taxonomy, where available, was taken from the data set of Heim et al. (Reference Heim, Knope, Schaal, Wang and Payne2015), but replaced with values from the Paleobiology Database (PBDB; http://paleobiodb.org/data1.2) where missing from the data set of Heim et al. (Reference Heim, Knope, Schaal, Wang and Payne2015).
Occurrence Data
Fossil occurrence data were downloaded from the PBDB on 12 July 2018 using the call: https://paleobiodb.org/data1.2/occs/list.tsv?all_records&base_name=Animalia&show=paleoloc,classext&idreso=lump_gensub&limit=all". Only occurrences resolved to a single geologic age were included. As is common practice in the study of biodiversity dynamics in the fossil record, for purposes of increased taxonomic resolution (e.g., Foote Reference Foote2006; Foote and Miller Reference Foote and Miller2013), subgenera were elevated to genus-level for analyses. Due to the low stratigraphic resolution and limited taxonomic diversity for Cambrian data, the data were limited to Ordovician through Pleistocene occurrences. The final data set contains 251,124 occurrences from the target phyla and classes.
Statistical Methods
The size bias of extinction was analyzed in two ways. First, the size bias was assessed on an interval-by-interval basis in each class using the raw data of first and last occurrences. Second, the average size bias of extinction and sampling was assessed per era for each class using a CMR analysis. All statistical analyses were performed using R v. 3.5.0 (R Core Team 2018) within RStudio v. 1.1.447 (RStudio Team 2016).
Size bias of extinction in the raw data was calculated by comparing the mean values of log-transformed body sizes between victims and survivors for each Phanerozoic stage. The size bias was calculated at the class level for taxon–age combinations containing at least four victims and four survivors at the genus level. In a sensitivity analysis, this approach was extended to order- and family-level comparisons using the same sample size criteria. The statistical significance of the observed difference in mean size was assessed using a two-sample t-test assuming unequal variance via the t.test() function in R. We also tested for size bias of extinction in the raw data through a logistic regression analysis of extinction as a function of log-transformed biovolume using the family = binomial() option within the glm() function in R. These analyses assume that the observed first and last occurrences are equivalent to the true times of origination and extinction of genera at the resolution of geologic ages and, therefore, do not correct for any size bias in sampling that might influence the apparent size bias of extinction.
Because the observed stratigraphic ranges of genera may differ from their true times of origination at extinction, even at the resolution of geologic stages (Strauss and Sadler Reference Strauss and Sadler1989; Marshall Reference Marshall1997), and because there is evidence for size bias in the sampling of fossil marine animals (Cooper et al. Reference Cooper, Maxwell, Crampton, Beu, Jones and Marshall2006; Sessa et al. Reference Sessa, Patzkowsky and Bralower2009), it is important to assess the potential role of size-based sampling bias in creating any evidence of extinction selectivity (or even lack thereof) in the raw fossil range data.
To test for size bias in the completeness of the fossil record and to correct for its potential influence on apparent extinction selectivity, we conducted a CMR analysis of extinction selectivity using the “marked” package (Laake et al. Reference Laake, Johnson and Conn2013) in R. Each genus was marked as either present (observed occurrence in the PBDB) or absent (no occurrence in the PBDB) for each Phanerozoic age. Analysis was run using the Cormack-Jolly-Seber model (Cormack Reference Cormack1964; Jolly Reference Jolly1965; Seber Reference Seber1965) by employing the model=“probitCJS” option in the marked package unless otherwise noted.
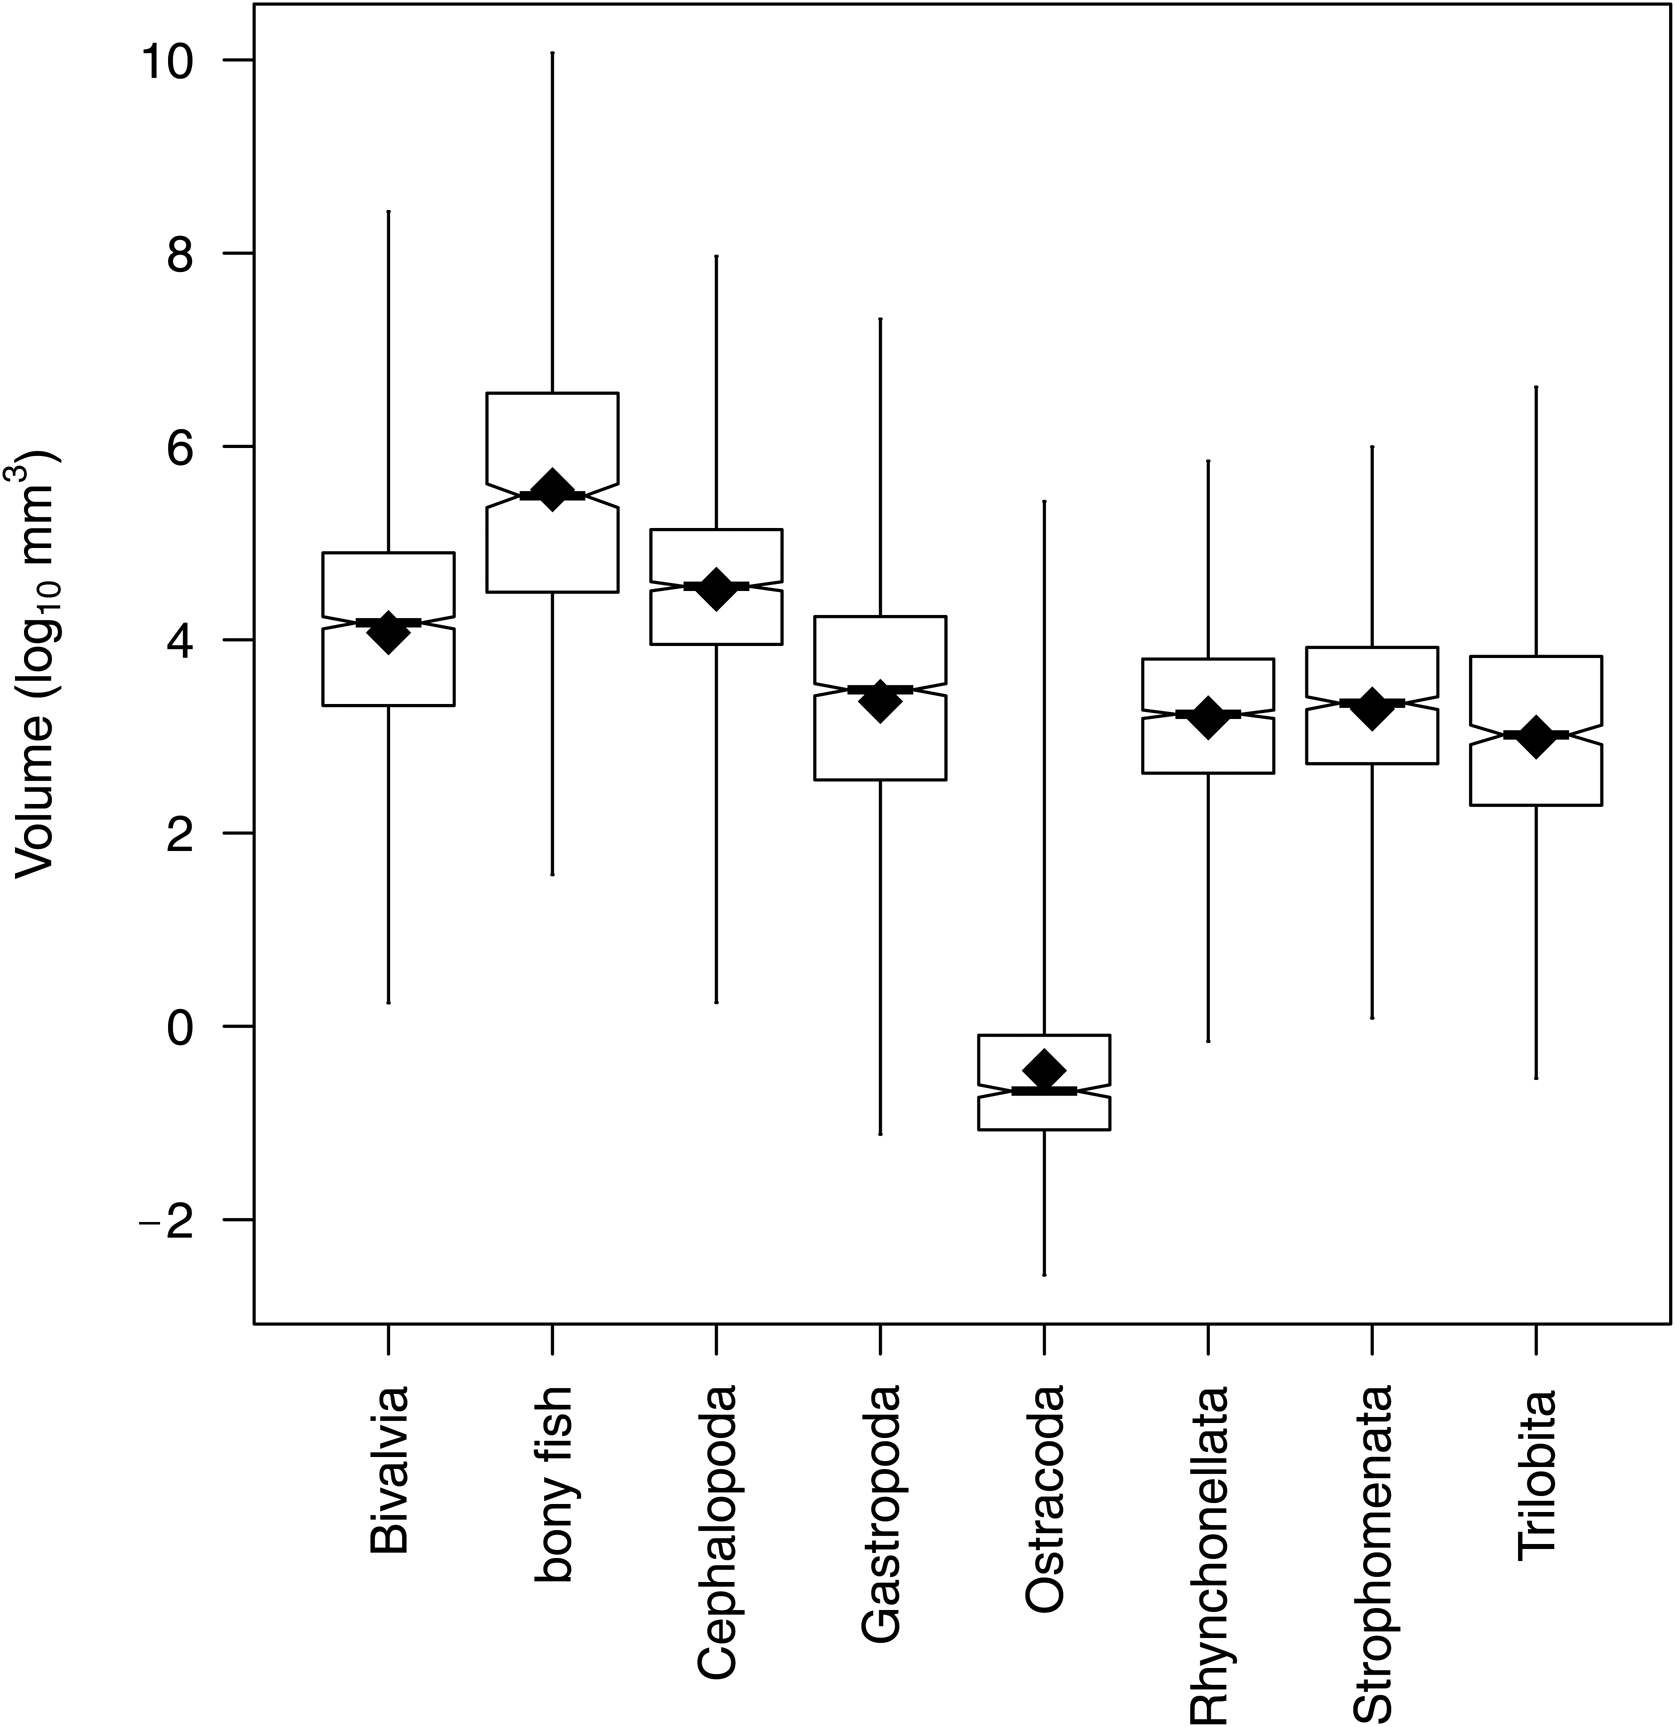
In the CMR analysis, body size was coded as a continuous variable, using the log10-transformed maximum biovolume (in mm3) as the measure of size. All of the studied classes have nearly symmetrical size distributions with mean values very close to the median values (Fig. 1). In sensitivity analyses, sizes were rescaled relative to order and family mean values so that deviation from the order or family mean value could be assessed as a predictor of extinction at the class level. This rescaling was conducted to test whether or not size selectivity at the class level resulted from the mixing of lower taxonomic groups with systematically different sizes and different extinction rates but that were generally not experiencing size-biased extinction within the groups.
Box plot of log-transformed genus biovolumes by Linnaean class, illustrating relatively symmetrical size distributions and similar size ranges across classes. Boxes span the interquartile range, and whiskers extend to most extreme values. Filled diamonds indicate mean values.

Using CMR, extinction was modeled as an additive function of time interval and body size, and sampling completeness was simultaneously modeled as an additive function of time interval (geologic age) and body size: Two equations were fit in the CMR model: (1) extinction ~ size + time; and (2) sampling ~ size + time. To assess potential changes in extinction dynamics or sampling patterns across time, analyses were conducted separately for each Phanerozoic era (Paleozoic, Mesozoic, or Cenozoic), yielding one coefficient (beta value) describing the association between size and extinction and another describing the association between size and sampling. One stage of overlap into the subsequent era was included in the occurrence data for the Paleozoic and Mesozoic analyses so that the selectivity of the era-bounding mass extinctions could be incorporated into the estimates of extinction and sampling selectivity. Because these events represent single intervals within analyses that span 18 (Cenozoic) to 38 stages (Paleozoic), it is unlikely that including or excluding the mass extinction events would have any large effect on the apparent selectivity across the era as a whole. Indeed, excluding this overlap has no meaningful effect on the results. We adopted this approach because there is strong evidence that both extinction intensity and sampling completeness vary as a function of geologic time (Raup and Sepkoski Reference Raup and Sepkoski1982; Alroy et al. Reference Alroy, Marshall, Bambach, Bezusko, Foote, Fursich, Hansen, Holland, Ivany, Jablonski, Jacobs, Jones, Kosnik, Lidgard, Low, Miller, Novack-Gottshall, Olszewski, Patzkowsky, Raup, Roy, Sepkoski, Sommers, Wagner and Webber2001), whereas the question that motivated the study is whether or not there is a consistent (if not strictly constant) directionality to the effect of body size on extinction likelihood and sampling completeness. There remain questions as to whether or not the size bias of extinction and/or sampling varies with time depending, for example, on the causes of extinction, but such analysis is beyond the scope of this study.
We did not adjust the data to address the fact that our time intervals are not of the same length. Adjusting for interval duration would be important if extinction occurred at a stochastically constant rate across time within intervals, such that interval duration tended to be associated with extinction intensity. While there is undoubtedly some background extinction that occurs across the duration of each geologic age, models assuming the concentration of genus extinctions at the ends of stages better fit the overall data than models assuming continuous extinction within stages (Foote Reference Foote2005; Peters and Heim Reference Peters and Heim2011). Hence, for the purposes of this analysis, it is sufficient and appropriate to consider stages as discrete events in sequence rather than as intervals of differing duration.
The CMR analysis was run separately for each geologic era to assess the possibility that extinction and/or sampling biases have changed across geologic time. In the primary analysis (using the Cormack-Jolly-Seber model), the extinction and sampling biases were assessed conditioned on the first occurrences of genera, such that origination (or total diversity) was not modeled. This approach reduces the number of parameters being fit (adding origination adds one parameter per time interval plus a potential parameter for size bias of origination), increasing computational speed and statistical power at smaller sample sizes. In one supplementary analysis, origination rates and the size bias associated with origination were assessed in addition to extinction and sampling using the POPAN formulation of the Jolly-Seber model (Pradel Reference Pradel1996) through the model=“JS” option in the marked package. In two other supplementary analyses, body size was rescaled relative to the mean value for the order or family, rather than the class, to assess whether any size bias to extinction or sampling observed when size was coded at the class level resulted from the mixing of groups at lower taxonomic levels with different extinction or sampling properties but lacking size bias within them.
Analysis of Geographic Range
To assess the potential influence of geographic range on the association between body size and extinction risk, we included geographic range as a time-varying predictor variable for each genus. Geographic range was calculated as the maximum great circle distance between occurrences within the time interval. Intervals lacking any occurrences for a given genus were set to a geographic range of zero.
Species-Level Analysis
Permian brachiopod data were downloaded from the PBDB on 30 July 2018. The initial download consisted of 81,081 linear measurements of 4035 brachiopod species belonging to 785 genera extant during the Permian period. All measurements were entered into the PBDB by a single authorizer, Matthew Clapham. We calculated the maximum linear shell dimension and number of constituent species for each genus. We then used the PBDB to obtain the total stratigraphic range for each genus. The call used for the download was https://paleobiodb.org/data1.2/specs/measurements.csv?base_name=Brachiopoda&taxon_reso=species&interval=Permian&show=spec,class,ref,entname.
Results
Face-Value Analysis of the Fossil Record
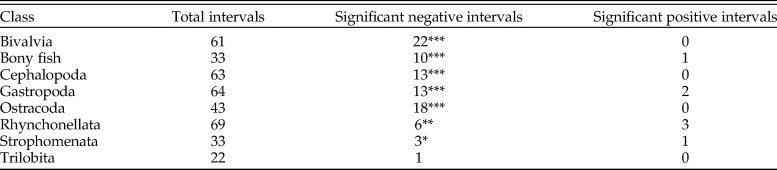
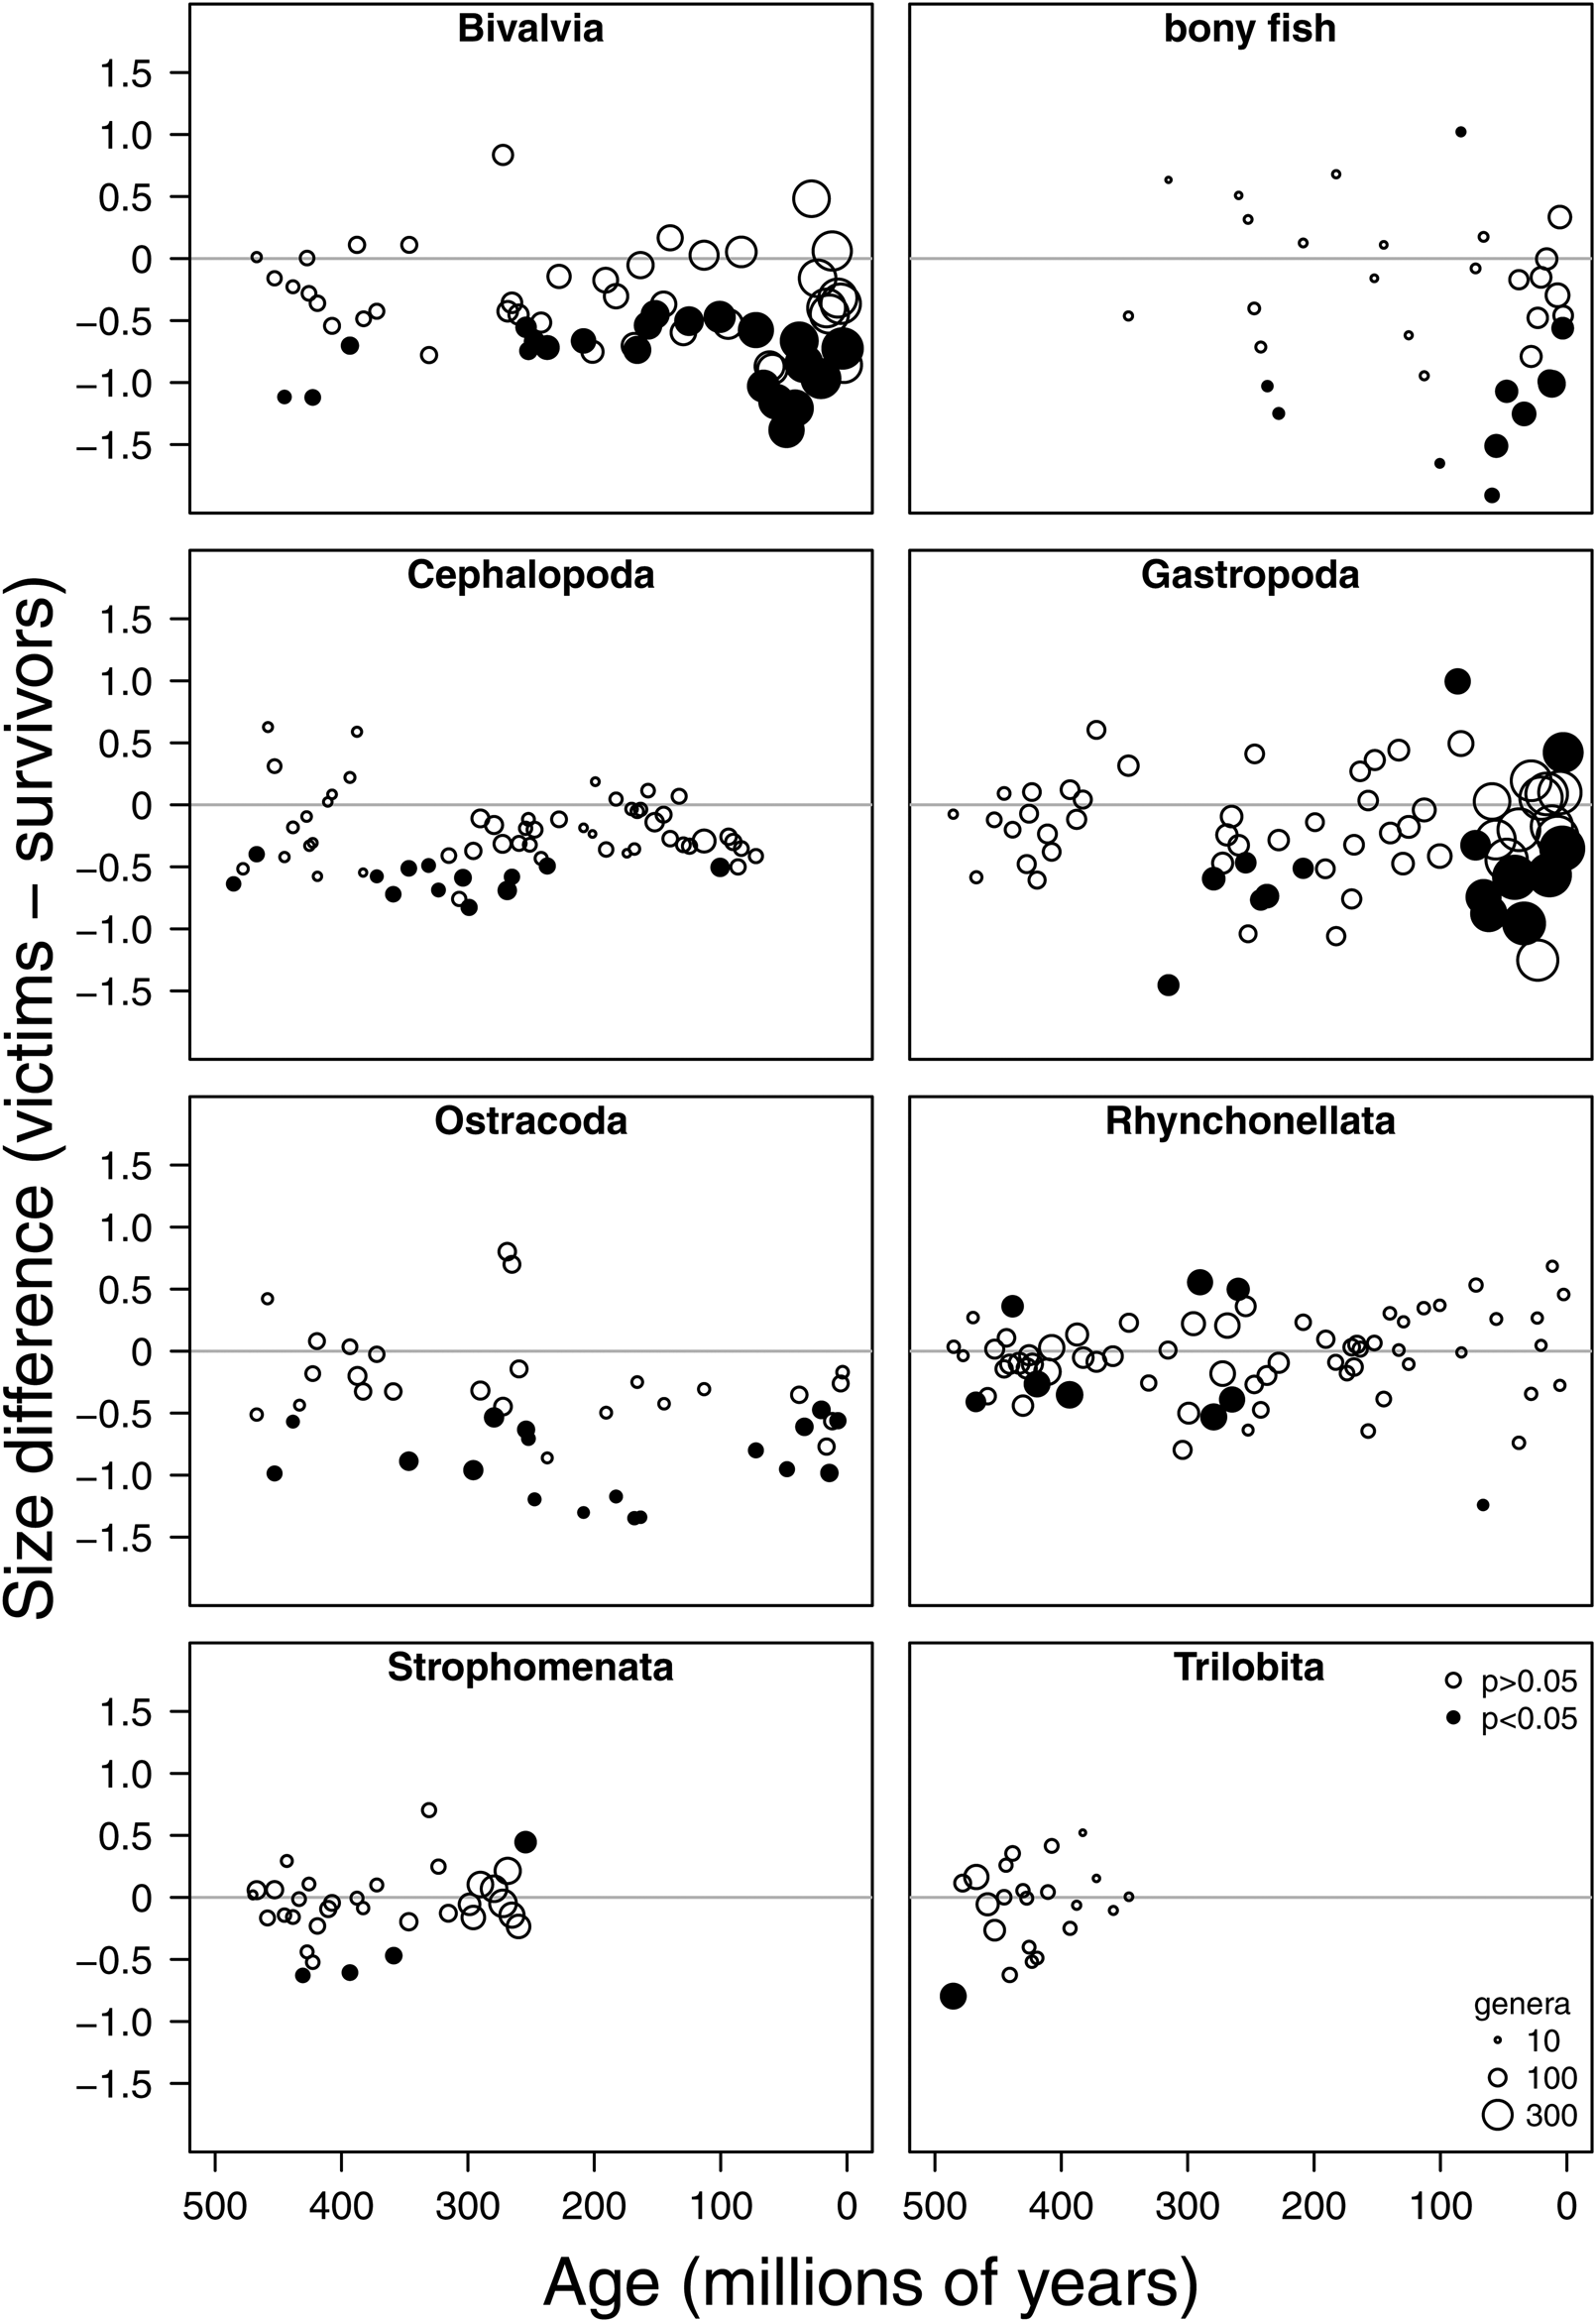
A face-value analysis of the fossil record, using first and last known occurrences to approximate times of origination and extinction, reveals strong evidence for the preferential extinction of smaller-bodied genera in most classes and during most stages. In an analysis comparing the mean size of victims (i.e., genera with last occurrences within the stage) to that of survivors (i.e., genera with occurrences in later stages) for each class in each stage (containing at least four victims and four survivors to enable statistical analysis), there is a strong tendency for the victims to be smaller than the survivors (Fig. 2). Using two-sample t-tests assuming unequal variance between groups, there is evidence that the bias toward the extinction of smaller-bodied genera is larger and more common than would be expected by chance. At α = 0.05, there are 86 class-by-stage combinations with evidence for biased extinction of smaller genera versus only seven with evidence for biased extinction of larger genera. For a two-sided test using a significance cutoff of α = 0.05, one would expect 9.7 ± 4.3 (95% CI) significant cases each for extinction of larger genera and smaller genera in random data with no causal association given 388 class-by-stage combinations examined. Thus, the number of instances of preferential extinction of smaller-bodied genera is far larger than expected at random, whereas the number of cases of preferential extinction of larger-bodied genera is within random expectation. Within individual classes, the number of significant positive values (victims bigger than survivors) is always within the range of expectation, whereas the number of significant negative values is far more than expected by chance given the number of intervals analyzed for seven of the eight classes spanning all four phyla (Table 1). For half of the studied classes (Bivalvia, Cephalopoda, Ostracoda, and Trilobita), the only intervals exhibiting significant differences between victims and survivors are associated with the preferential extinction of smaller-bodied genera (Table 1, Fig. 2). For no class are the instances of significant bias toward the preferential extinction of larger-bodied genera more common than expected by chance given the multiple tests or more common than the preferential extinction of smaller-bodied genera within the class.
Correlation between mean body size and the difference in size between victims and survivors by class. Two-sided probability of obtaining this many significant intervals by chance at α = 0.05 given random data is indicated as follows: *p < 0.05; **p < 0.01; ***p < 0.001.

Scatter plots of differences in mean size between victims and survivors of extinction as a function of geologic age, illustrating that extinction victims are typically smaller than survivors, whether considering all class-by-stage combinations or only those combinations in which the associations are statistically significant. Differences that are statistically significant (p < 0.05) based on a two-sample t-test assuming unequal variance are indicated by filled symbols.

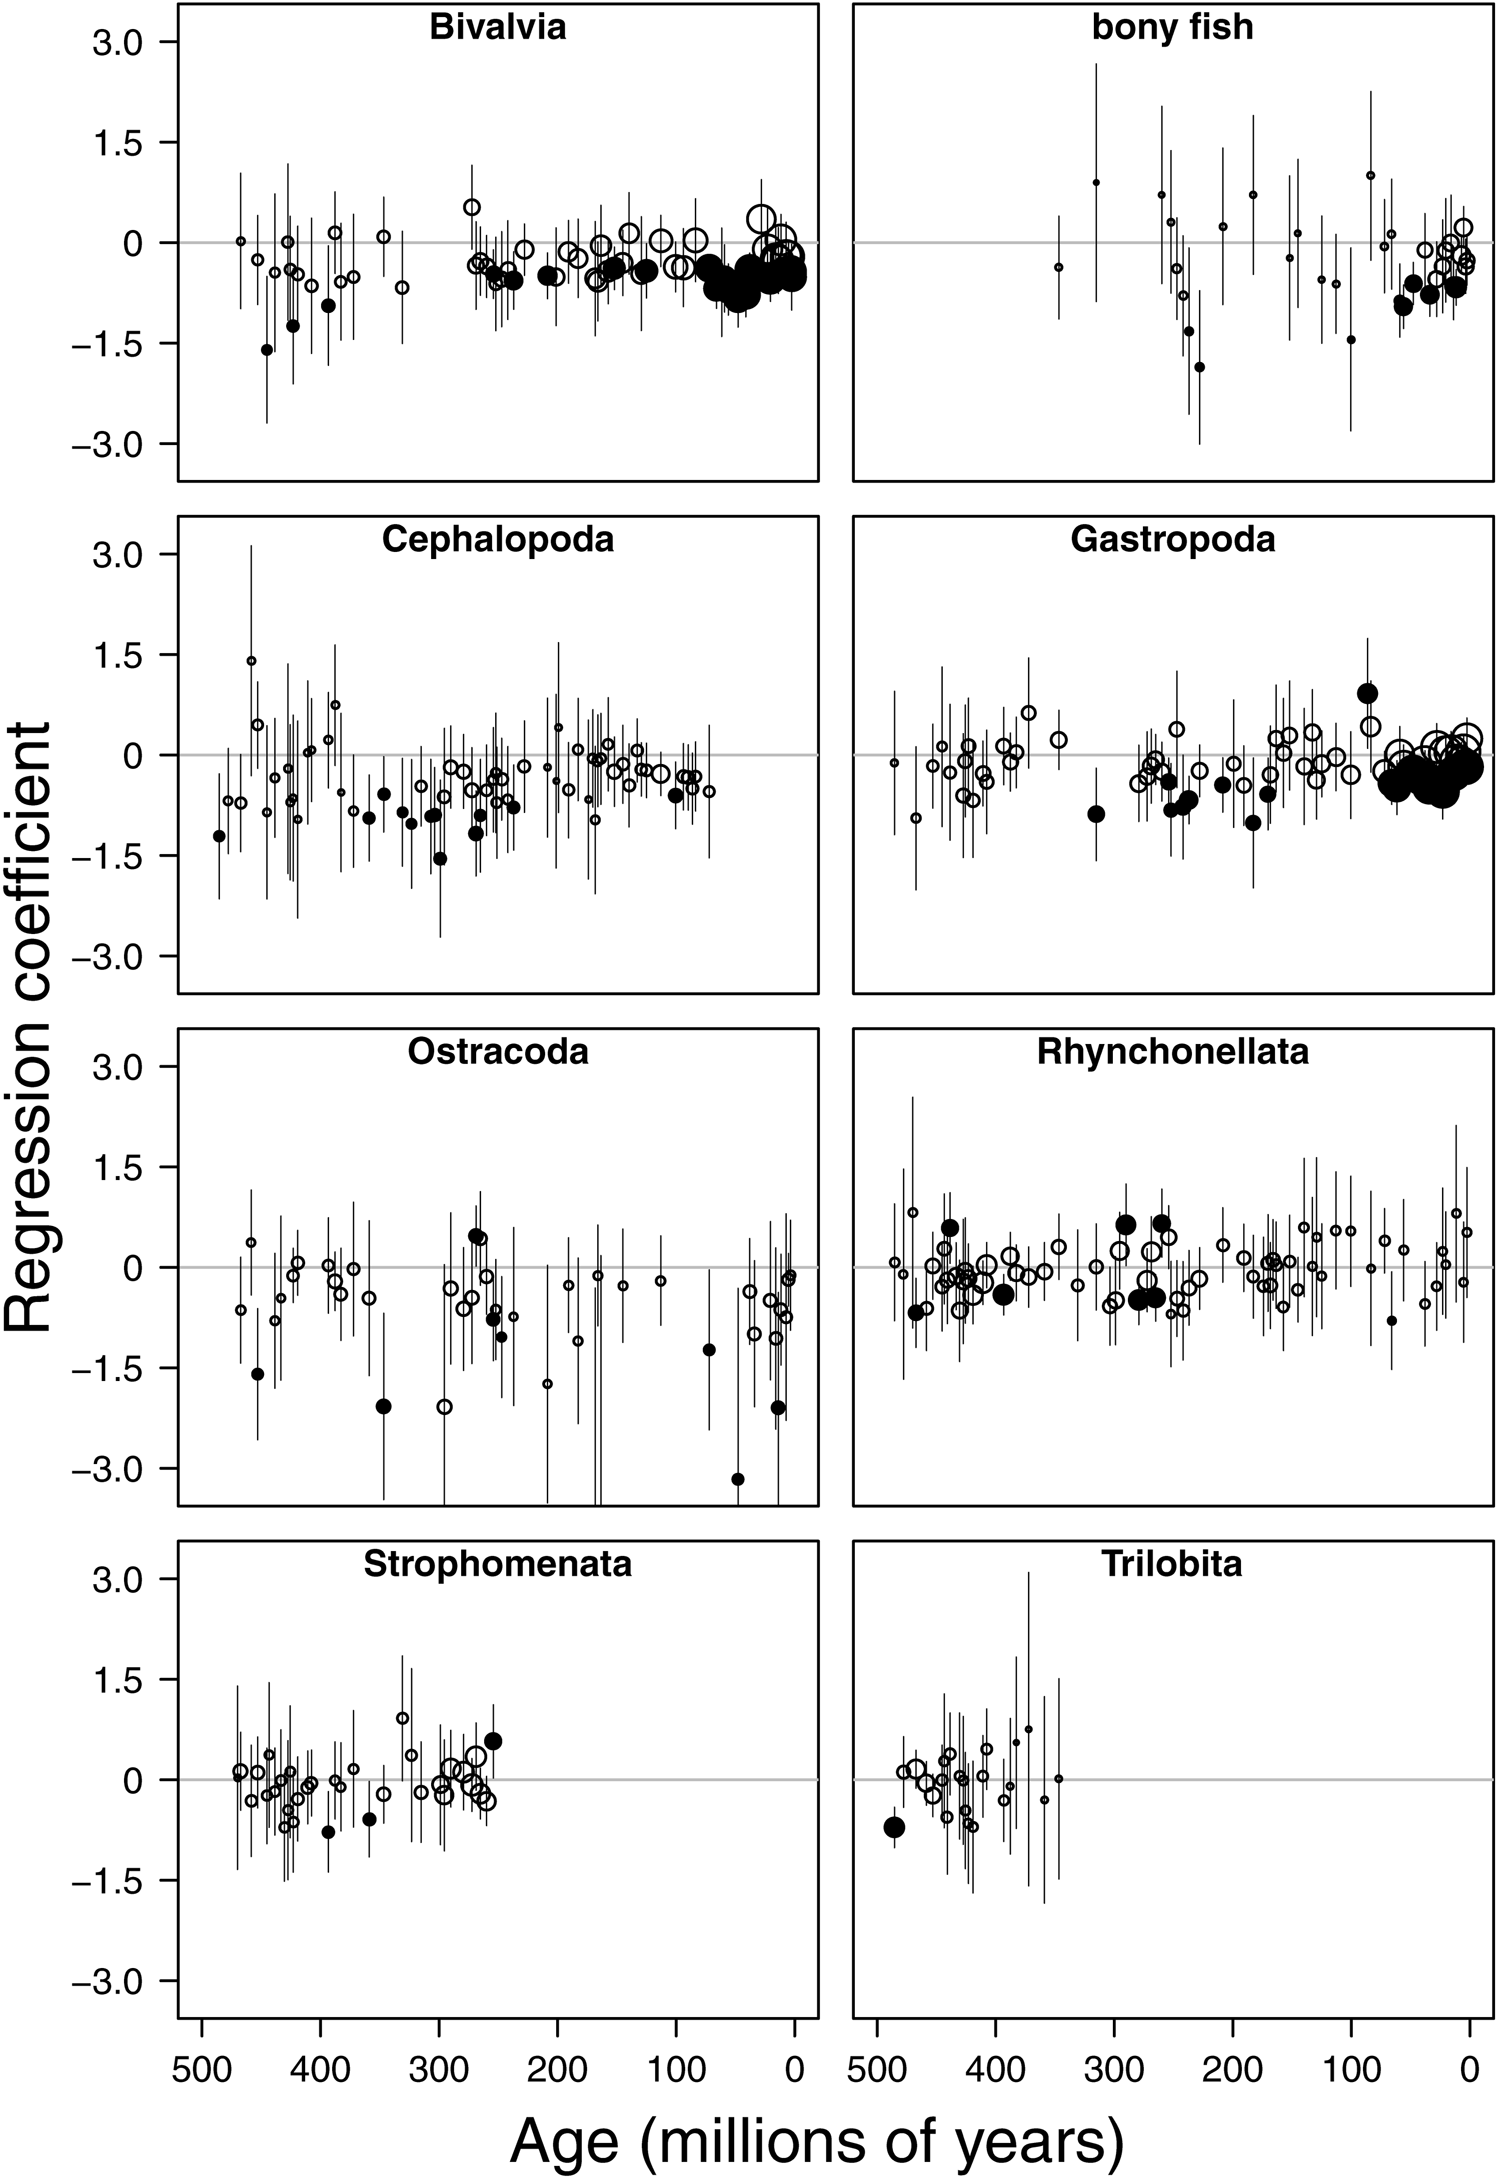
Differences in mean size may not accurately reflect extinction selectivity, because the size variation within victims and within survivors also determines how much the probability of extinction actually changes with a given change in body size. The coefficient of association between size and extinction in a logistic regression analysis provides a measure of selectivity that incorporates information about both the difference in mean value between victims and survivors and the distribution of sizes within each grouping. We find a strong correlation between the difference in mean size between victims and survivors (used in the t-test) and the coefficient of association between body size and extinction probability obtained in a logistic regression model using size as a predictor and extinction status as the outcome variable (ordinary least squares R2 = 0.77), and a plot of regression coefficients on a class-by-class, stage-by-stage basis yields a similar result to an analysis of size differences between victims and survivors (Fig. 3).
Scatter plots of regression coefficients (beta values) from logistic regression analyses of extinction as a function of log10-transformed biovolume, illustrating that extinction victims are typically smaller than survivors and that results from regression coefficients compare well with simple differences in mean values between victims and survivors (illustrated in Fig. 2). Plotting conventions follow Fig. 2. Error bars indicate 95% confidence intervals on the coefficient values.

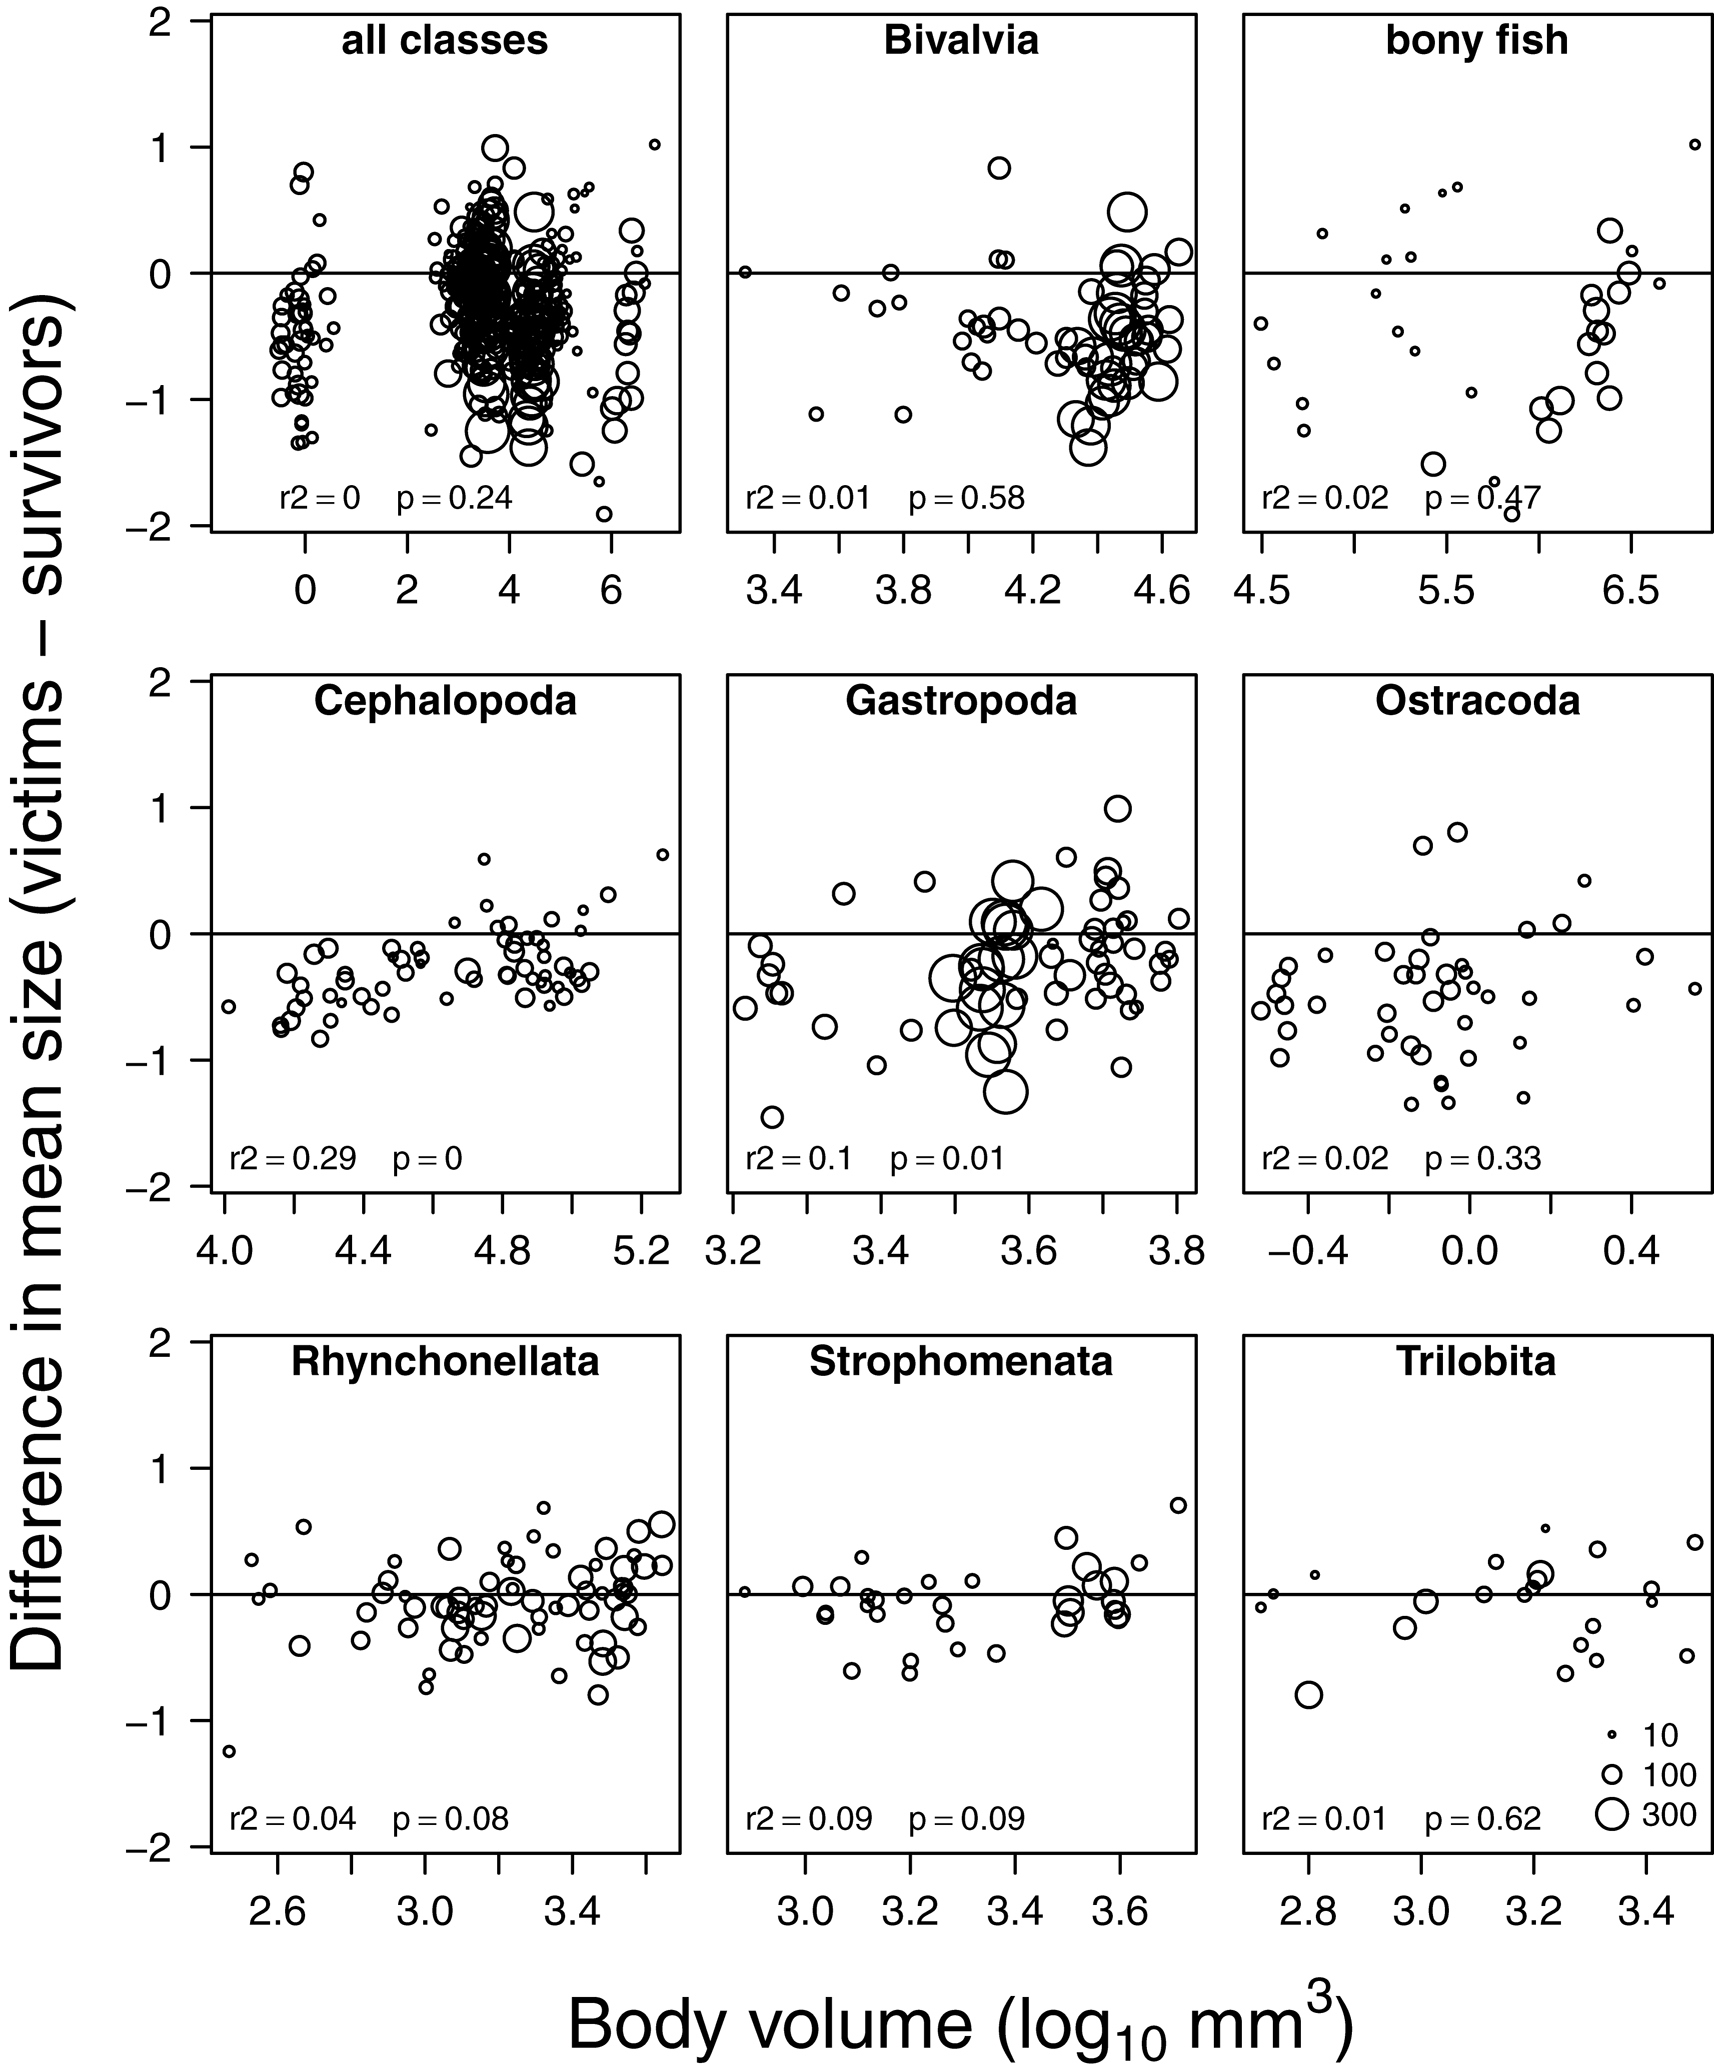
The differences in size between victims and survivors are not strongly associated with the absolute mean size of the class in the given stage (Fig. 4). Overall, the data do not exhibit any trend in the size difference between victims and survivors across a six-order-of-magnitude range in average biovolume. The smallest (ostracods) and largest (bony fish) classes contain the stages with the greatest bias toward the preferential extinction of smaller genera. Within classes, two classes (Cephalopoda and Gastropoda) exhibit significant positive associations between the size difference and the absolute mean size, such that the size bias of extinction tends to be smaller when the overall mean size of the class is larger. However, the absolute mean size of the class explains less than 10% of the variance in the size difference between victims and survivors, with the sole exception of cephalopods, for which it explains 29% of the variance. These findings suggest a bias against absolute small size within cephalopods and perhaps gastropods.
Scatter plots of differences in mean size between victims and survivors of extinction (by class and stage) as a function of absolute mean size, illustrating that there is little correspondence between the absolute size and the size difference between victims and survivors.

CMR Analysis
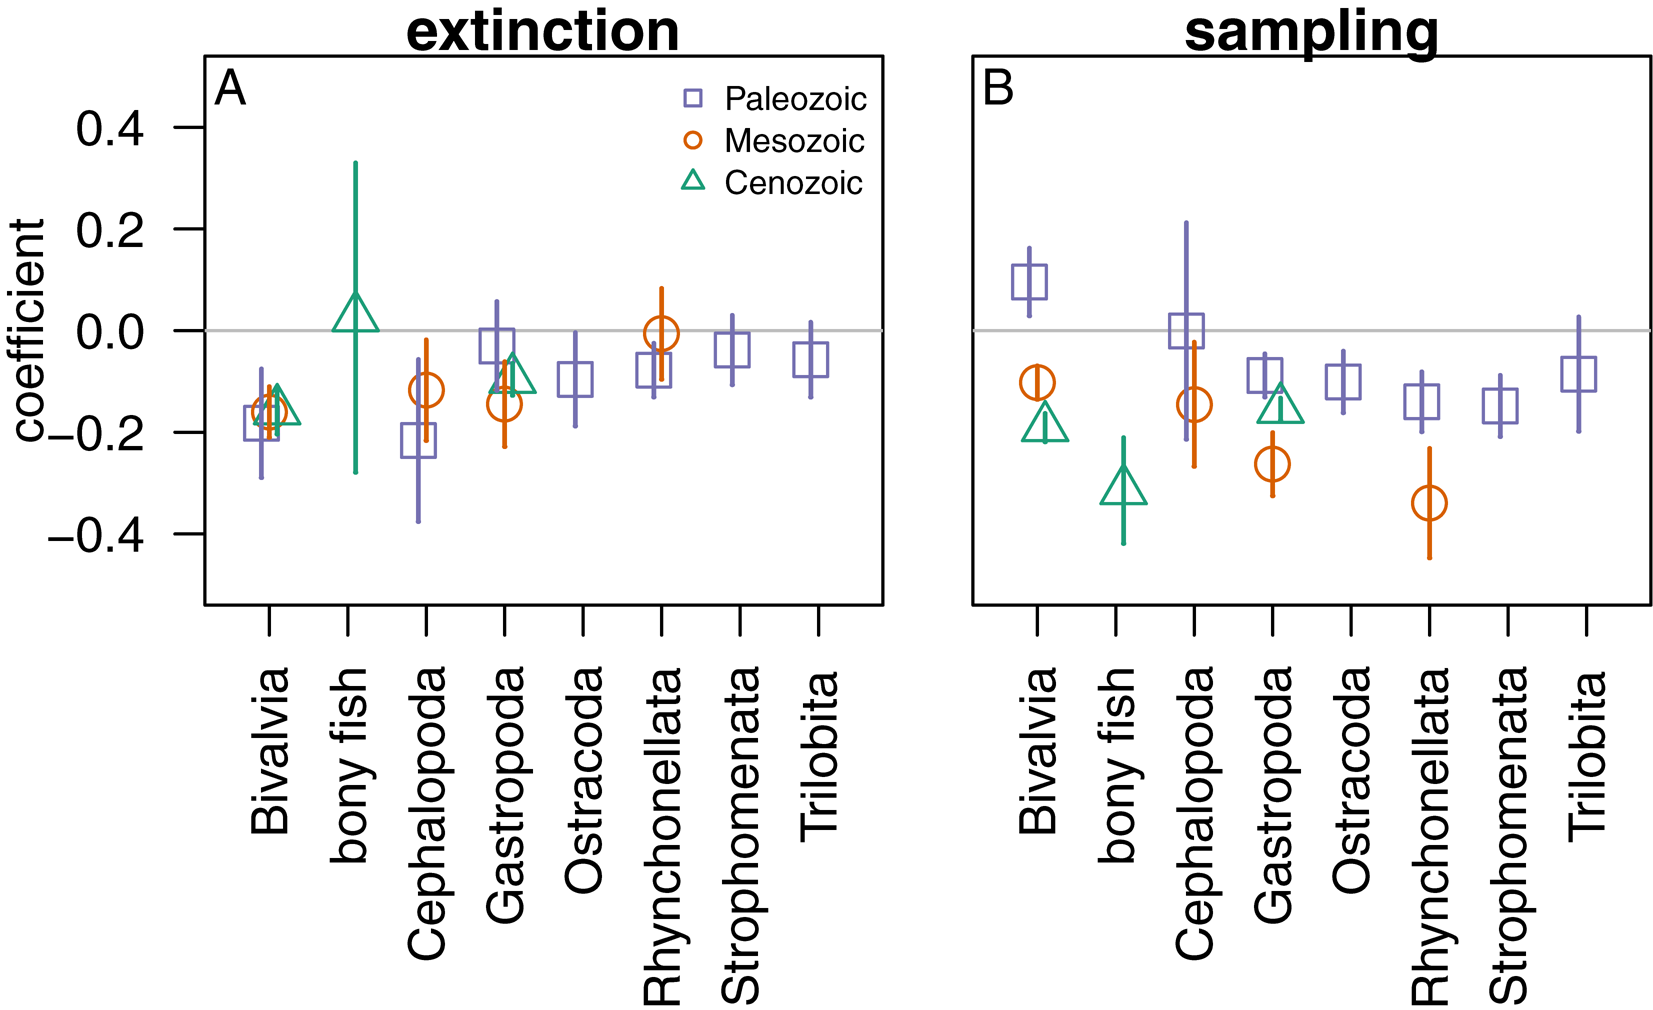
CMR analysis of the fossil record reveals a consistent bias against the sampling of smaller-bodied genera within classes (Fig. 5). This effect is statistically significant for 11 of the 14 class-by-era combinations examined. Only Paleozoic bivalves show evidence for the preferential sampling of smaller-bodied genera. The size bias of sampling in the fossil record is persistent across microfossils (Ostracoda) and macrofossils (all other classes) as well as across time, suggesting that it is a function of relative size rather than absolute size and that it is not strongly affected by differences in preservation or sampling styles across either geologic eras or higher taxa.
Plot of associations between body size and both extinction (A) and sampling completeness (B) for marine animal genera across the Phanerozoic from capture–mark–recapture analysis, illustrating that smaller-bodied genera are more likely to go extinct and less likely to be sampled than their larger-bodied counterparts. Regression coefficients (beta values) are plotted on the vertical axis and taxonomic groupings are used along the horizontal axis. The odds ratio indicates the change in the odds of extinction for a 1 log unit change in the biovolume of the genus (where the odds are q/(1 − q), where q is the probability of extinction). The coefficient (beta value) is the natural logarithm of the odds ratio.

There remains a consistent, inverse association between body size and extinction probability after accounting for the size bias in the completeness of the fossil record (Fig. 5). The association between smaller body size and greater probability of extinction is statistically significant in at least one era for six of the eight studied classes and in 8 of the 14 class-by-era combinations. There is no class-by-era combination that exhibits a statistically significant association between larger body size and higher extinction risk, and only Cenozoic bony fish exhibit a slight, nonsignificant tendency toward the extinction of larger genera.
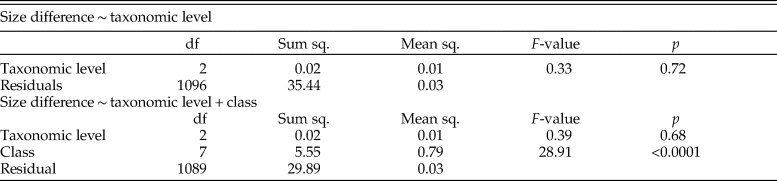
In principle, the size differences between victims and survivors could reflect differential extinction rates among subclades with different mean sizes within classes. Under this explanation, one would expect the size bias of extinction to become weaker or absent when size is rescaled relative to the mean value for the relevant subclade or lower level taxon, such as an order or family. To test for this possibility, we rescaled sizes relative to the mean values for the order or family. With size classified relative to the mean at lower taxonomic levels (order and family), the CMR analysis yields quantitatively similar results to the analysis conducted with the absolute size (Supplementary Figs. S1, S2). Similarly, the distributions of differences in mean size between victims and survivors calculated within orders and families following the face-value approach reported in Figure 2 are statistically indistinguishable from the distribution of differences observed at the class level (Table 2). Thus, the size bias of extinction remains unchanged at the lowest taxonomic levels available for analysis and does not appear to result from mixing of lower taxonomic groupings that, taken individually, do not exhibit size-biased extinction.
Results from ANOVA analyses modeling the difference in mean size between victims and survivors as a function of the taxonomic level of the size assignment and of the taxonomic level plus the class identity. The size differences are not statistically different when size is coded relative to the median of the relevant class, order, or family.

Effects of Taxonomic Practice and Anagenetic Change
Beyond sampling completeness, another potential explanation for the size bias of extinction is that it simply reflects greater rates of pseudoextinction (i.e., renaming of surviving lineages) at smaller body sizes. In many cases of pseudoextinction, renaming occurs due to anagenetic change in the surviving lineage and so should not be considered purely an artifact of taxonomic practice; it often has a strong basis in evolutionary change. Under this scenario, one would expect a bias toward the preferential origination of genera below the median size that is approximately equivalent to the bias associated with extinction. When the CMR model is extended to quantify the size bias of origination as well as of extinction, there is not a consistent and parallel bias of origination that offsets the extinction bias (Supplementary Fig. S3). In fact, preferential origination of larger-bodied genera is more common than the preferential origination of smaller-bodied genera, consistent with the overall trend toward larger body size in aggregate across these phyla (Heim et al. Reference Heim, Knope, Schaal, Wang and Payne2015) and with body-size evolution in Paleozoic brachiopods in particular (Novack-Gottshall and Lanier Reference Novack-Gottshall and Lanier2008). Thus, size bias of turnover or pseudoextinction does not adequately account for the data.
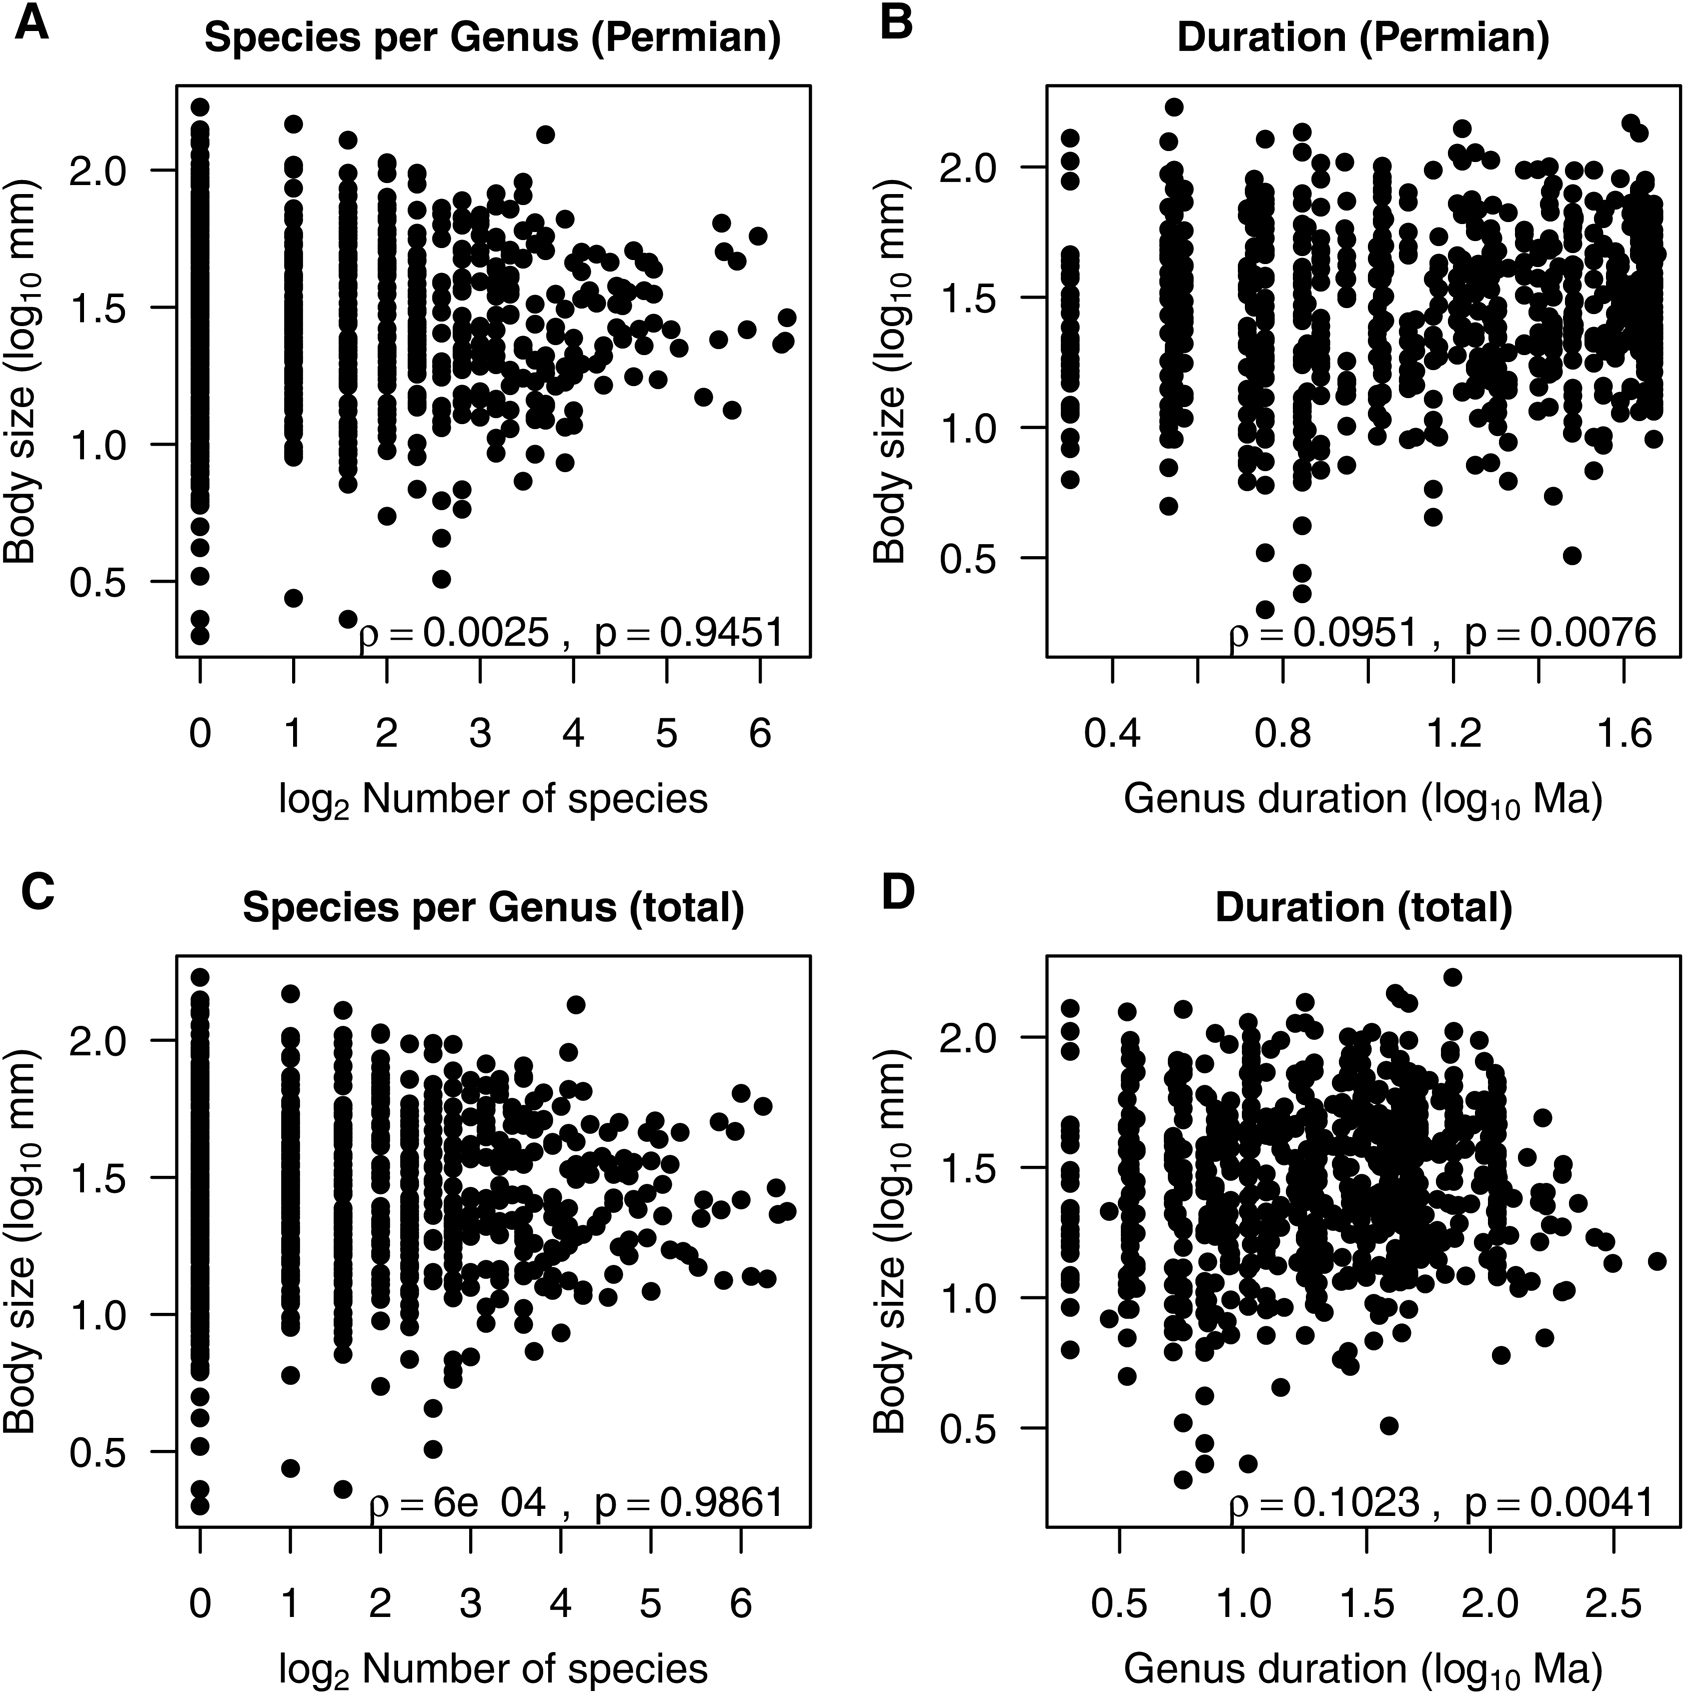
An additional scenario under which the size bias of extinction could result from taxonomic practice rather than evolutionary process is one in which there is a size bias in the process of describing genera and determining the member species, such that a genus with a larger body size also has other properties, such as the number of contained species, that reduce its likelihood of extinction. Under this hypothesis, more inclusive morphological criteria for larger-bodied genera could lead them to systematically include more species with an aggregate longer stratigraphic range than genera with less inclusive definitions. To test for this possibility, we examined a particularly complete, species-level data set of Permian brachiopods in the PBDB (see “Materials and Methods”). In these data, body size is not statistically associated with the number of the species in the genus and only very weakly predictive of the overall stratigraphic duration of the genus (Fig. 6).
Plot of species richness vs. mean body length (A,C) and stratigraphic duration vs. body length (B,D) for Permian brachiopod genera, illustrating the lack of correlation between species richness and body size as well as a weak association between genus duration and body size. The top row (A,B) shows species richness and stratigraphic durations tabulated only from species for which we have size measurements. The bottom row (C,D) shows species richness and stratigraphic durations tabulated from all species in the Paleobiology Database, regardless of whether or not they have size measurements. The results of Spearman rank-order correlation tests are given in the bottom right of each plot. The correlations between size and number of species per genus are insignificant. In contrast, the correlations of size and duration are significant (p < 0.05).

Association between Size and Geographic Range
Another potential explanation for the observed association is that body size is correlated with another trait, such as fecundity, generation time, or geographic range, that has a direct influence on extinction risk. Indeed, if the size bias of extinction is not a product of sampling bias or an artifact of taxonomic practice, then the association between body size and extinction almost certainly results from the allometric scaling of one or more ecological or physiological traits with body size. Among the potential correlates of body size that could explain its association with extinction, previous analyses suggest that small geographic range is the most important risk factor for extinction of genera across geologic timescales (e.g., Jablonski Reference Jablonski, Lawton and May1995; McKinney Reference McKinney1997; Liow Reference Liow2007; Payne and Finnegan Reference Payne and Finnegan2007; Harnik et al. Reference Harnik, Simpson and Payne2012). Macroecological evidence for a positive scaling between body size and geographic range (Gaston Reference Gaston1990; Goodwin et al. Reference Goodwin, Dulvy and Reynolds2005; Harnik Reference Harnik2011; Strona et al. Reference Strona, Galli, Montano, Seveso and Fattorini2012) is consistent with geographic range underpinning the size bias of extinction in the fossil record.
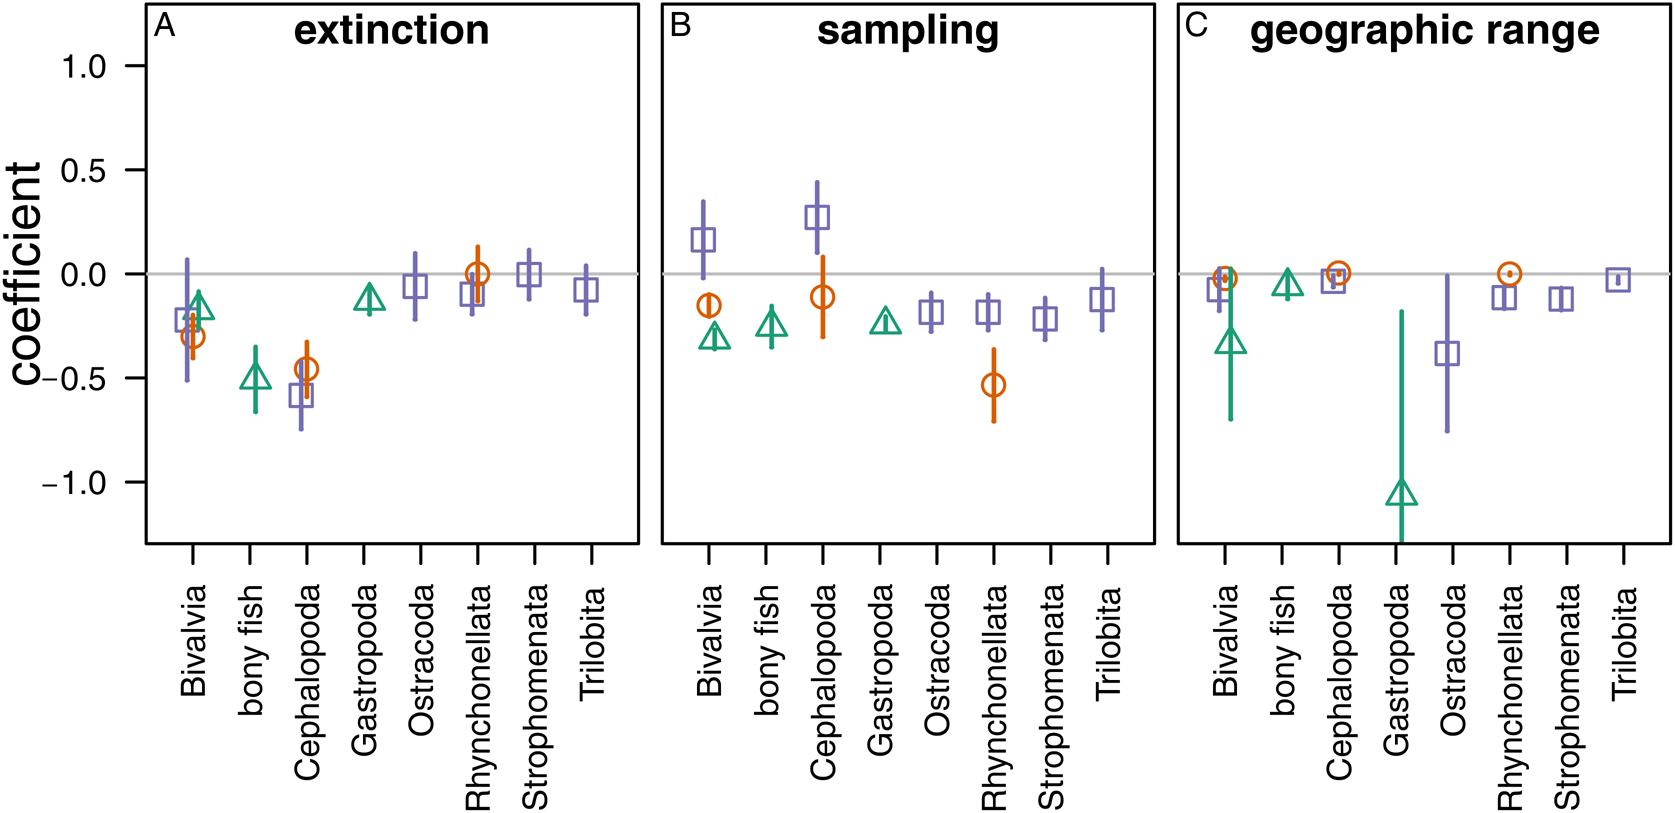
Including geographic range as a time- and taxon-varying extinction predictor in the CMR analysis indicates that size-dependent differences in geographic range do not account for the size bias of extinction (Fig. 7). In this analysis, small body size remains generally associated with lower sampling completeness and higher extinction probability, and small geographic range is also associated with higher extinction probability.
Plot of associations between body size and extinction (A), body size and sampling (B), and extinction and geographic range (C), illustrating that when the association between geographic range and extinction is considered in the model, this does not remove the association between body size and extinction probability. This finding indicates that the association between body size and extinction is not a simple by-product of an association between body size and geographic range. Axes and symbols as in Fig. 5.

Discussion and Conclusions
Body Size and Completeness of the Fossil Record
The motivation for this study was to assess the association between body size and extinction probability in the fossil record, but the necessity of controlling for size-related completeness of the fossil record in doing so also yields important information. Previous studies have shown that smaller-bodied mollusks, particularly bivalves and gastropods, are preferentially missing from the Cenozoic fossil record (Jablonski et al. Reference Jablonski, Roy, Valentine, Price and Anderson2003; Cooper et al. Reference Cooper, Maxwell, Crampton, Beu, Jones and Marshall2006; Valentine et al. Reference Valentine, Jablonski, Kidwell and Roy2006; Sessa et al. Reference Sessa, Patzkowsky and Bralower2009). The results from this study indicate that the fossil record is generally far less complete for smaller-bodied genera across eight classes spanning all three Phanerozoic eras. If anything, the sampling bias with respect to body size appears to be weaker in the Paleozoic than in subsequent eras, suggesting that the mixture of lithified and unlithified deposits more typical of the late Mesozoic and Cenozoic fossil records may create greater size bias in the completeness of the fossil record than a record known largely from lithified material, consistent with results from more focused analysis of Paleogene benthic mollusks (Sessa et al. Reference Sessa, Patzkowsky and Bralower2009). The finding of preferential sampling of smaller-bodied genera for Paleozoic bivalves is also consistent with previous findings that, unusually, Paleozoic type specimens for bivalves are smaller than material from bulk collections (Kosnik et al. Reference Kosnik, Jablonski, Lockwood and Novack-Gottshall2006), suggesting that different styles of preservation (e.g., cast and mold for Paleozoic bivalves) may have different associated size biases.
The existence of a size-based sampling bias across taxa that differ in number of skeletal elements (e.g., gastropods vs. fishes) and skeletal mineralogy (aragonite, calcite, apatite) argues that size itself, rather than some correlate of size, is the primary cause of this bias. Furthermore, the existence of the bias for taxa as disparate in body size as ostracods and fishes indicates that the bias does not operate across a threshold in absolute size but, rather, functions as a gradient across many orders of magnitude in organism size.
The data available do not precisely constrain the causes of the size bias in the completeness of the fossil record. However, previously mentioned factors such as the relative durability of larger versus smaller skeletal elements, the difficulty of recovering fossils smaller than a few millimeters in maximum dimension from lithified material, and the greater ease of identifying and collecting larger specimens in the field are all likely to be contributing factors (cf. Kidwell and Bosence Reference Kidwell, Bosence, Allison and Briggs1991; Cooper et al. Reference Cooper, Maxwell, Crampton, Beu, Jones and Marshall2006; Sessa et al. Reference Sessa, Patzkowsky and Bralower2009).
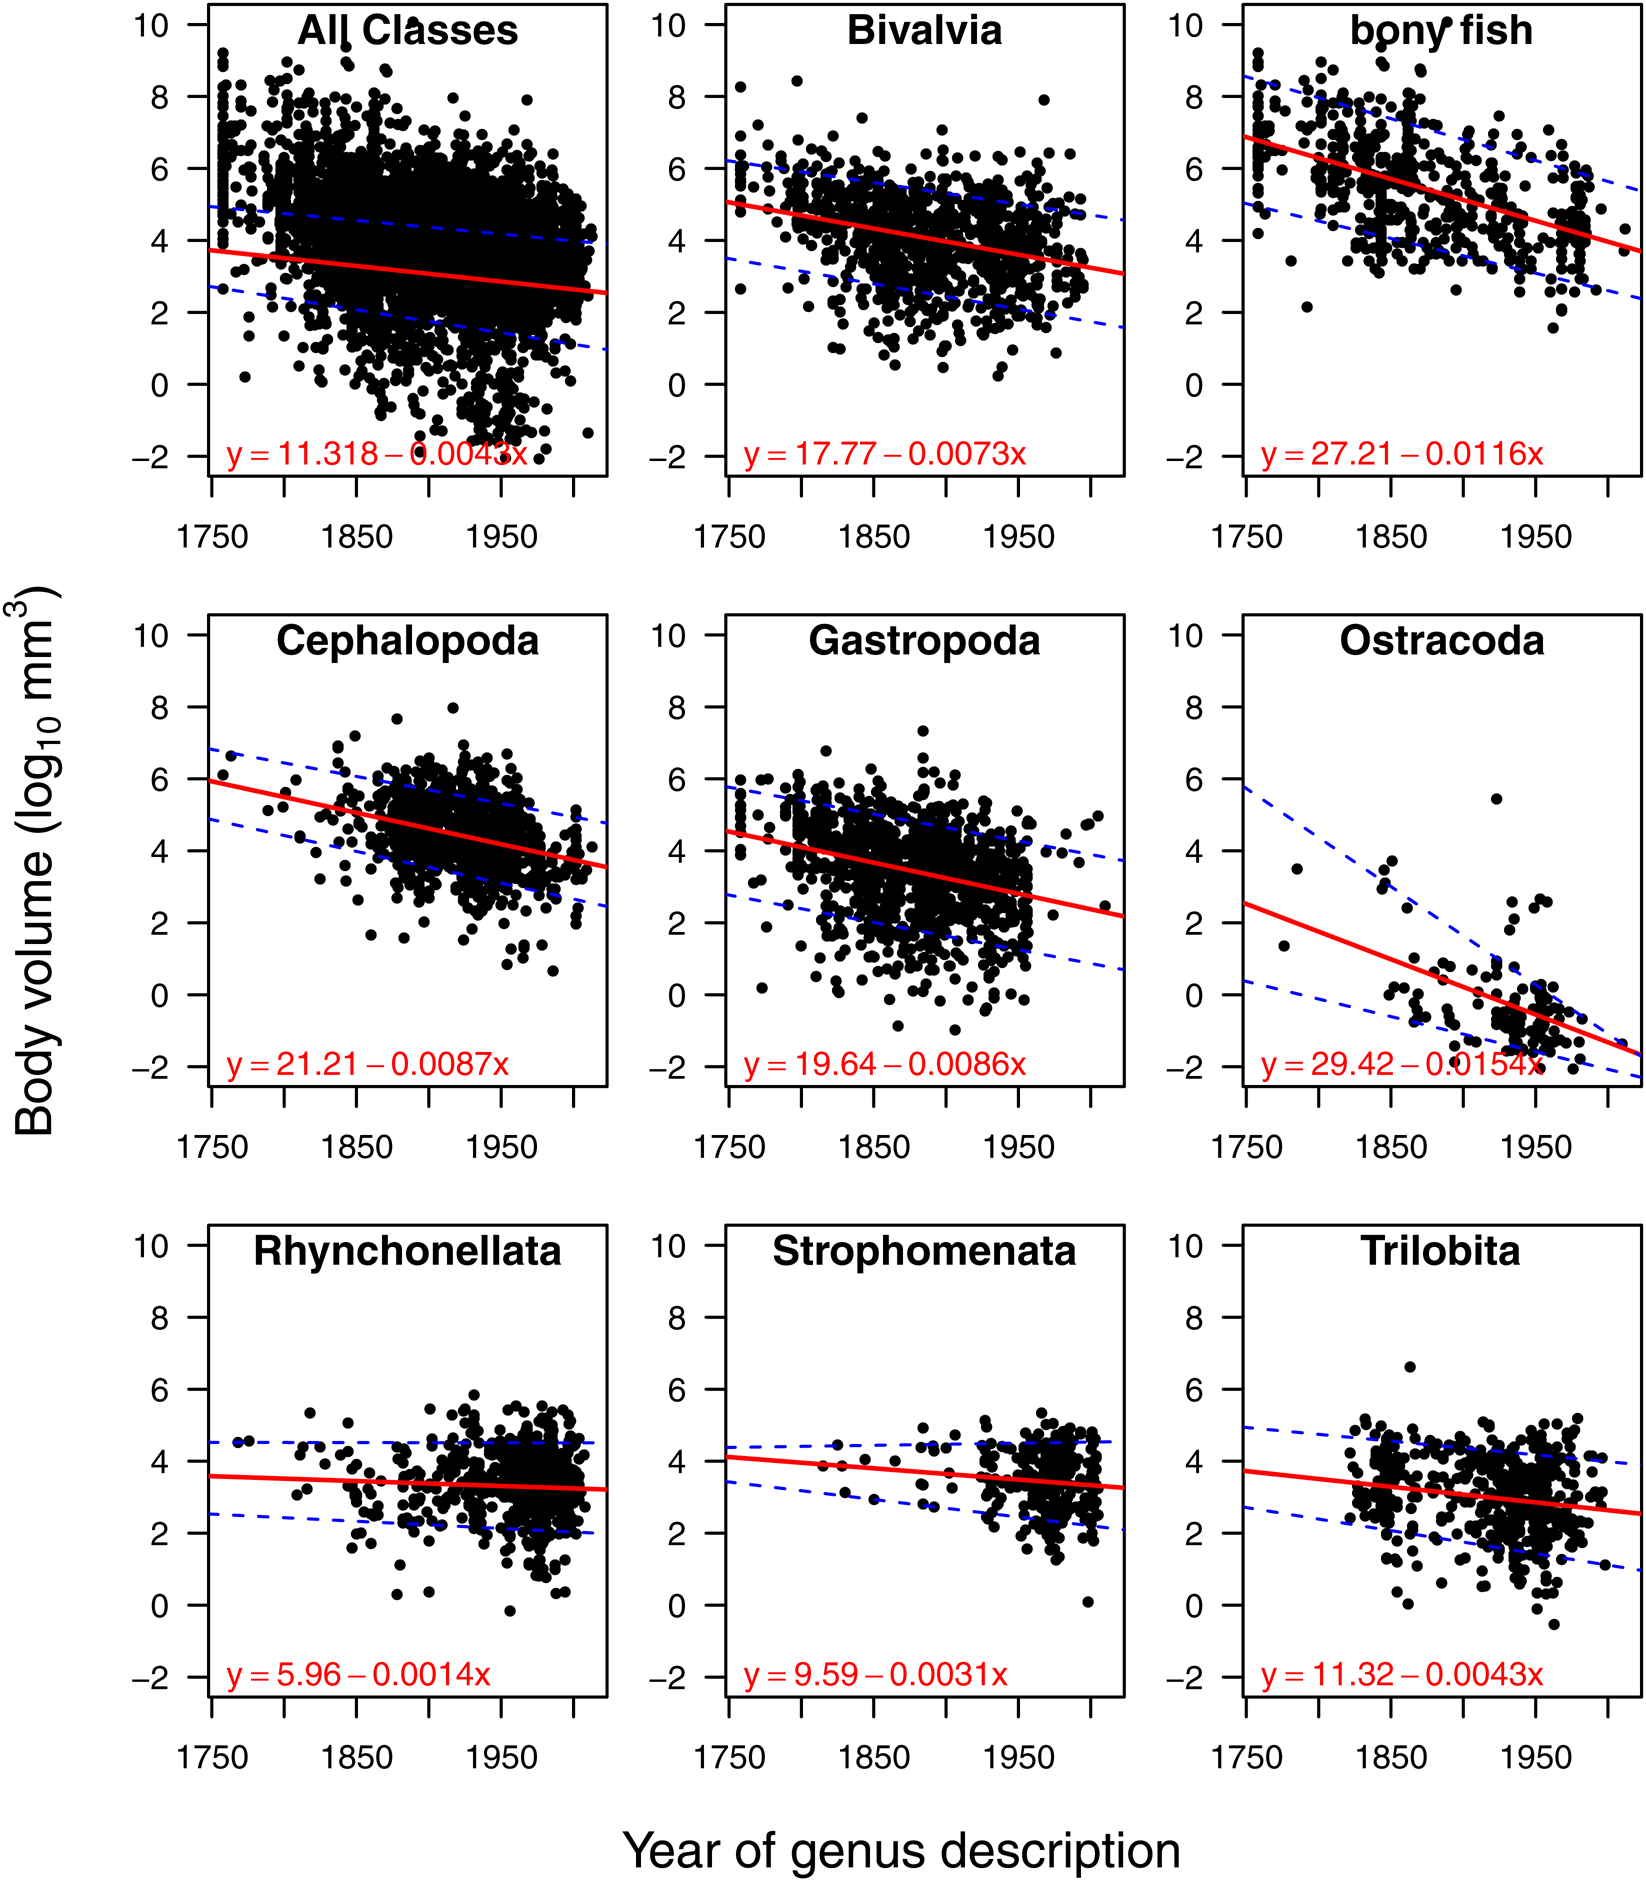
The history of fossil description across human time suggests that paleontologists are generally improving at finding, identifying, and describing smaller taxa, potentially due to improvements in preparation and imaging techniques, as well as interest in finding and describing new taxa. Consistent with a previous analysis of Permian–Triassic gastropod species (Payne Reference Payne2005), the mean sizes as well as the 90th and 10th percentiles of body size for newly described genera show statistically significant decreasing trends toward the present day in seven of the eight studied classes (Fig. 8). The size bias of the fossil record can therefore be reduced, though probably not removed, through additional attention to the smallest fossils within each higher taxon.
Plot of genus size vs. the year in which the genus was first described for all genera and by class, illustrating that the sizes of the largest (90th quantile), mean, and smallest (10th quantile) genera have decreased significantly over time across the data as a whole and within each class. Trends in mean size are statistically significant (p < 0.05) for all genera combined and for all classes other than Rhynchonellata. Trends in mean value are indicated by solid lines and were calculated by ordinary least-squares regression, and trends in the 10th and 90th quantiles are indicated by dashed lines and were calculated by quantile regression using the quantreg package in R (Koenker Reference Koenker2018).

Body Size and Extinction Probability
The fossil record of marine animals provides strong evidence for the preferential extinction of smaller-bodied genera across diverse higher taxa and all three Phanerozoic eras. The bias is present in the raw data and remains after correcting for size-biased incompleteness of the fossil record through CMR analysis. The bias also remains after rescaling body size relative to the order and family mean values, suggesting that it is not a simple product of mixing lower taxonomic groupings with different evolutionary dynamics. It also appears not to be the product of taxonomic practice. Finally, the size bias of extinction also does not appear to be a simple effect of an association between body size and geographic range within classes. However, the bidirectional relationship between survival and geographic range (Foote et al. Reference Foote, Crampton, Beu and Cooper2008) may lead to a situation wherein a simple additive model is not sufficient to assess this potential effect. Other ecological and physiological correlates of body size, such as fecundity, reproductive strategy, or larval ecology, may also contribute to the association between size and extinction but cannot be coded for all genera on the basis of existing data and therefore remain beyond the scope of this study. Consequently, the biological basis for this association, if any, remains unresolved. Several testable explanations remain, including: (1) the analyses conducted herein fail to sufficiently account for the relationship between body size and geographic range, and full correction for the influence of size-biased sampling on apparent geographic range will lead to a finding that the association between size and geographic range fully accounts for the size bias of extinction; (2) despite the evidence from the test of Permian brachiopods, which show less evidence of size bias in extinction than other taxon–era combinations (Figs. 2, 4), taxonomic practice yields a situation in which larger-bodied genera are more taxonomically inclusive and therefore longer surviving than smaller-bodied genera; (3) the scaling of fecundity with body size is positive for many marine animals (e.g., Jablonski Reference Jablonski, Jablonski, Erwin and Lipps1996), in contrast to terrestrial mammals, leading to greater potential for larger-bodied taxa to survive in the face of rapid environmental change; or (4) the scaling of other ecological traits, such as reproductive mode or larval ecology, with body size leads the preferential survival of larger-bodied genera.
The frequent bias of extinction against smaller-bodied genera in the marine fossil record contrasts with evidence from the fossil record of terrestrial mammals, where extinction has either been biased against larger-bodied species (Liow et al. Reference Liow, Fortelius, Bingham, Lintulaakso, Mannila, Flynn and Stenseth2008; Tomiya Reference Tomiya2013) or unbiased (Alroy Reference Alroy and MacPhee1999; Smith et al. Reference Smith, Elliott Smith, Lyons and Payne2018). The difference between the records cannot be explained due to differences in the time intervals being studied, because the marine data provide evidence of size bias even during the Cenozoic. The many differences in the ecology and physiology of marine versus terrestrial animals are, in our view, more probable explanations for this difference in extinction dynamics.
Regardless of the precise underlying process or processes responsible for the preferential extinction of smaller-bodied genera in the fossil record of marine animals, its existence indicates that the preferential threat against larger-bodied species in the modern oceans in several higher taxa (Olden et al. Reference Olden, Hogan and Vander Zanden2007; Payne et al. Reference Payne, Bush, Heim, Knope and McCauley2016; but see Collins et al. Reference Collins, Edie, Hunt, Roy and Jablonski2018) does not represent an acceleration or amplification of the typical evolutionary process. Instead, the current extinction crisis constitutes a reversal of a long-standing evolutionary tendency.
Acknowledgments
All data and code are archived at Dryad (https://doi.org/10.5061/dryad.zpc866t5b). Support for this research was provided by the U.S. National Science Foundation (EAR-1151022 to J.L.P.) and the School of Earth, Energy, and Environmental Sciences at Stanford University. J.L.P. designed the study. J.L.P. and N.A.H. analyzed the data and wrote the article. H. Bucher, S. Finnegan, M. Hautmann, M. Pinsky, and S. C. Wang commented on earlier drafts of the article. We thank the contributors to the Paleobiology Database for making available the occurrence data used in this analysis and numerous high-school interns and research assistants for their assistance in compiling the body-size data. The authors declare no conflicts of interest. This is Paleobiology Database publication no. 357.