Introduction
The development of kaolinization as a result of tectonically controlled hydrothermal alteration of metamorphic units is rare in Anatolia (Kadir and Akbulut Reference Kadir and Akbulut2009; Sayın Reference Sayιn2016). In contrast, kaolinite deposits in Anatolia are formed mostly by hydrothermal alteration of acidic or intermediate volcanic rocks (Seyhan Reference Seyhan1978; Sayın Reference Sayιn2007; Ece and Schroeder Reference Ece and Schroeder2007; Ece et al. Reference Ece, Schroeder, Smilley and Wampler2008; Erkoyun and Kadir Reference Erkoyun and Kadir2011; Kadir et al. Reference Kadir, Erman and Erkoyun2011, Reference Kadir, Külah, Eren, Önalgil and Gürel2014).
The Yarıkçı clay deposit formed along the tectonically controlled hydrothermal alteration of Mesozoic metamorphic units (Fig. 1). The Yarıkçı clay deposit has been mined since the 1990s to provide raw material for the production of tile and glaze. The Yarıkçı clay deposit and the surrounding kaolinite deposits in the Mihalıççık region have 1,000,000 tons of minable (inferred) reserves, and 3,330,380 tons of inferred + probable reserves (8th Five-Year Development Plan – State Planning Organization of Turkey 2001). Smectite and kaolinite in the Yarıkçı clay deposit were formed by hydrothermal alteration of crystal tuff (Fujii et al. Reference Fujii, Kayabak and Saka1995). Ömeroğlu Sayıt et al. (Reference Ömeroğlu Sayιt, Günal Türkmenoğlu, Sayn and Demirci2018) studied the hydrothermal kaolinite deposit within Mesozoic granitic intrusions in the Ahırözü (Mihalıççık) area and reported that the kaolinization had developed under the influence of a low-sulfidation system showing argillization. The Taşoluk (Afyonkarahisar, western Anatolia) kaolinite formed in association with illite in Paleozoic chlorite and sericitic mica schists via a dissolution and precipitation mechanism during a hydrothermal alteration process (Kadir and Akbulut Reference Kadir and Akbulut2009).
Geological map of the study area (modified after Koçak Reference Koçak1975) and locations of the parent rock samples (see Fig. 3 for locations of the altered samples)

Due to the lack of detailed studies of the lithological, mineralogical, micromorphological, and geochemical characteristics, the genesis of the Yarıkçı clay deposit, which consists of smectite associated with kaolinite and illite within Mesozoic metamorphic units, is open to debate. The present study aimed to determine the formation and association of smectite with both kaolinite and illite and their lateral and vertical distributions in the Mihalıççık region. The present study suggested that these clay deposits originated from the hydrothermal alteration of Mesozoic metamorphic units and the physicochemical conditions, which have not been discussed previously. The results of this research will provide information and a useful tool in the study of similar hydrothermal alteration sources of raw materials in western Anatolia.
GEOLOGICAL SETTING AND DESCRIPTION OF CLAY DEPOSIT
The parent rocks of the Yarıkçı clay deposit consist of the Mesozoic Mihalıççık metamorphic units composed of chlorite schist, glaucophane schist, glaucophane-chlorite schist, muscovite schist, chlorite-muscovite schist, and garnet-graphite phyllite (Figs. 1, 2, and 4a,b). This unit represents a transition from greenschist to blueschist facies (Davis and Whitney Reference Davis and Whitney2006; Kadir and Erkoyun Reference Kadir and Erkoyun2015).
Generalized stratigraphic column of the study area (simplified from Kadir et al. Reference Kadir, Eren, $IDrkeç, Erkoyun, Külah, Önalgil and Huggett2017)

The metamorphic units also include quartzite layers and accessory mica minerals (Kulaksız Reference Kulaksιz1981; Yılmaz Reference Yιlmaz1981; Gözler et al. Reference Gözler, Cevher, Ergül and Asutay1996; Akbulut et al. Reference Akbulut, Pişkin and Karayiğit2006) and they are overthrust by an Upper Cretaceous ophiolitic mélange composed of serpentinized ultramafics, peridotite, and radiolarite units (Şengör and Yılmaz Reference Şengör and Yιlmaz1981; Okay Reference Okay1989; Okay et al. Reference Okay, Tansel and Tüysüz2001). Neogene continental clastics, volcanics, volcaniclastics, and lacustrine carbonates overlie these units unconformably (Boyraz Reference Boyraz2004; Karakaş et al. Reference Karakaş, Karakaş and Varol2007; Kadir et al. Reference Kadir, Eren, $IDrkeç, Erkoyun, Külah, Önalgil and Huggett2017). All the aforementioned formations are overlain unconformably by Quaternary alluvium (Fig. 2).
Structural features indicate that the Eskişehir region is affected by major and minor E–W-trending faults that have been under the control of the tectonic influence of the North Anatolian Fault Zone since the Miocene (Şengör et al. Reference Şengör, Görür, Şaroglu, Biddle and Christie-Blick1985). These Cretaceous–Tertiary tectonic activities and E–W-trending Yarıkçı fault zone are associated with sulfur-bearing Yarıkçı hot springs and spa (Seyhan Reference Seyhan1968; Koçak Reference Koçak1975). The faults in this zone are the main reason for the deformation of the metamorphic units and formation of the clay deposits during and following hydrothermal alteration (Seyhan Reference Seyhan1968).
Hydrothermal alteration developed within the metamorphic units along NW–SE-trending main and N–S-trending secondary normal faults (Figs. 3 and 4c–e). Enrichment of smectite, kaolinite, illite, silica, and iron phases caused the development of several mineral associations recognizable by the color of claystone outcrops within the clay deposit (Figs. 3 and 4f). Generally, kaolinite is identified by cream-colored outcrops in the southern part of the deposit. Kaolinite mostly includes silica-filling veins and subvertical fractures, and staining by Fe oxides (Figs. 3 and 4g–i). Kaolinitic claystones are also accompanied by irregular green smectitic units (Fig. 4j). Smectitic claystone is abundant in the deposit and mostly encloses Fe oxide-rich fracture in-fills (Figs. 3 and 4k). Smectitic claystone is accompanied by brownish-red, Fe oxide-rich phases along the fault zones (Figs. 3 and 4l,m). Goethite/hematite-type Fe oxides are mostly associated with kaolinite-bearing smectitic claystones. The gray, plastic, and locally friable claystones composed mainly of illite are the outcrops of the clay deposit (Figs. 3 and 4n). The northwestern part of the clay deposit is overlain by a dark-gray, hard, and sharp-edged silica cap (Figs. 3 and 4o).
Profiles of the Yarıkçı clay deposit

Field view of: a chlorite-muscovite schist; b garnet-graphite phyllite; c Yarıkçı clay deposit and covered/enclosed silica cap and phases along the main fault; d secondary fault in the northern site of the deposit; e main fault and associated silica caps in the northern site of the deposit; f relationship of smectite and kaolinite abundant claystones with silica phase; g–i subvertical Fe oxide and silica veins in the kaolinitic claystone; j relationship of the kaolinite and smectite in claystone; k Fe-oxide veins and stains in smectite-rich claystone; l, m Fe oxides in smectitic claystone; n illitic claystone; o silica cap at the top of the deposit


Materials and Methods
Eight representative, fresh schists and 44 claystone samples were collected based on the lithologies and colors of the Yarıkçı clay deposit and the parent rocks of the metamorphic units located along lateral and vertical variations (Figs. 1 and 3). Thin sections of fresh schist were examined under a Nikon-LV 100Pol (Nikon Corporation, Tokyo, Japan) polarizing microscope. Samples selected to represent various degrees of alteration and related colors were crushed manually and powdered using a tungsten carbide pulveriser for X-ray diffraction (XRD) and geochemical analyses.
The separation of the clay fraction was undertaken following the removal of Fe(III) oxide and/or hydroxide cements by the sodium dithionite-citrate procedure and 30% H2O2 was used to eliminate organic matter (Kunze and Dixon Reference Kunze, Dixon and Klute1986). The treated and dried (<105°C temperature) samples were sieved to <2 mm. 100 g of the <2 mm fraction was mixed with deionized water and disaggregated using a ‘Stir-Pak’ (Cole-Parmer, Vernon Hills, Illinois, USA) mixer head and mixer controller to obtain clay fractions of these samples. The <2 μm fractions were separated from the silt (2–50 μm) by using repeated siphoning of the dispersed material. The clay fraction was separated by sedimentation of the suspension after 24 h of dispersion in distilled water and removal of the upper 5 cm, followed by centrifugation for 10 min at 2451×g (4000 rpm) using a Hettich 32A centrifuge (Andreas Hettich GmbH and Co. KG, Tuttlingen, Germany).
Several oriented mounts were prepared from each clay fraction by dropping a small amount of clay suspension onto a glass slide and drying in air. One oriented mount was solvated using ethylene glycol vapor at 60°C for 2 h to expand and identify clay minerals. Other oriented mounts were heated at 350 and at 550°C for 2 h to assist in differentiating chlorite from kaolinite.
The mineralogical characteristics of the samples were determined using powder XRD (Rigaku D/Max–2200, Ultima PC, Tokyo, Japan). The bulk powders and clay mounts prepared using the method mentioned above were scanned using CuKα radiation (40 kV and 30 mA) with a 1° divergence slit, a 0.15° anti-scatter slit, and a 1° receiving slit. A 0.30 mm monochromator receiving slit and a graphite monochromator were used to filter out all but CuKα radiation. The samples were scanned at a speed of 1°2θ/min. Randomly oriented mounts of powdered samples were scanned to determine the mineralogy. Semi-quantitative abundances of rock-forming minerals were determined using sharp and unambiguous reflection intensities on the XRD patterns (Brindley Reference Brindley, Brindley and Brown1980). The clay mineral relative abundances were determined from basal reflections and the mineral intensity factors of Moore and Reynolds (Reference Moore and Reynolds1989).
Scanning electron microscopy–energy dispersive X-ray analysis (SEM-EDX) studies were performed at Middle East Technical University (Turkey) and Eskişehir Osmangazi University (Turkey) using a QUANTA 400F Field Emission SEM instrument (Thermo Fisher Scientific, Hillsboro, Oregon, USA) and an Hitachi-Regulus 8230 and Oxford instrument ULTRIM EXTREME detector, respectively. The bulk specimens that consisted predominantly of clay were prepared for SEM-EDX analysis by sticking the freshly broken surface of each rock sample onto an aluminum sample holder using double-sided tape. The samples were then coated with a thin film (~3 nm) of gold/palladium using a Polaron range sputter coater (Quorum Technologies Ltd., Ashford, Kent, UK).
Nine representative claystone samples, seven silica-phase samples from the clay deposit, and six metamorphic rock samples from the parent rocks were analyzed for major and trace elements at the Bureau Veritas Mineral Laboratories (Vancouver, Canada) using a Perkin Elmer Elan 9000 (PerkinElmer, Inc., Waltham, Massachusetts, USA) inductively coupled plasma–atomic emission spectrometer (ICP-AES) and mass spectrometer (ICP-MS) and a Spectro (Spectro Analytical Instruments Inc., Mahwah, New Jersey, USA) XLAB-2000 PEDX-ray fluorescence spectrometer (PEDXRF), which was calibrated using USGS interlaboratory standards. The ICP-AES and ICP-MS analyses were carried out on lithium metaborate/tetraborate fused samples after dissolution in dilute nitric acid. Loss on ignition (LOI) values were determined from the mass differences before and after ignition at 1000°C. Total Fe was reported as Fe2O3 and total C was determined by ignition followed by measurement using an infrared spectrometric cell in a LECO Carbon Analyzer (LECO Corporation, St. Joseph, Michigan, USA); the latter analyses were carried out at the Bureau Veritas, Vancouver, Canada.
The detection limits for the chemical analyses were 0.01 wt.% for most major element oxides, but were 0.002 wt.% for Cr2O3, 0.04 wt.% for Fe2O3, 0.02 wt.% for total C and total S, 0.1 wt.% for LOI, and between 0.01 and 1 mg/kg for almost all trace elements. Samples were analyzed in duplicate and the accuracy and analytical precision of the major element measurements were assessed by analyzing the standard reference materials STD SO-18, STD SO-19, STD GS311-1, and STD GS910-4 for major elements and by analyzing the standard reference materials STD SO-18, STD SO-19, STD DS10, and STD OREAS45EA for trace elements.
The degree of chemical index of weathering (CIW) of claystone, silica phase, and metamorphic parent whole-rock samples was calculated using the following equation (Harnois Reference Harnois1988):


Fresh metamorphic rock samples composed of chlorite schist, muscovite schist, chlorite-muscovite schist, and garnet-graphite phyllite representing the parent rocks of the clay deposit and claystone samples were used for mass gain and loss calculation. Mass gains and losses have been calculated and estimated by using the EASYGRESGRANT program (Eq. 1) (López-Moro Reference López-Moro2012) and from plots of the geochemical analyses on isocon diagrams (Grant Reference Grant1986, Reference Grant2005).

where C i is the concentration of component i, O indicates the fresh rock, and A indicates the altered rock. The M O and M A values are the masses (as wt.% for major oxide or ppm for trace and rare earth elements) of the fresh and altered rocks, respectively.
The C i A/C i O ratios were plotted to obtain the slopes of the isocon graphic lines from the fresh and the altered rock analytical data using Eq. 2.

where ∆C i is the gain or loss of mass. Based on clusters of slopes, components with slope values close to 1.00 were assumed to be immobile.
Finally, the mass change of a component is calculated by applying Eq. 3.

The sample compositions that plot above the isocon line indicate a gain during the alteration process and samples that plot below this line represent a loss during alteration.
Results
Petrography
The parent rocks of the Yarıkçı clay deposit are represented by lepidoblastic and cataclastic chlorite schist, chlorite-muscovite schist, muscovite schist, and blastoporphyritic garnet-graphite phyllite, which is composed of chlorite, muscovite, sericite, graphite, garnet, quartz, and calcite, and accessory pyroxene (Figs. 4a,b and 5). Fe-(oxyhydr)oxides developed along the foliation of the schist (Fig. 5a,b). The partially or completely altered muscovite and degraded quartz crystals exhibit cataclastic character such as bending and disaggregation, and plagioclase (albite) and K-feldspar are mostly argillized and sericitized (Fig. 5a–f). Carbonitization is widespread in chlorite-muscovite schist samples (Fig. 5c). Accessory garnet and abundant graphite, quartz, and sericite occur in garnet-graphite phyllite (Fig. 5g,h).
Photomicrographs of: a–b chlorite cementing muscovite, feldspar, and quartz crystals; plain-polarized light (YR-52); c calcite crystal associated with muscovite, quartz, and chlorite crystal; plain-polarized light (YR-46); d muscovite associated with quartz showing cataclastic texture; crossed nicols light (YR-51); e, f subparallel muscovite crystal with Fe oxide in muscovite schist; plain-polarized light (YR-51); g euhedral coarse-grained garnet surrounded by graphite in sericite schist; plain-polarized light (YR-50); and h subparallel orientation of graphite with sericite enclosing quartz crystal; plain-polarized light (YR-50)

XRD determinations
The XRD analyses of the bulk samples and clay-mineral fractions collected from the Yarıkçı clay deposit are given in Table 1 and Fig. 6. The mineralogical composition shows a heterogeneous distribution. Kaolinite was determined by diagnostic sharp basal reflections at 7.14–7.17 Å and 3.57–3.58 Å, and non-basal less intense reflections of triplets and doublets at 4.46–4.47, 4.34–4.37, 4.18–4.19; 2.56–5.57, 2.52–2.49, 2.34, and 2.29 Å, showing clearly a highly crystallized kaolinite (Brindley Reference Brindley, Brindley and Brown1980; Wilson Reference Wilson1987) (Fig. 6). The spacing of the basal reflection of kaolinite was not affected by ethylene-glycol saturation, but its intensity decreased and then collapsed due to dehydroxylation following heating at 350°C and 550°C (for 2 h), respectively (Fig. 6, YR-21). Smectite was determined by narrow, sharp basal reflections at 14.10–15.01 Å and the spacing of the basal reflection of smectite in sample YR-9 was expanded to 17.14 Å with ethylene-glycol treatment and progressively decreased to 10.04 and 9.81 Å following heating at 350°C and 550°C for 2 h, respectively (Fig. 6). The d 060 value of 1.49 Å indicates dioctahedral smectite (Moore and Reynolds Reference Moore and Reynolds1989). Illite was also determined by basal reflections of 10.00–9.99 Å and 5.00–4.99 Å that were not affected by ethylene-glycol treatment and heating at 350°C and 550°C (Fig. 6, YR-28). Chlorite in the parent schist rock (samples YR-34, YR-44, YR-48, and YR-52) was determined by sharp diagnostic reflections at 14.17–14.10, 7.07, and 3.54 Å. The basal reflection of chlorite at 14.17 Å was not affected by ethylene-glycol treatment. The intensity of this peak was unchanged at 350°C but slightly reduced at 550°C (Fig. 6, YR-44). Cristobalite, tridymite, and a small amount of quartz are present in altered units and with more present in the silica cap and fracture/fault infill and determined by reflections at 4.05 Å, 4.11 Å, and 3.34, 4.26 Å, respectively (Fig. 6, YR-13 and YR-20).
Mineralogical variations in the Yarıkçı clay deposit

Sme: smectite; Kln: kaolinite; Ilt/Ms: illite/muscovite; Chl: chlorite; Gth/Hem: goethite/hematite; Jrs: jarosite; Crs/Trd: cristobalite/tridymite; Qz: quartz; Fsp: feldspar; Px: pyroxene; acc: accessory; +: relative abundance of mineral (mineral-name abbreviations after Whitney and Evans Reference Whitney and Evans2010)
XRD patterns for clayey material samples from Yarıkçı clay deposit. Sme: smectite; Kln: kaolinite; Ilt/Ms: illite/muscovite; Ilt: illite; Ms: muscovite; Chl: chlorite; Crs/Trd: cristobalite/tridymite; Qz: quartz; Fsp: feldspar; Px: pyroxene (mineral-name abbreviations after Whitney and Evans Reference Whitney and Evans2010)


Kaolinite is abundant in the cream-colored claystone. Smectite and smectite associated with small amounts of kaolinite is abundant in the irregular-form green and brownish-red claystone units which are prevalent in the deposit. Smectite is associated mostly with cristobalite/tridymite in kaolinite and rarely in smectite-abundant claystone. Generally, kaolinite shows positive correlation with goethite/hematite in the claystones. Illite is abundant in the gray claystone at the margin of the deposit and is associated with small amounts of smectite, kaolinite, and quartz. Parent rocks of the claystones are composed mainly of chlorite associated with illite/muscovite, quartz, and accessory kaolinite, feldspar, and pyroxene (Table 1).
SEM-EDX determinations
Observations by SEM indicate that irregular kaolinite plates developed on or bordered altered, book-like muscovite crystals (Fig. 7a,b). The EDX spectra of muscovite plates show strong peaks for Si, Al, and K (Fig. 8a). Kaolinite in claystone occurs in a condensed, irregular platy form and is occasionally found in hexagonal form (Fig. 7c). The EDX spectra of kaolinite plates show strong peaks of Si and Al (Fig. 8b) along with local kaolinite exhibiting sub-rounded book-like morphologies (Fig. 7d). Chlorite shows irregular plates and rosette patterns (Fig. 7e). The EDX spectra of chlorite have signals of Si, Al, Mg, Fe, and weakly of K (Fig. 8c). Smectite in claystone exhibits a flaky form (Fig. 7f). Flaky smectite is characterized by strong EDX spectra and signals of Si, Al, Mg, and of poor Fe and Na (Fig. 8d).
SEM images of: a, b muscovite-book flakes edged by platy kaolinite (YR-24); c irregular platy kaolinite locally showing hexagonal outlines (YR-24); d kaolinite exhibiting sub-rounded book-like structure (YR-1); e chlorite platelets (YR-44); f flaky smectite (YR-1); g sub-rounded disc-shaped hematite and rod-like goethite in pore of kaolinitic materials (YR-28); h enlarged view of g; i rod- and, locally, star-like goethite formed as a thin film on the surface of opaline (YR-25); j, k enlarged view of i; l subhedral jarosite crystals with altered materials (YR-28); m,n condensed, irregular, rod-shaped structures making up gypsum/anhydrite (YR-26)


EDX analyses of: a muscovite; b kaolinite; c chlorite; d smectite; e goethite/hematite; f silica; g gypsum/anhydrite

Kaolinite and smectite are also associated with abundant sub-rounded disc-shaped forms resembling hematite, as determined by the strong Fe peak associated with faint Si, Al, and S spectra which originated from the surrounding kaolinite and accessory jarosite crystals (Figs. 7g–k and 8e). Rod- and locally star-like goethite also formed as a thin film on the surface of siliceous materials yielding a strong Si peak, which is diagnostic of opaline (Figs. 7i–k and 8f).
Subhedral jarosite also coexists with clayey materials (Fig. 7l). Gypsum/anhydrite occurs as condensed, irregular, rod-shaped structures that are identified by the strong S and Ca peaks, associated with poor Al and Si peaks, possibly belonging to the surrounding kaolinite (Figs. 7m,n and 8g).
Geochemistry
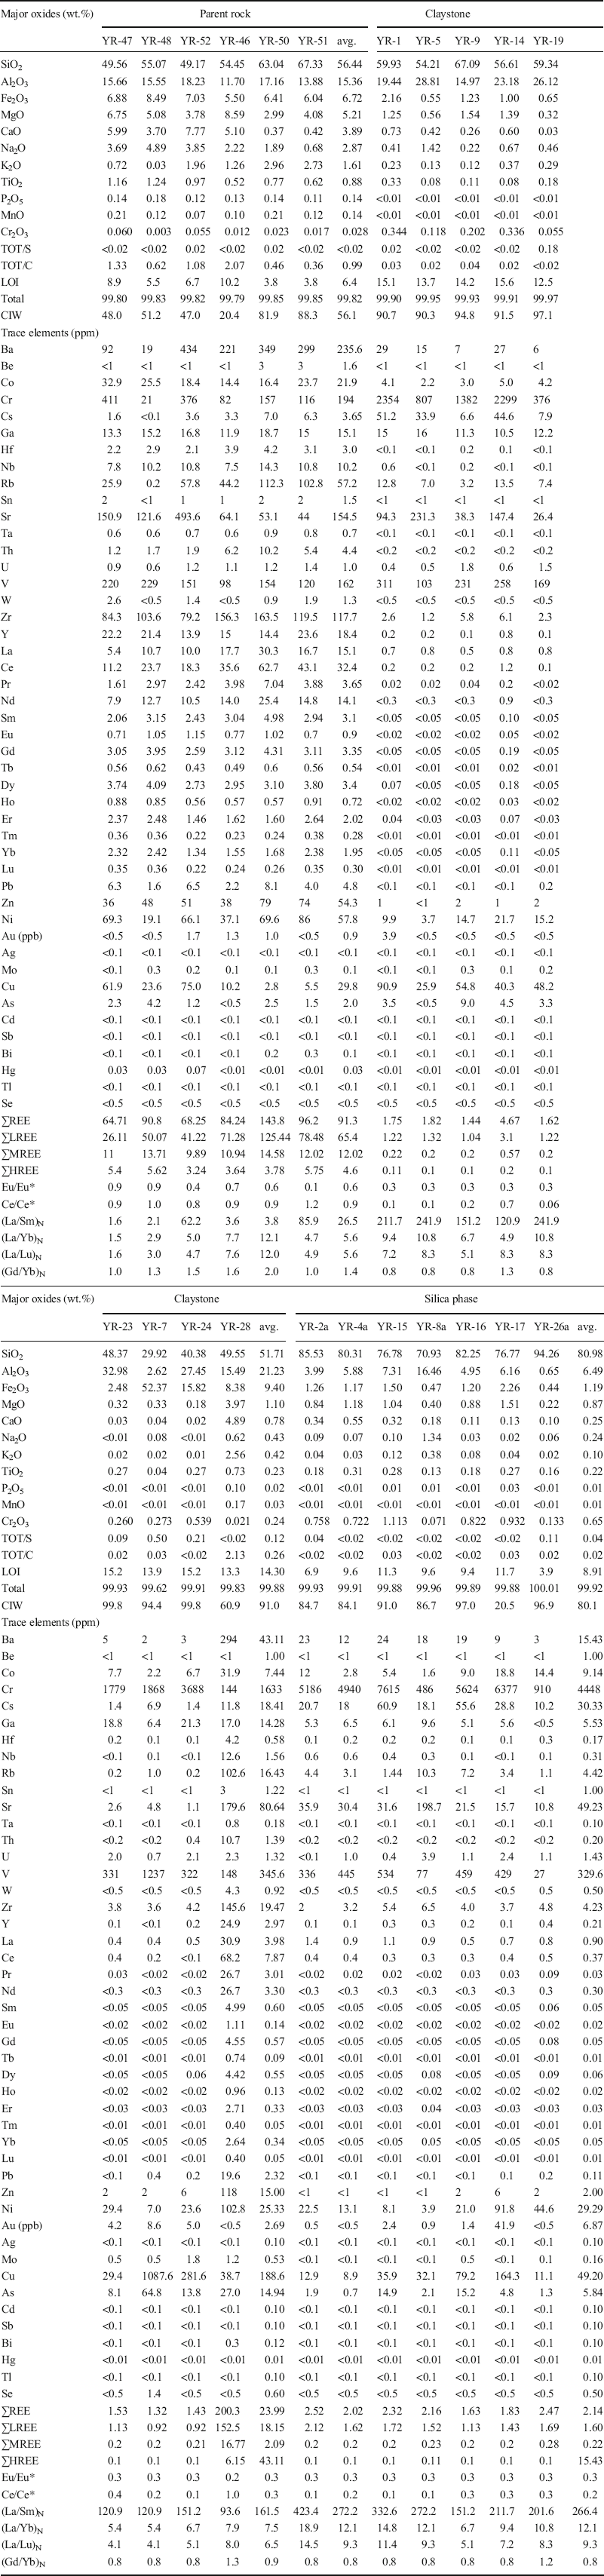
Chemical analyses (Table 2) revealed that the parent rock and claystone samples are characterized by SiO2 (avg. 56.44 and 51.71 wt.%, respectively), Al2O3 (avg. 15.36 and 21.23 wt.%, respectively), Fe2O3 (avg. 6.72 and 9.40 wt.%, respectively), MgO (avg. 5.21 and 1.10 wt.%, respectively), TiO2 (avg. 0.88 and 0.23 wt.%, respectively), K2O (avg. 1.61 and 0.42 wt.%, respectively), and LOI (avg. 6.4 and 14.30 wt.%, respectively). Thus, the claystone samples show increase of Al2O3, Fe2O3, and LOI, and decrease in SiO2, MgO, and K2O compared to the parent rocks. The large amounts of Al2O3 + LOI and Fe2O3 ± TOT/S in claystone units exhibit the presence of kaolinite and smectite. On the other hand, the large Al2O3, Fe2O3, and K2O values in the parent schist rocks reflect the presence of muscovite, chlorite, feldspar, and Fe oxides associated with accessory kaolinite and smectite.
Major oxide (wt.%), minor element, and trace element (ppm) contents of the parent rocks, claystone, and silica samples in the study area (see Table 1 for the mineralogical compositions of the samples)

ƩREE = the sum of (La–Lu)+Y; ƩLREE = the sum of La–Nd; ƩMREE = the sum of (Sm–Ho); ƩHREE = the sum of (Er–Lu); Eu/Eu* = EuN/[(SmNx0.67)+(TbNx0.33)] (Bau and Dulski Reference Bau and Dulski1996) and Ce/Ce* = 3CeN/(2LaN+NdN) (Mongelli Reference Mongelli1997). N refers to a chondrite-normalized value (Taylor and McLennan Reference Taylor and McLennan1985). LOI: loss on ignition at 1050°C
The CIW values of the parent rocks, claystones, and silica phases are, on average, 56, 91, and 80, respectively (Table 2). SiO2 is enhanced up to a maximum of 94.26 wt.% and Au to a maximum of 41.9 ppb in the silica-rich phase, whereas Sr (maximum 231.3 ppm), Cr (maximum 3688 ppm), and Cu (maximum 1087.6 ppm) are significant in claystones. Rb (maximum of 102.6 ppm), Ba (maximum of 294 ppm), Zr (maximum of 145.6 ppm), and Ni (maximum of 102.8 ppm) are at enriched levels in the illitic claystone. In addition, the parent rocks exhibit enhanced amounts of Sr (maximum of 493.6 ppm), Zr (maximum of 163.5 ppm), and Ni (maximum of 86 ppm).
The whole-rock REE contents of both parent-rock samples and related claystone samples were normalized to chondrite (Table 2; Fig. 9). The LREE values display slight enrichment [avg. (La/Sm)N = 26.5–266.4, avg. (La/Yb)N = 5.6–12.1, and (La/Lu)N = 5.6–9.3] relative to MREE+HREE [avg. (Gd/Yb) = 0.8–1.4] and distinct and negative values for both Eu (avg. Eu/Eu* = 0.6–0.3) and Ce (avg. Ce/Ce* = 0.9–0.3) anomalies (Table 2; Fig. 9).
Chondrite-normalized (Taylor and McLennan Reference Taylor and McLennan1985) REE spider diagrams for the metamorphic and related altered materials from the Yarıkçı deposit

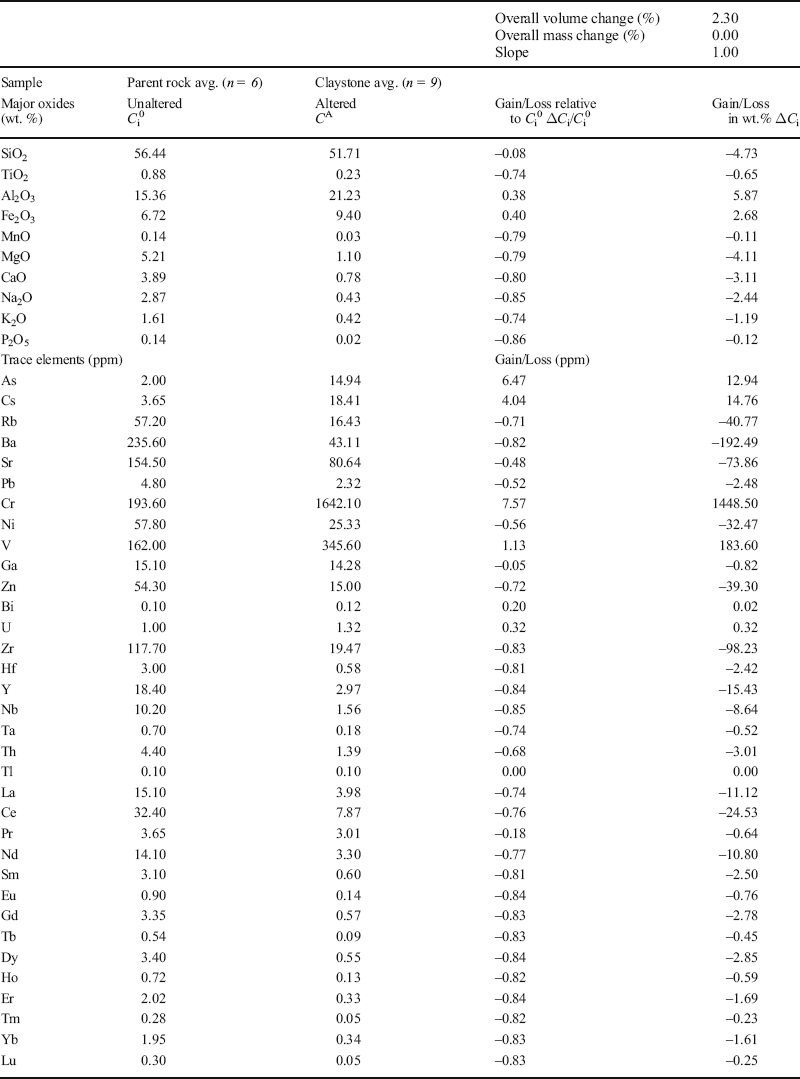
The mass gains and losses were based on calculated delta (ΔC İ) and the plots of the geochemical analyses on isocon diagrams (Grant Reference Grant1986, Reference Grant2005) show that MgO, CaO, Na2O, K2O, SiO2, TiO2, MnO, Sr, Ba, Rb, Nb, Th, Hf, Y, Ni, and Zr were depleted, while Al2O3, Fe2O3, As, Cs, V, U, and Cr were enriched during the hydrothermal alteration process based on isocon slope (m = 1) (Table 3; Fig. 10a–c). Tl shows immobile character. Zr/Ni shows positive correlation with Zr/Co (r2 = 0.5492) (Fig. 11).
Mass gains and losses of major oxides (g) and trace elements (ppm) for the claystone based on the isocon analysis diagram (Grant Reference Grant1986, Reference Grant2005; López-Moro Reference López-Moro2012)

n: number of samples
Mass changes a–c in the major element (g) and trace element (ppm) contents within the study area based on the isocon analysis diagram (Grant Reference Grant1986, Reference Grant2005; López-Moro Reference López-Moro2012)

Elemental variation diagram for Zr/Ni vs. Zr/Co of the Yarıkçı clay deposit samples

Discussion
Alteration developed as a result of NW–SE- and N–S-trending, structurally controlled hydrothermal activity in the Mesozoic chlorite schist, muscovite schist, chlorite-muscovite schist, and basement units comprising garnet-graphite, phyllite-type, greenschist facies (Fig. 12). The vertical mineralogical zonation in the clay deposit from bottom to top are characterized by illite, kaolinite, kaolinite-bearing smectite, smectite, and silica cap (Figs. 3, 4, and 12). The increase in CIW values in the claystone (avg. 91) and silica phase (avg. 80) samples compared to the schist-type parent rock samples indicate the occurrence of intense alteration processes. Development of the Fe oxide and silica-phase vein infills, stockwork and networks within the clay deposit hosted by schists reveal that smectitization, kaolinization, and silicification occurred under the control of hydrothermal fluid activities (Fig. 12; Nagasawa Reference Nagasawa, Sudo and Shimoda1978; Meunier Reference Meunier and Velde1995, Reference Meunier2005; Boulais et al. Reference Boulais, Valley, Choux, Fourcade and Martineau2000). The occurrence of abundant Fe oxides and cristobalite/tridymite/quartz vein infills, stockworks, and heterogeneous, widely found, cream-, green-, brownish-red-, and gray-colored claystones are related to the presence of goethite/hematite as well as kaolinite, kaolinite-bearing smectite, smectite, and illite contents which also support the assumption of hydrothermal alteration processes related to the Yarıkçı fault zone (Fig. 12; Velde Reference Velde1985; Meunier Reference Meunier2005). This process was also shown by the contemporary occurrence of the sulfur-bearing Yarıkçı hot springs and spa (temperature of 39°C) situated ~5 km SE of the deposit (Fig. 12). Ömeroğlu Sayıt et al. (Reference Ömeroğlu Sayιt, Günal Türkmenoğlu, Sayn and Demirci2018) also reported that the kaolinite deposit in granitic units of the Ahırözü (Mihalıççık) formed under temperature ranges from 157 to 341°C based on analysis of fluid inclusions in quartz crystals.
Sketch of genetic model for the Yarıkçı clay deposit

Texturally, the development of cataclastic texture such as bending, disaggregation of the quartz crystals, sericitization and argillization of the feldspars, and partial alteration of muscovite and chlorite in muscovite schists, as well as the presence of Fe-(oxyhydr)oxides along the foliation of the schists also reveal the influence of tectonic activities and related alteration of the parent rocks (Fig. 5; Aliyari et al. Reference Aliyari, Rastad, Goldfarb and Sharif2014; Sayın Reference Sayιn2016; Taillefer et al. Reference Taillefer, Soliva, Guillou-Frottier, Le Goff, Martin and Seranne2017). The lack of Paleocene–Oligocene sedimentary deposits in the study area may suggest that the region was subjected to uplift and fluctuation of the wet-to-dry climatic conditions of the mid- to late-Pleistocene possibly causing the occurrence of chemical weathering similar to that reported by Yılmaz et al. (Reference Yιlmaz, Genc, Gürer, Bozcu, Yιlmaz, Karacιk, Altunkaynak, Elmas, Bozkurt, Winchester and Piper2000), Külah et al. (Reference Külah, Kadir, Gürel, Eren and Önalgil2014), and Kadir et al. (Reference Kadir, Aydoğan, Elitok and Helvacι2015). However, in this context, progressive tectonism was also responsible for initiating the fault-related hydrothermal alteration process since the Miocene (Şengör et al. Reference Şengör, Görür, Şaroglu, Biddle and Christie-Blick1985). The development of (1) hematite/goethite on kaolinite plates and as films on siliceous material determined by XRD and SEM-EDX analysis and (2) yellow- and brown-colored goethite-bearing claystones and hematite filling subvertical fractures/veins in the upper part of the clay deposit may suggest the influence of Fe during/following the alteration and silicification under both hydrothermal and pedogenic processes. Chen et al. (Reference Chen, Barcellos, Richter, Schroeder and Thompson2018) also reported that the concentration of goethite in the upper part and increased concentration of hematite with depth in the soil profile was indicative of a pedogenic process. Eren and Kadir (Reference Eren and Kadir2013) and Eren et al. (Reference Eren, Kadir, Kapur, Huggett and Zucca2015) also stated that the different red coloration in claystone, sandstone, and soil reflect the fluctuation of reducing and oxidizing conditions in the depositional environment. Craw et al. (Reference Craw, Upton and Mackenzie2009) and Taillefer et al. (Reference Taillefer, Soliva, Guillou-Frottier, Le Goff, Martin and Seranne2017) also emphasized that flushing of the hydrothermal fluid flow benefits fracturing along the foliation and consequently favored deformation and decreases of the grain sizes of the unit under control of the tectonic stress. The association of chlorite with smectite in chlorite schist may indicate the transformation of chlorite to smectite along the faults similar to those reported for the metamorphic units in the Black Mountains, California (Haines and van der Pluijm Reference Haines and van der Pluijm2012). Micromorphologically, the linkage of muscovite with book-like kaolinite may suggest that the alteration of muscovite probably caused the in situ precipitation of kaolinite as a result of dissolution-precipitation under acidic conditions (Exley Reference Exley1976; Keller Reference Keller1976).
The depletion of MgO, CaO, Na2O, K2O, SiO2, TiO2, MnO, Sr, Ba, Rb, Nb, Th, Hf, Y, Ni, and Zr and the enrichment of Al2O3, Fe2O3, As, Cs, V, U, and Cr during the hydrothermal alteration process of muscovite, chlorite, feldspar, and pyroxenes of the schists have probably caused the downward deposition of the moderately mobile to immobile Al±Fe favoring the precipitation of kaolinite under open acidic environmental conditions (Fig. 12; Parry et al. Reference Parry, Ballantyne and Jacobs1984; Gürsu et al. Reference Gürsu, Göncüoglu and Bayhan2004). In contrast, the increase of Al, Fe, Mg, and alkalis in the upward sequence along the faults favored the formation of smectite under a confined basic hydraulic system (Fig. 12). This can also be explained by the volume of the fluid fluxes. In this context, large fluid fluxes kept the system acidic (pH < 4) and in turn removed reaction products. In contrast, slow fluxes favor reaction products to build and consume acidity and H+ ions (high pH) in an upward sequence and outwards of the deposit (Inoue Reference Inoue and Velde1995; Santamarina et al. Reference Santamarina, Klein, Palomino, Guimaraes, Maio, Hueckel and Loret2002; Yalçın and Bozkaya Reference Yalçιn and Bozkaya2003).
The injection of hydrothermal fluids resulted in acidic (pH 3–3.5) conditions and in turn the formation of Fe (oxyhydr)oxides such as goethite and hematite (Schwertmann Reference Schwertmann, Bigham and Ciolkosz1993; Kämpf et al. Reference Kämpf, Scheinost, Schulze and Sumner2000) filling fractures/veins. The Fe originated from decomposition of pyroxene in the schist rocks. This process was also associated with a silica phase along the tectonically controlled shear zone (MacLean and Barrett Reference MacLean and Barrett1993; Barrett and MacLean Reference Barrett, MacLean and Lentz1994, Reference Barrett and MacLean1999; Gifkins et al. Reference Gifkins, Herrmann and Large2005).
Hydrolysis and the resulting release of excess Si during the alteration processes probably caused the formation of cristobalite/tridymite and quartz (Erhenberg Reference Erhenberg1991; Meunier and Velde Reference Meunier and Velde2004). The development of silicification such as cristobalite/tridymite/quartz veins/stockworks and silica cap and the local enhancement of SiO2 (maximum 94.26 wt.%), Fe2O3 (maximum 52.37 wt.%), TOT/S (maximum 0.5 wt.%), Cu (maximum 1087.6 ppm), and Au (maximum 41.9 ppb) also supported the assumption of the occurrence of a hydrothermal process (Kadir and Akbulut Reference Kadir and Akbulut2009; Acarlioğlu et al. Reference Acarlioğlu, Kadir, Abdioğlu and Arslan2013).
The large amounts of Sr (maximum 493.6 ppm), Rb (maximum 102.6 ppm), Ba (maximum 294 ppm), and Zr (maximum 145.6 ppm) were attributed to a metamorphic origin, whereas Cr (maximum 7615 ppm), Ni (maximum 102.8 ppm), and V (maximum 1237 ppm) exhibit ophiolitic contributions and low elemental mobility during the alteration process (Dill et al. Reference Dill, Bosse, Henning, Fricke and Ahrendt1997; Vidal Reference Vidal1998). High values of Cr in both claystones and silica phase relative to fresh metamorphic units indicate that the ophiolitic units which cropped out in the north may have contributed to the alteration of chlorite to kaolinite in the metamorphic basement units. The mass losses of Sr (in relation to Ca), Rb, and Ba (in relation to K) were due to the alteration of K-bearing minerals such as K-feldspar and muscovite in schist units similar to what was reported for quartz-sericite schists in the Nondweni Greenstone belt (South Africa) by Jele (Reference Jele2013). The positive correlation between Zr/Co and Zr/Ni reflect the fractionation of muscovite, garnet, plagioclase, and K-feldspars rather than pyroxene in the schists (Fraser et al. Reference Fraser, Ellis and Eggins1997; Degeling et al. Reference Degeling, Eggins and Ellis2001; Bea et al. Reference Bea, Montero and Ortega2006; Aydınçakır and Şen Reference Aydnçakιr and Şen2013; Ghanem and Jarrar Reference Ghanem and Jarrar2013; Wang et al. Reference Wang, Tang, Xu and Wang2015).
The slight enrichment in LREE relative to MREE+HREE and negative Eu anomaly may suggest the fractionation of feldspar under the influence of the hydrothermal alteration (McFarlane et al. Reference McFarlane, Mavrogenes and Tomkins2007; Lee et al. Reference Lee, Dilles, Mazdab and Wooden2009; Aliyari et al. Reference Aliyari, Rastad, Goldfarb and Sharif2014; Sayın Reference Sayιn2016; Maulana et al. Reference Maulana, Christy, Ellis and Bröcker2019).
The negative Eu anomaly indicates that although Eu2+ is stable in the high hydrothermal fluid system, it is more mobile and rapidly oxidized to Eu3+ in the greenschist facies under possibly low hydrothermal temperatures and oxidizing conditions (Sverjensky Reference Sverjensky1982; Spry et al. Reference Spry, Adriana, Messerly and Houk2007; Serna Reference Serna2014). The negative Ce anomaly may be related to the leaching of Ce at low temperatures (Hellman et al. Reference Hellman, Smith and Henderson1979) and to changing oxidation conditions at shallow depth over the redox boundary (Neal and Taylor Reference Neal and Taylor1989; Planavsky et al. Reference Planavsky, Rouxel, Bekker, Shapiro, Fralick and Knudsen2009) and the substitution of Ce by Fe in both goethite and hematite under oxidation and reduction environmental conditions (Fulignati et al. Reference Fulignati, Gioncada and Sbrana1999; Planavsky et al. Reference Planavsky, Rouxel, Bekker, Shapiro, Fralick and Knudsen2009; Zhou et al. Reference Zhou, Zhang, Li, You, Wu and Zheng2013; Külah et al. Reference Külah, Kadir, Gürel, Eren and Önalgil2014).
The local increase of S phases and associated Ca and K+Fe favored the formation of gypsum/anhydrite and jarosite in the clay deposit (Mutlu et al. Reference Mutlu, Sariz and Kadir2006; Ece and Schroeder Reference Ece and Schroeder2007; Sayın Reference Sayιn2007; Ece et al. Reference Ece, Schroeder, Smilley and Wampler2008). The gypsum/anhydrite and jarosite were formed possibly as a result of the alteration of pyrite within a sulfide-sulfate reducing environment (Lerouge et al. Reference Lerouge, Kunov, Fléhoc, Georgieva, Hikov, Lescuyer, Petrunov and Veliova2006; Georgieva and Velinova Reference Georgieva and Velinova2012; Kadir and Erkoyun Reference Kadir and Erkoyun2012; Sayın Reference Sayιn2016). The association of kaolinite with accessory jarosite is possibly related to the environment created by the acidic hydrothermal solutions (pH: 4–5) near the Yarıkçı spring/spa similar to those reported for Puna, Argentina, Sb epithermal veins (Dutrizac and Jambor Reference Dutrizac and Jambor2000), the hydrothermal alteration in the volcanogenic massive sulfide deposit of the Black Sea region (Çelik Karakaya et al. Reference Çelik Karakaya, Karakaya, Küpeli and Yavuz2012), and the hydrothermal mineral deposits of Yellowstone National Park (Bhattacharya et al. Reference Bhattacharya, Mitra, Gupta, Jain, Chauhan, Parthasarathy and Ajai2016). The large REE (La+Ce) values of the hydrothermal alteration systems of the Yarıkçı clay deposit depend on pH (≤2) and associated oxidized Fe and S phases (jarosite and goethite, etc.); in contrast, smaller REE (La+Ce) values occur in neutral-alkaline (pH ≥ 5.5) systems similar to that in the Uzon-Geyzernaya hydrothermal spring system, in Kamchatka, Russia (Karpov et al. Reference Karpov, Schroeder and Nikolaeva2018).
Conclusions
Field observations and mineralogical and geochemical determinations revealed that the Yarıkçı clay deposit developed by hydrothermal alteration of Mesozoic chlorite-, muscovite-, chlorite-muscovite-schist, and garnet-graphite phyllite-type parent rocks along NW–SE- and N–S-trending faults. The alteration of the parent rocks resulted in mineralogical zonation with an abundance of kaolinite in the lower part of the deposit, and smectite+kaolinite together with smectite dominating in the upper part of the deposit, and covered by a silica cap. The occurrence of Fe (oxyhydr)oxides and cristobalite/tridymite/quartz filling subvertical fractures, veins, and stockworks within the clay deposit around the faults is also an important clue to hydrothermal alteration. The occurrence of book-like kaolinite at the edge of book-like muscovite crystals revealed that alteration of muscovite within schists which show cataclastic texture favored the formation of authigenic kaolinite based on a dissolution-precipitation mechanism under acidic conditions. The association of kaolinite with star- and disc-shaped goethite and hematite, and gypsum crystals is related to acidic hydrothermal conditions. Because of the following factors:
(1) small amounts of Sr, Rb, Ba, and Zr in claystone samples (kaolinite + smectite + cristobalite/tridymite + goethite/hematite) compared with those of metamorphic host units (muscovite + chlorite + feldspar);
(2) positive correlation between Zr/Co and Zr/Ni;
(3) local enrichment of SiO2, Fe2O3, S, Cu, and Au; and
(4) an increase in the LREE/(MREE+HREE) ratio, and negative Eu and Ce anomalies, the hydrothermal alteration of muscovite, garnet, plagioclase, K-feldspar, and pyroxene, within the parent rocks, supplied Al±Fe and that leaching of alkalis favored the formation of kaolinite and Al+Mg+Fe+alkalis for smectite/illite under acidic and basic conditions, respectively. The leached Si favored formation of cristobalite/tridymite/quartz either as vein/stockwork/fracture infill or as a silica cap at the top of the deposit.
ACKNOWLEDGMENTS
The authors are much indebted to anonymous reviewers for their extremely careful and constructive reviews which improved the quality of the paper significantly. The authors are also extremely grateful to the Associate Editor, Prakash B. Malla, Editor-in-Chief, Joseph W. Stucki, and Managing Editor, Kevin Murphy, for their insightful editorial comments and suggestions. This paper was presented at the 9th Mid-European Clay Conference, 2018, in Zagreb, Croatia.
Compliance with Ethical Statements
Conflict of Interest
The authors declare that they have no conflict of interest.