

This article analyzes the chronological and geospatial distribution of fineware (terra sigillata) ceramics during the Late Roman period in the Iberian Peninsula and the Balearic Islands. The peninsula, also referred to as Hispania, comprises today’s Spain and Portugal, and encompassed most of the Late Roman diocese of the Spains (Hispaniae). Hispania was a civilian province, without significant Roman governmental or military presence. Yet, in the period under study, it was home to important figures including the churchmen Ossius of Córdoba and Priscillian of Ávila, as well as the emperor Theodosius I. A mere generation after Theodosius, the Romans lost Hispania, ending a half-millennium of rule there, and in the 6th c., the peninsula became the geographical focus of the post-Roman Visigothic kingdom. The timing and significance of this transition can be determined, in outline, from written sources. As for much of the Late Roman West, however, little survives to illuminate everyday lives and economic connectivities. This article uses ceramic data to explore the extent of Hispania’s integration into the Roman world, then to map the pace and trajectory of its removal from it.
Terra sigillata ceramics, either imported into Hispania or produced there, share broad formal characteristics and suggest a unified Roman material culture across the peninsula, despite formidable geographic barriers. By mapping their differing distributions, we can better understand the spatial dynamics of this important Roman diocese. By charting the temporal dynamics of the import, production, and use of these quintessentially Roman ceramics across Late Antiquity, we can track the end of a certain form of Romanness and a certain form of Roman economy. By combining spatial and temporal distributions, we may come to better comprehend the particularities of the end of that Roman economy: varying rates of change between coastal and inland regions, between the Mediterranean and Atlantic coasts, and between regions that remained within the Roman sphere of influence longer and those that fell out of it more quickly. While by the end of the period studied, no one in Hispania – or rather, Visigothic Spain – was using Roman-style fineware ceramics, this transition did not occur uniformly in time or in space.
This article focuses on the four most commonly found types of fineware ceramics in Late Roman Hispania: African Red Slip Ware (ARS), “Early Christian” sigillata from Gaul (DSP), Late Roman C from the eastern Mediterranean, and late Spanish sigillata (TSHT) in its various subtypes. It uses these ceramics’ presence or non-presence at named archaeological sites to determine the geographic distribution of ceramic types. This approach, in contrast to others that seek to quantify total imports, does not focus on the volume of trade, but rather which archaeological sites were participating directly or indirectly in the networks that distributed fineware ceramics (and presumably other goods as well). The article then shifts from synchronic spatial analysis of all ceramic types to diachronic analysis of African Red Slip Ware, the most common and most temporally differentiated of these types, to track changing degrees of network participation over time. The chronological scope is broadly the 3rd through 7th c. CE. The particular dynamics of each ceramic type’s production and distribution determine the extent to which it features in the analysis, but all periods are encompassed by ARS production. With the exception of ARS-A, included for completeness of the African series, only Late Imperial ceramics are studied.
The dataset presented here comes from published or unpublished reports, collected systematically over the period from 2020 to 2022. It represents the reported presence or non-presence of sigillata ceramics at 4,883 named archaeological sites, geolocated to at least the municipality level. Of these sites, 3,219 record the presence of at least one identifiable type of ceramic and of those, 2,246 report a type of Late Roman fineware (other sites report only commonware, transport vessels, or Early Imperial fineware). While I do not claim that this is a complete survey of all reported examples or find sites, the dataset represents a reasonably representative sample from which robust statistical conclusions can be drawn. The ceramics were catalogued in a relational database by ceramic form (e.g., Hayes 61) and subform (e.g., Hayes 61A), then grouped into types (ARS, TSHT, etc.) and, in some cases, chronological “import horizons.”Footnote 1 These import horizons have made it possible to calculate the relative number and proportion of sites receiving imported ceramics across five temporal periods.
Geospatial analysis relies on a division of Hispania into 15 regions, designed to enable comparison of differing spatio-temporal concentrations of finewares. While Spain has traditionally been divided according to natural features, geological zones, climate zones, Roman provinces, ecclesiastical boundaries, or even modern political divisions and subdivisions, these regional divisions seek to divide the peninsula into coherent geographic units that allow for meaningful comparison over the long term. The 15 regions, represented graphically on the maps below and in the first column of the tables, are as follows (beginning in the northeast): coastal Tarraconensis, including urban Tarragona; the sections of Mediterranean coast south of Tarragona, divided into a region focused on Valencia and another focused on Carthago Nova (Cartagena); the areas on either side of the Straights of Gibraltar; three regions capturing the Guadalquivir Valley, namely Hispalis (Seville) and its hinterland, the dispersed villas of the middle Guadalquivir, and the upper Guadalquivir centered on Córdoba. On the (Atlantic) coast, there are southern Lusitania and the Atlantic façade (comprising much of modern Portugal), and the northern façade of Galicia, Asturias, and Cantabria. The inland regions are the Ebro Valley, beginning in coastal Tarraconensis and moving upriver; the northern and southern Mesetas, which comprise Spain’s central plateau and are separated by the mountains of the Central System; and the area around and especially downriver from the diocesan capital at Augusta Emerita (modern Mérida). The 15th and final region, not on the peninsula, is represented by the Balearic Islands.
Scholars debate the role that sigillata played in the ancient economy; however, its use as a proxy for broader Roman economic trends is well established.Footnote 2 The changing distributions of these ceramic types can therefore provide a framework for understanding certain important aspects of Late Roman Spain’s economy and society, including interconnectivity, ease of transport, disposable income, and perhaps changing tastes. Each ceramic type clusters in particular zones, with ARS the most extensively present. African ceramics were most widespread in Hispania during the second half of the 4th c. and into the 5th c. There was no diminution in the number of sites receiving African fineware imports during the supposed “3rd-c. crisis.” However, by the middle of the 5th c., the number of sites receiving ARS had decreased by approximately 62%, with a much greater drop-off in the interior than along the coasts. This was not associated with any increase in the production of Spanish sigillata, which itself ceased production by 500 CE. These results suggest that 4th-c. Spain was integrated into Mediterranean economies and flush with disposable income, but also that the drop between the 4th and 5th c. was rapid and steep, reflecting the manifold difficulties experienced by the Roman government, and Roman producers and consumers, in the 5th c. CE. There was perhaps a slight recovery in ARS imports in the late 5th or early 6th c., confined to the coast and accompanying a rise in eastern Mediterranean imports, before another significant drop in both African (−42%) and eastern Mediterranean (−90%) imports in the middle of the 6th c. While some studies have noted this 6th-c. decrease in imports in certain regions, it has never been put into a longue-durée chronological-historical context.Footnote 3 The evidence collected here therefore suggests that Mediterranean exchange faced two major moments of crisis: one in the 5th c., associated with political dislocation, and another in the mid-6th c., associated with renewed warfare but also, perhaps, the specter of pandemic disease.
The four ceramic types under study
Four major types of fineware ceramics are found at Late Roman sites in Hispania. Each has a common name in English and one or more common abbreviations, often reflecting nomenclature in other languages: African Red Slip Ware (ARS, but in Romance languages TSC), late Spanish sigillata (TSHT), late Gallic sigillata (DSP), and Late Roman C/Phocaean Red Slip Ware (LRC/PRSW, both English abbreviations).Footnote 4 Certain other Late Roman finewares appear infrequently at Spanish sites: for example, Late Roman D/Cypriot Red Slip Ware has been found at just 25 sites across the peninsula. There are many subtypes within these broader categories: Spanish sigillata from different production centers, or ARS subtypes like ARS-A, C, D, and E (and now, e.g., A/D, D1, and D2), and the regional variations of TSHT. However, the primary division into four major suppliers can provide a rough heuristic for different production areas, and Hispania’s regionally differential integration with them. Table 1 shows the origin, approximate date range, and frequency in Hispania of each type. In the following section, they will be discussed in turn, beginning with ARS, and proceeding through TSHT, DSP, and LRC. This order also roughly tracks the chronological development of these productions. The distribution of these ceramics is first mapped in space, then I return to the highly differentiated ARS sequence to track change over time. Throughout, the preference for round- or quarter-century dates should be taken as a sign of the artificiality of the form-date structure rather than a claim to precision.
The four major types of Late Roman fineware found in Hispania. ARS here includes all three major subtypes: A, C, and D. The terminal date 500 CE for DSP represents the end of its importation into Hispania; production at Marseille, but not other production centers, seems to have continued longer. Few of these late forms appear at sites in Hispania.

African Red Slip Ware
The fine tableware most commonly imported into Late Roman Spain was African Red Slip Ware (ARS), called in the Romance languages terra sigillata clara/chiara/claire (TSC).Footnote 5 ARS is the most characteristic Late Roman fineware, and its wide distribution reflects Roman Africa’s economic power and the role that it served in the imperial economy from the early 2nd c. through the end of Late Antiquity.Footnote 6 ARS has generally been divided into three main subtypes, ARS-A, ARS-C, and ARS-D,Footnote 7 which developed in roughly chronological order. In brief outline, ARS-A was produced from around 80 CE in a series of workshops across what is now north and central Tunisia. In the 3rd c., the common “A” production ceased, and was replaced by the rarer “C” production, made further south in central Tunisia. In the last decades of the 3rd c., the ARS-D series of north/central Tunisia began production. In the 4th c., it became ubiquitous across the Roman Empire and present even beyond it. The most widely accepted categorization by shape follows John Hayes’s Reference Hayes1972 Late Roman Pottery. Scholars continue to correct and calibrate Hayes’s classification system and the associated dates of production.
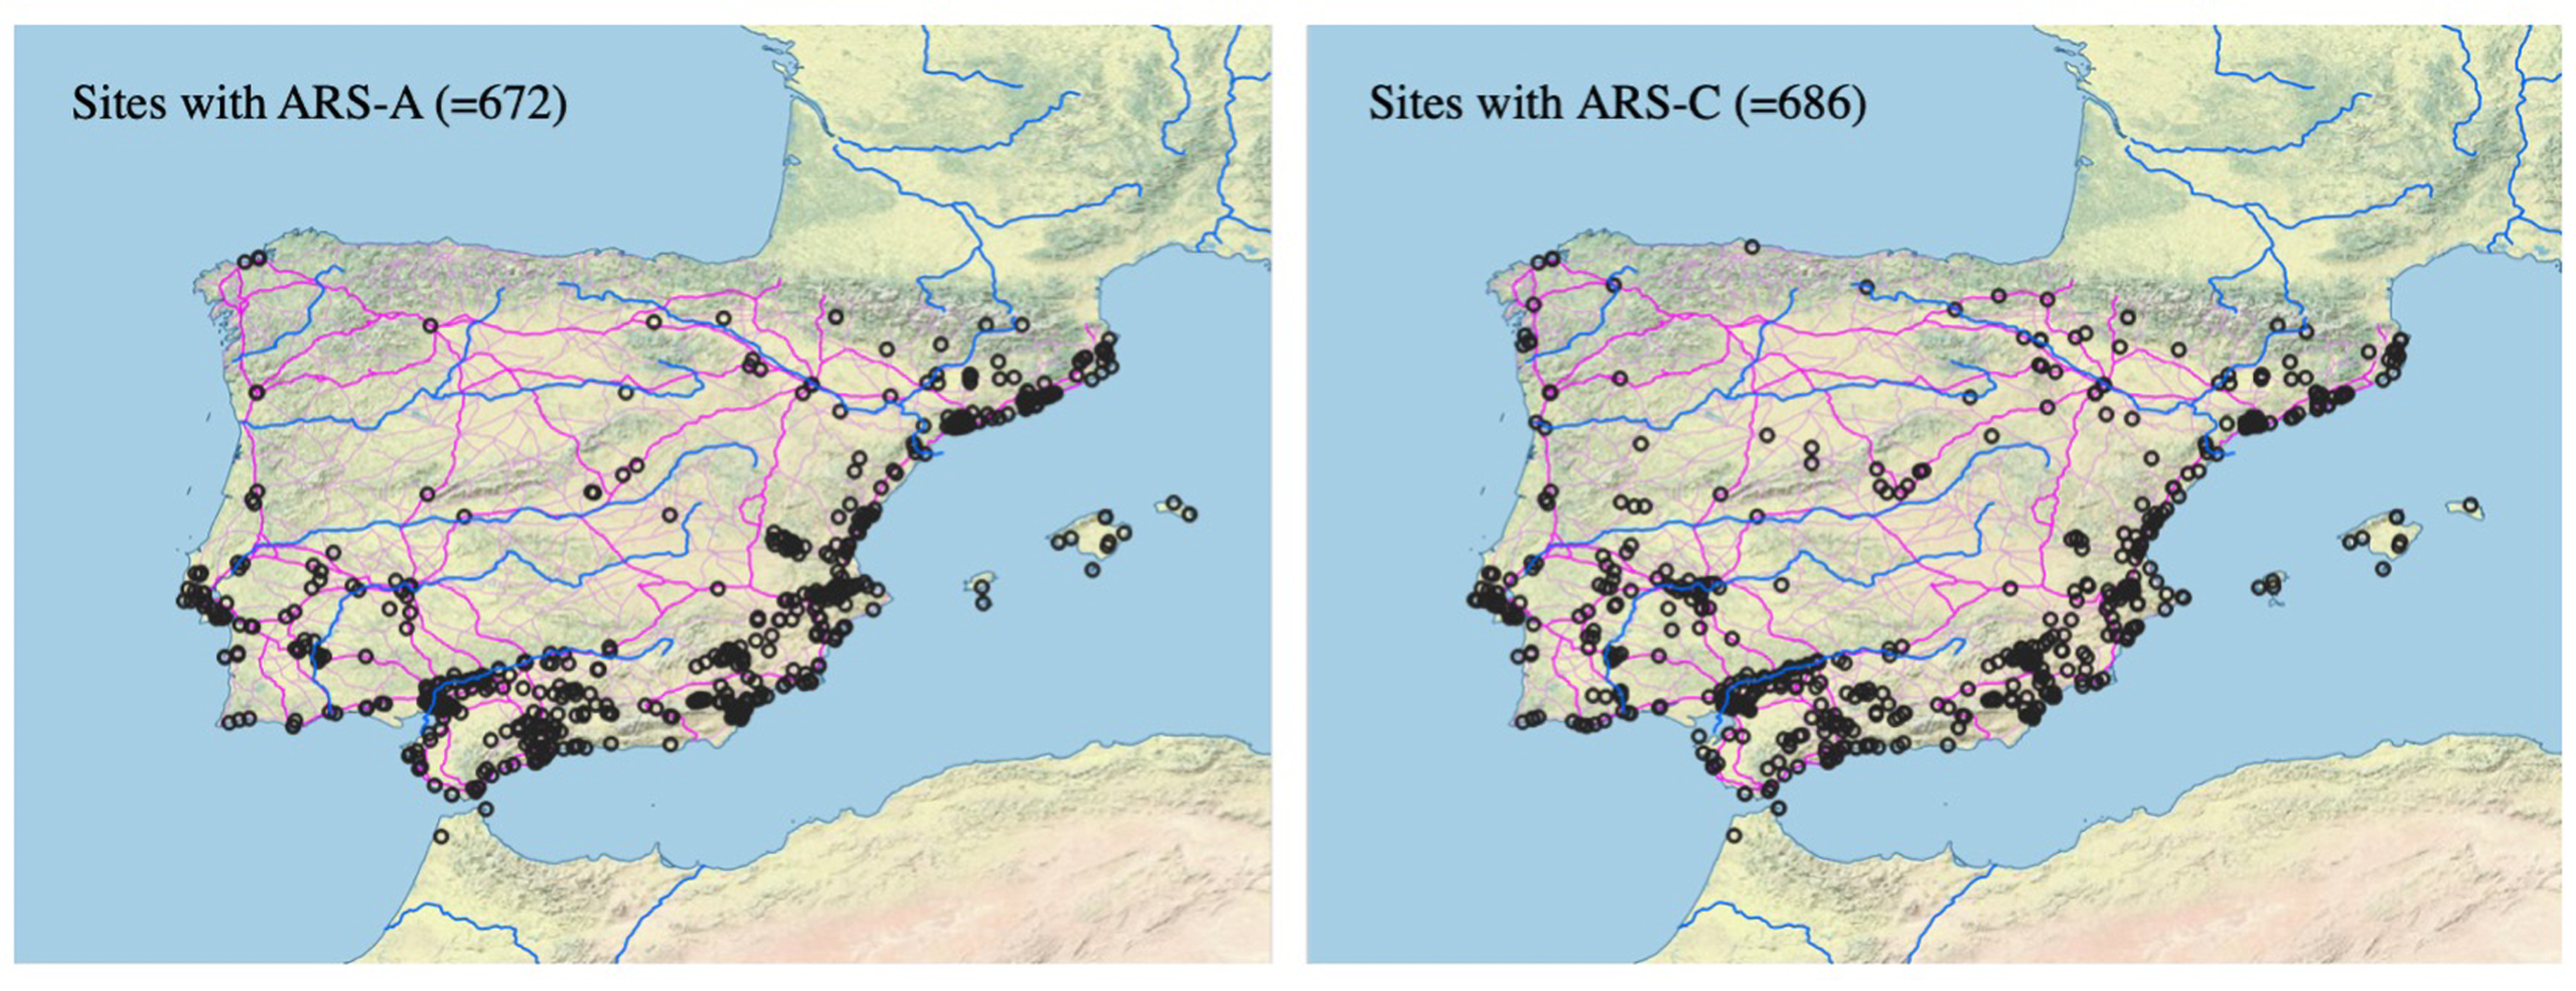
Figure 1 displays the geographic distribution of ARS-A and ARS-C.Footnote 8 They are found at just under 700 sites each (672 and 686, respectively). Fentress and Perkins’s Reference Fentress, Fontana, Perkins and Bruce Hitchner2004 study showed a roughly 75% decrease in the number of exported ARS vessels recovered from Western Mediterranean sites between ca. 200 and 270 CE.Footnote 9 In later work recalibrating their data, they write that the seeming decrease in ARS production ca. 250 reflects ARS-A being significantly more popular than ARS-C, which was a “lesser” production sandwiched between the large A and D productions.Footnote 10 In Hispania, however, the distribution of A and C is relatively similar, in terms of both the number of sites and those sites’ geographic spread. There are a few regions, primarily coastal, that show a slight decrease in the distribution of ARS-C compared with ARS-A, but this is offset by increases in inland areas. These increases are small in raw numbers but significant in percentage (e.g., from 9 sites with ARS-A to 18 with ARS-C in the two combined central Meseta regions). What we are therefore seeing is the progressive spread of ARS through the peninsula, expansion that is paused, but not reversed, during the 3rd c.
Comparative distribution of ARS-A (ca. 100–200 CE) and ARS-C (mostly ca. 225–400 CE), with sites where either ceramic type is found marked with unfilled circles. Although the distributions are fundamentally similar, ARS-C has more of a presence in the interior of the peninsula (both in the central Meseta and around Mérida), although neither of the two classes is widespread beyond the coast. (Map by the author.)

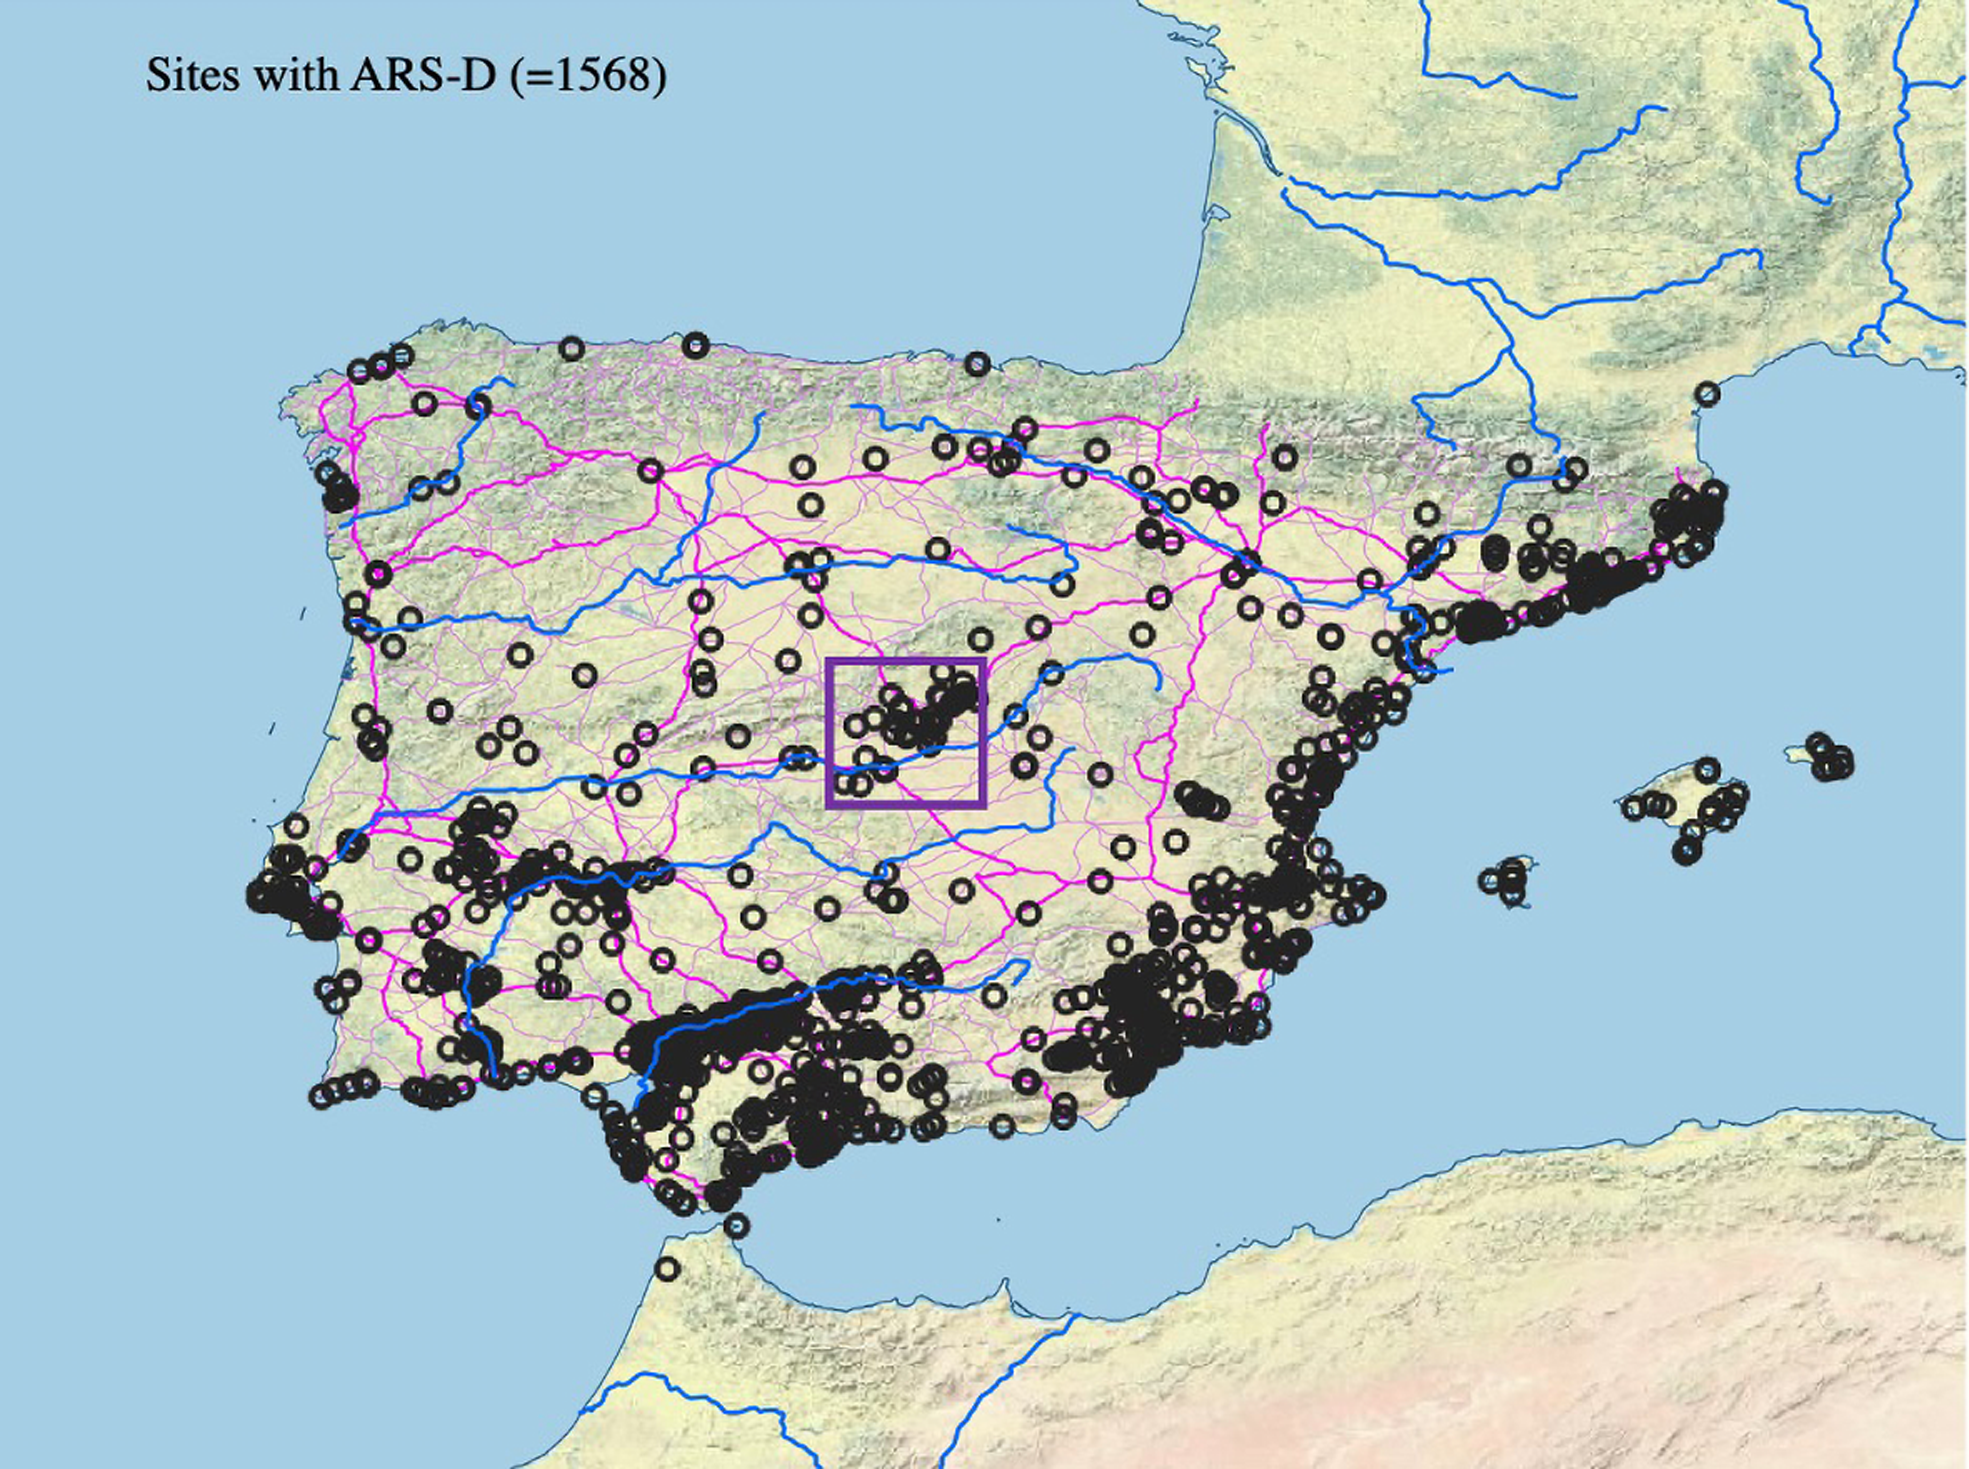
The D production, shown in Figure 2, dramatically expanded upon the footprint of its two predecessors in Hispania. ARS-D is found at 1,568 sites, more than twice the number of sites where either ARS-A or ARS-C is found. The Guadalquivir Valley, stretching from Seville to Córdoba, was particularly saturated with ARS-D.Footnote 11 There are 482 sites in the three Guadalquivir regions with any form of Late Roman fineware, 444 of those (92%) with ARS-D. Its abundance in the Guadalquivir demonstrates that this rich river valley was, in Late Antiquity, deeply tied into Mediterranean exchanges and generally still prosperous; its wealth and connectedness most likely derived from a resurgent olive oil export industry. Similar saturation of ARS occurs along the coast of Tarraconensis and Carthaginensis, in the cities of the southern Straits, and on the Atlantic coast.
The distribution of ARS-D, depicted through unfilled circles to show denser clusters. The Mediterranean coastal regions, the southern Atlantic façade up to Lisbon, and the Guadalquivir Valley show deep integration with Africa. Note the recently recognized concentration of African imports in the rural hinterland of Complutum (marked with a square), around what is now Madrid in the very center of the peninsula. This cluster was revealed by intensive survey associated with the expansion of Spain’s capital. (Map by the author.)

Fourth-century ARS-D is also abundant at the new diocesan capital, Mérida, and in its hinterland.Footnote 12 Even further inland, in the Meseta (north and south combined), there are 9 sites with ARS-A, 18 sites with ARS-C, and an astonishing 81 sites with ARS-D. The relative preponderance of the D form over the earlier forms is, in these regions, much greater than it is for the rest of the peninsula: the Meseta contains nine times more ARS-D than ARS-A and four-and-a-half times more than ARS-C, compared with “just” twice as much ARS-D as ARS-A or ARS-C for the peninsula overall. This represents significantly deeper penetration of African pots (and therefore, perhaps other goods?) in the 4th c. than in the 2nd or 3rd c.
TSHT: terra sigillata hispánica tardía
While ARS had penetrated deep into the peninsula by the late 4th c., in those regions where African dishes were less common, independent industries sprang up to supply a range of products that mimicked African forms.Footnote 13 These ceramics are generally known as terra sigillata hispánica tardía (“late Spanish sigillata”), or TSHT, and their origins lie in the very late 3rd or perhaps early 4th c. Although Hispania produced its own sigillata in the Early Imperial period, late Spanish sigillata does not represent continuity in these productions, which ceased at the end of the 2nd c.Footnote 14 The Late Roman producers, despite occasionally being located near or at early production centers, mostly break with the formal repertoire of the earlier period. With two major exceptions, the common 37(t) and Ritt. 8 forms, they copy African forms. This is part of a wider Late Roman trend towards the standardization of large serving platters, in which African potters took the lead but were followed by other producers.Footnote 15
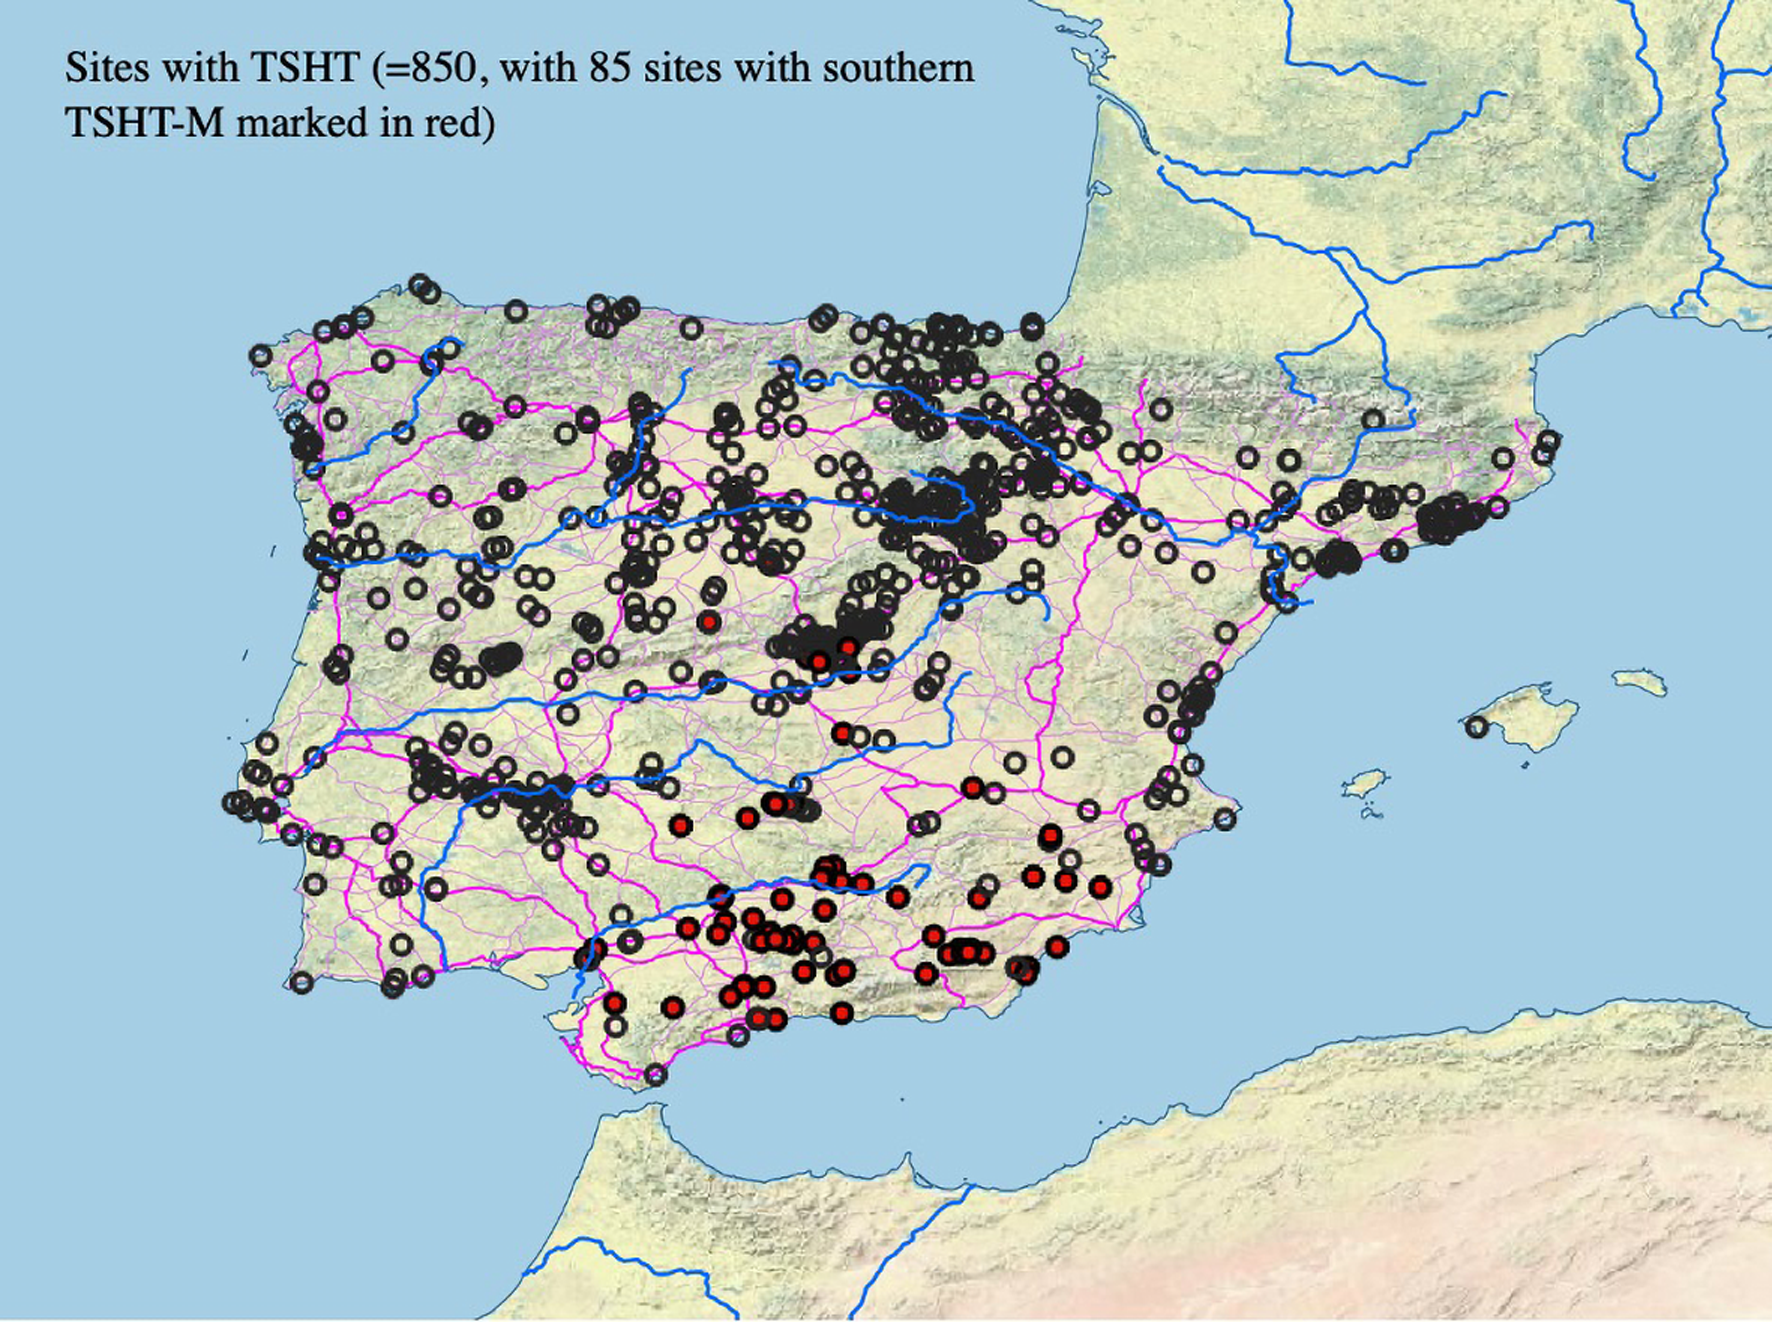
While many publications simply report TSHT, this term can refer to any of several different regional productions, based in (at least) the Ebro Valley, the Rioja, Baetica, the southern Meseta, and Braga. TSHT was primarily produced in the upper Ebro and Duero Valleys, in the northern half of the peninsula, where ARS was scarcer.Footnote 16 The other most prominent regional subtype of TSHT was a southern production, near Córdoba, known in Spanish as terra sigillata hispánica tardía meridional (TSHT-M).Footnote 17 After that, the next most common subtype is from Braga, in the far northwest.Footnote 18 Older publications tend not to differentiate between these centers of production but simply report the forms of TSHT found, using a number of sometimes overlapping classification systems.Footnote 19 However, recent work has shown that the centers operated independently and that by the 5th c., their productions circulated in clearly differentiated parts of the peninsula.
Figure 3 shows all sites with TSHT as circles, with reported finds of southern TSHT-M in red. Overall, the ware is most common throughout the Meseta and in the Rioja and upper Ebro Valleys, and dedicated attempts to collect all examples of TSHT from this region, including from unpublished sites, have identified over 1,200 individual find sites (not all included in my survey).Footnote 20 These areas were rich and important parts of Hispania, and contained many of the most luxurious monumental villas of the 4th c.Footnote 21 They were also far from the Mediterranean, and though ARS is present in the northern Meseta in small quantities, clearly as a prestige good, the vast majority of sites with fineware used the local TSHT.Footnote 22 The production centers were both urban (at Clunia and Pompaelo) and located at scattered rural sites.Footnote 23 The distribution of TSHT is resolutely inland, and seemingly did not rely on waterways but rather on the Roman road network. There is almost no TSHT, and no TSHT-M, in the Guadalquivir Valley, despite riverine access to production centers near Córdoba. No TSHT-M has been found in or around Mérida, which was connected to the sea through the (Atlantic) mouth of the Guadiana. However, the TSHT-M found in the central Meseta provides strong evidence for the use of the secondary roads going up from Córdoba into the southern Meseta.
Distribution of late Spanish sigillata (TSHT), differentiating between the northern and southern productions. The northern production is usually the assumed, and therefore unmarked, category in field reports, and the production center is not specified. The southern TSHT-M production (in red), whose distribution is centered in the upper Guadalquivir south of Córdoba, but does not extend along the river to Seville, demonstrates how ceramics could move without riverine or coastal transport. Note the one find-site just to the north of the central system of mountains. (Map by the author.)

Gallic sigillata and its imitators: DSP and imitation DSP
Although in the Late Republic and especially the Early Imperial period, Gallic sigillatas had dominated the export market, by Late Antiquity the industry had suffered a severe recession and the classical forms were no longer produced. Instead, potters in both Mediterranean and Atlantic Gaul imitated African forms and stamped decorations, but mostly in gray rather than ARS’s bright orange.Footnote 24 The major centers of production were in Provence (Marseille), Languedoc (Narbonne), and Aquitaine/“the Atlantic group” (Bordeaux). Each production center had its own history and followed its own chronology.Footnote 25 Broadly, Languedoc produced from the late 4th to the mid- to late-5th c.; the area around Marseille, from the early 5th through to the end of the 7th c.; and the Atlantic group from the early 5th c. with a floruit in the 6th.Footnote 26 For the most part, then, these were very late or post-Roman ceramics, but their distribution helps us recognize regional networks that most likely operated in the 4th c. as well.
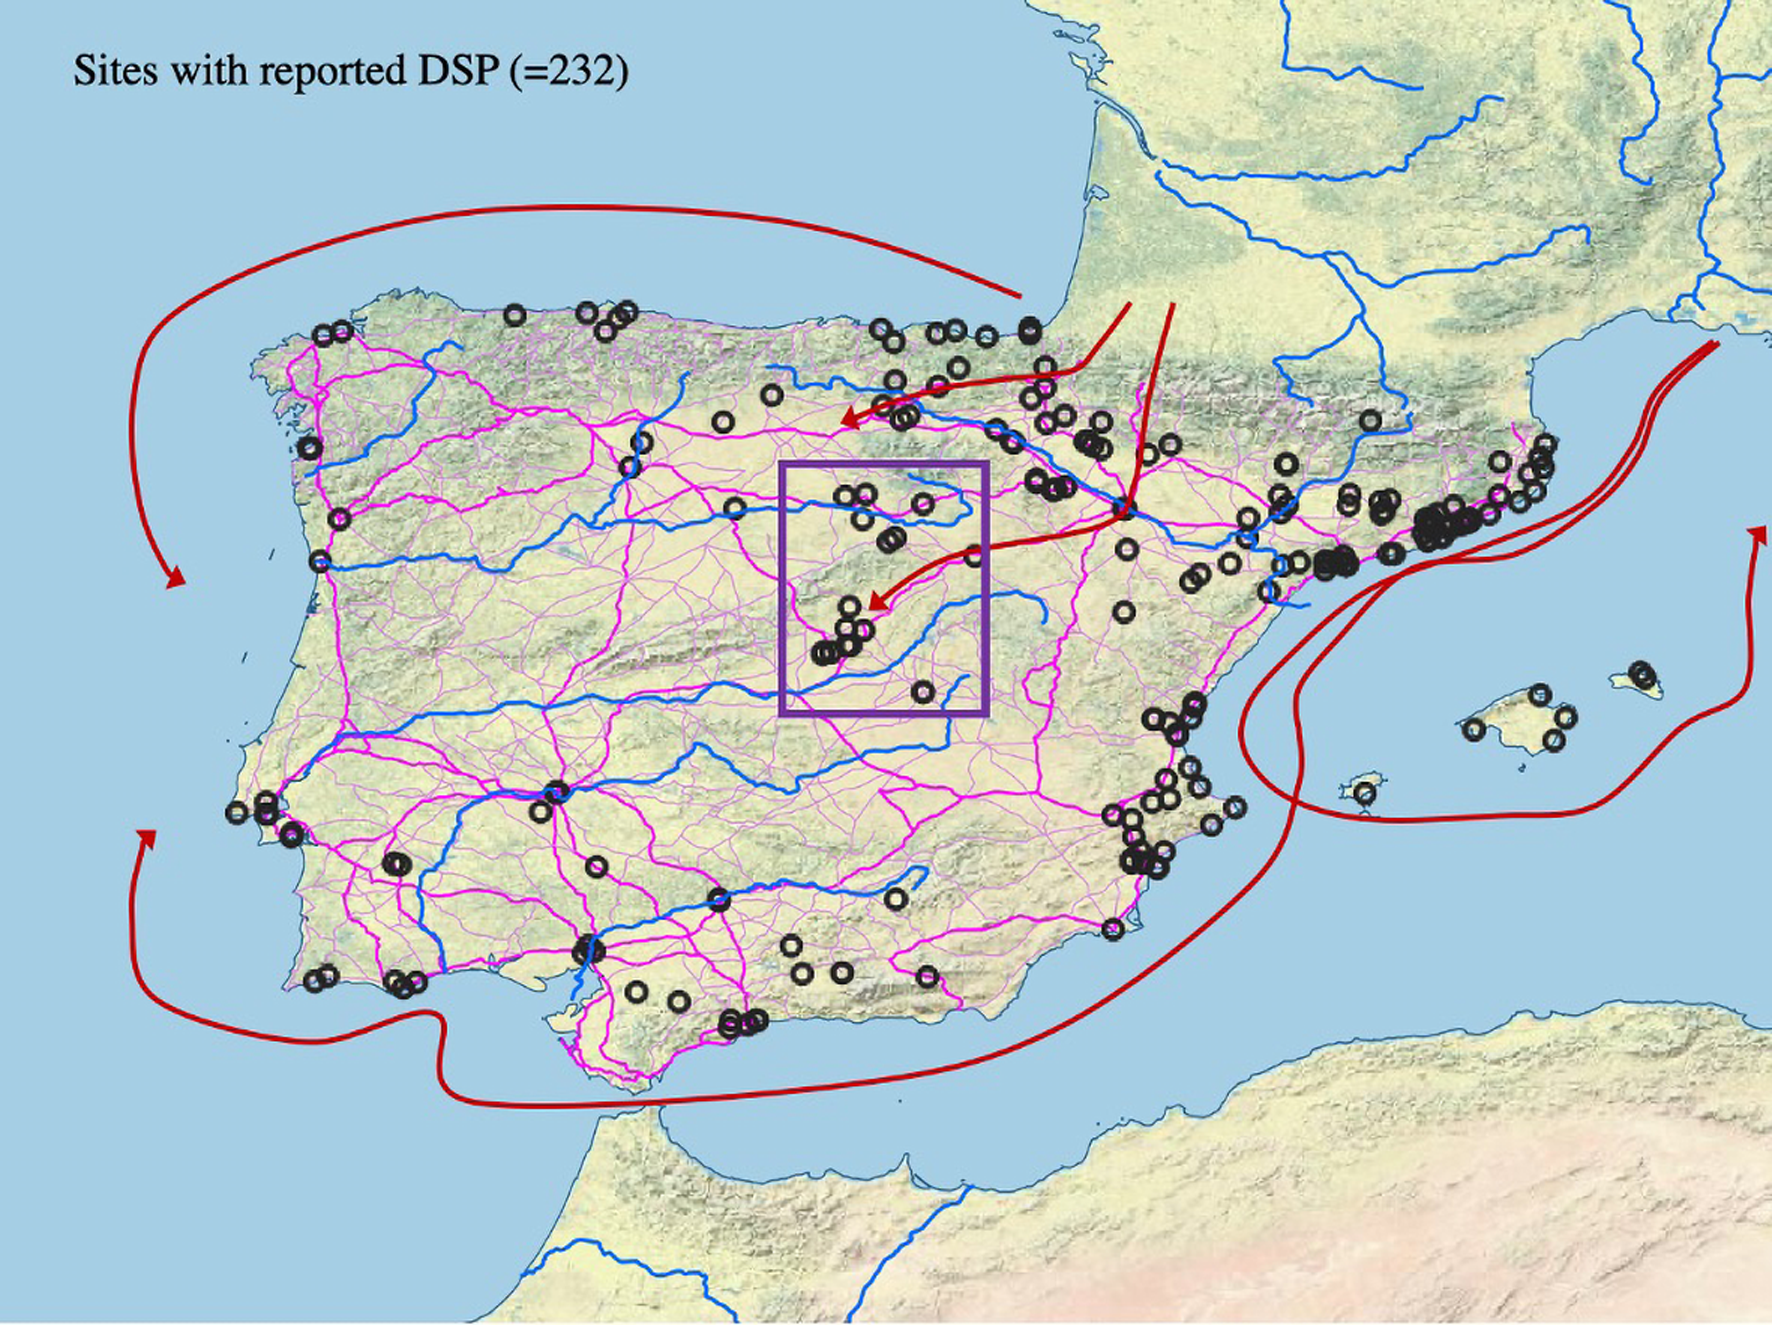
Figure 4 shows the distribution of DSP at sites in Hispania, with proposed general routes for distribution. Mediterranean DSP seems to have circulated in a loop that linked Provence, the northeastern coast of Tarraconensis down to Valencia and Alicante, and the Balearic Islands. In some cases, this trade reached the urban centers of the southern coast, but from there it does not seem commonly to have penetrated inland. The Atlantic forms traveled both along the northern coast – reaching the far Atlantic façade as part of the northern arc of trade – and by land across the Pyrenees into the upper Ebro. Material from the southern portion of Hispania’s Atlantic coast, from Seville up to Lisbon, shows that some of the Mediterranean DSP left that sea and was carried along the Atlantic coast. The DSP from the northern façade, however, was all Atlantic.Footnote 27 We therefore see three different seaborne patterns emerging (a Mediterranean loop, a Mediterranean–Atlantic transit and return, and a northern coastal route); there also seems to have been at least one route by road over the Pyrenees into the upper Ebro.
The distribution of the sites where ceramics that have been classified as DSP are found, showing proposed distribution routes both on land and by sea for both the Atlantic and Mediterranean productions. The scattering of sites where this ceramic type has been reported in the center of the peninsula (marked with a square) is the subject of fierce debate: can we differentiate authentic Gallic imports from their Spanish imitators? Could the Romans? (Map by the author.)

The cluster of sites with reported DSP in the center of the peninsula, around what is now Madrid, must be interpreted with caution, as many of the finds were likely local productions. Luis Carlos Juan Tovar and Juan Francisco Blanco García reassessed many ceramic finds collected in the area around Segovia, mostly unpublished, and identified stamped gray ceramics of varying quality, burnished to imitate sigillata (cerámica bruñida) and produced in the very late 4th c. and especially the 5th c.Footnote 28 Juan Tovar and his colleagues later systematically restudied each Late Antique context at Loranca (Fuenlabrada, near Madrid) to disaggregate the ceramics that had been presented under the generic name, DSP. They confirmed just one sherd of “real” late Gallic sigillata, though this was not a diagnostic sherd and can therefore only be dated “after ca. 370.” They were able to distinguish large amounts of Spanish-origin gray tableware which fit Rigoir’s typology for the late Gallic sigillatas.Footnote 29 They also found many commonware pieces imitating these forms, often quite high quality but lacking the high-fired slip that distinguishes sigillata from other tablewares in modern scholarship. These are referred to as “imitation sigillata” (cerámica de imitación de sigillata), a catch-all term used to indicate ceramics that in form and color mimic late sigillata or sigillata-derived ceramics, but are made with unrefined clay and different, less skilled and capital-intensive techniques.Footnote 30
The production of these imitation DSP pieces in the 5th-c. Meseta reflects a desire for the gray pottery of Late Roman Gaul without the ability to acquire “real” pieces. Luis Caballero Zoreda first proposed a scheme whereby there is a lineal descent from the Gallic forms to local imitations in high quality sigillata to, eventually, the imitations of sigillata, which he dates up to the 7th c.Footnote 31 There is little evidence, however, that ceramics in this Late Roman style were being produced during the Visigothic period. Rather, it seems that we are looking at a primarily late 4th- and 5th-c. phenomenon. The production of the imitation forms – both in “true” sigillata and in high-quality commonware – reflects unmet demand for Roman ceramic types. Initial claims of DSP throughout central Hispania suggested robust overland trade, into the central plateau, from Gaul. That most of the pieces are, in fact, imitations not only contradicts this, but highlights just how difficult most overland transport was. While these regions certainly had some contact with Gallic ceramics (enough to copy them and to have the desire to do so) they were not importing them in large quantities.
Eastern sigillatas: LRC and LRD
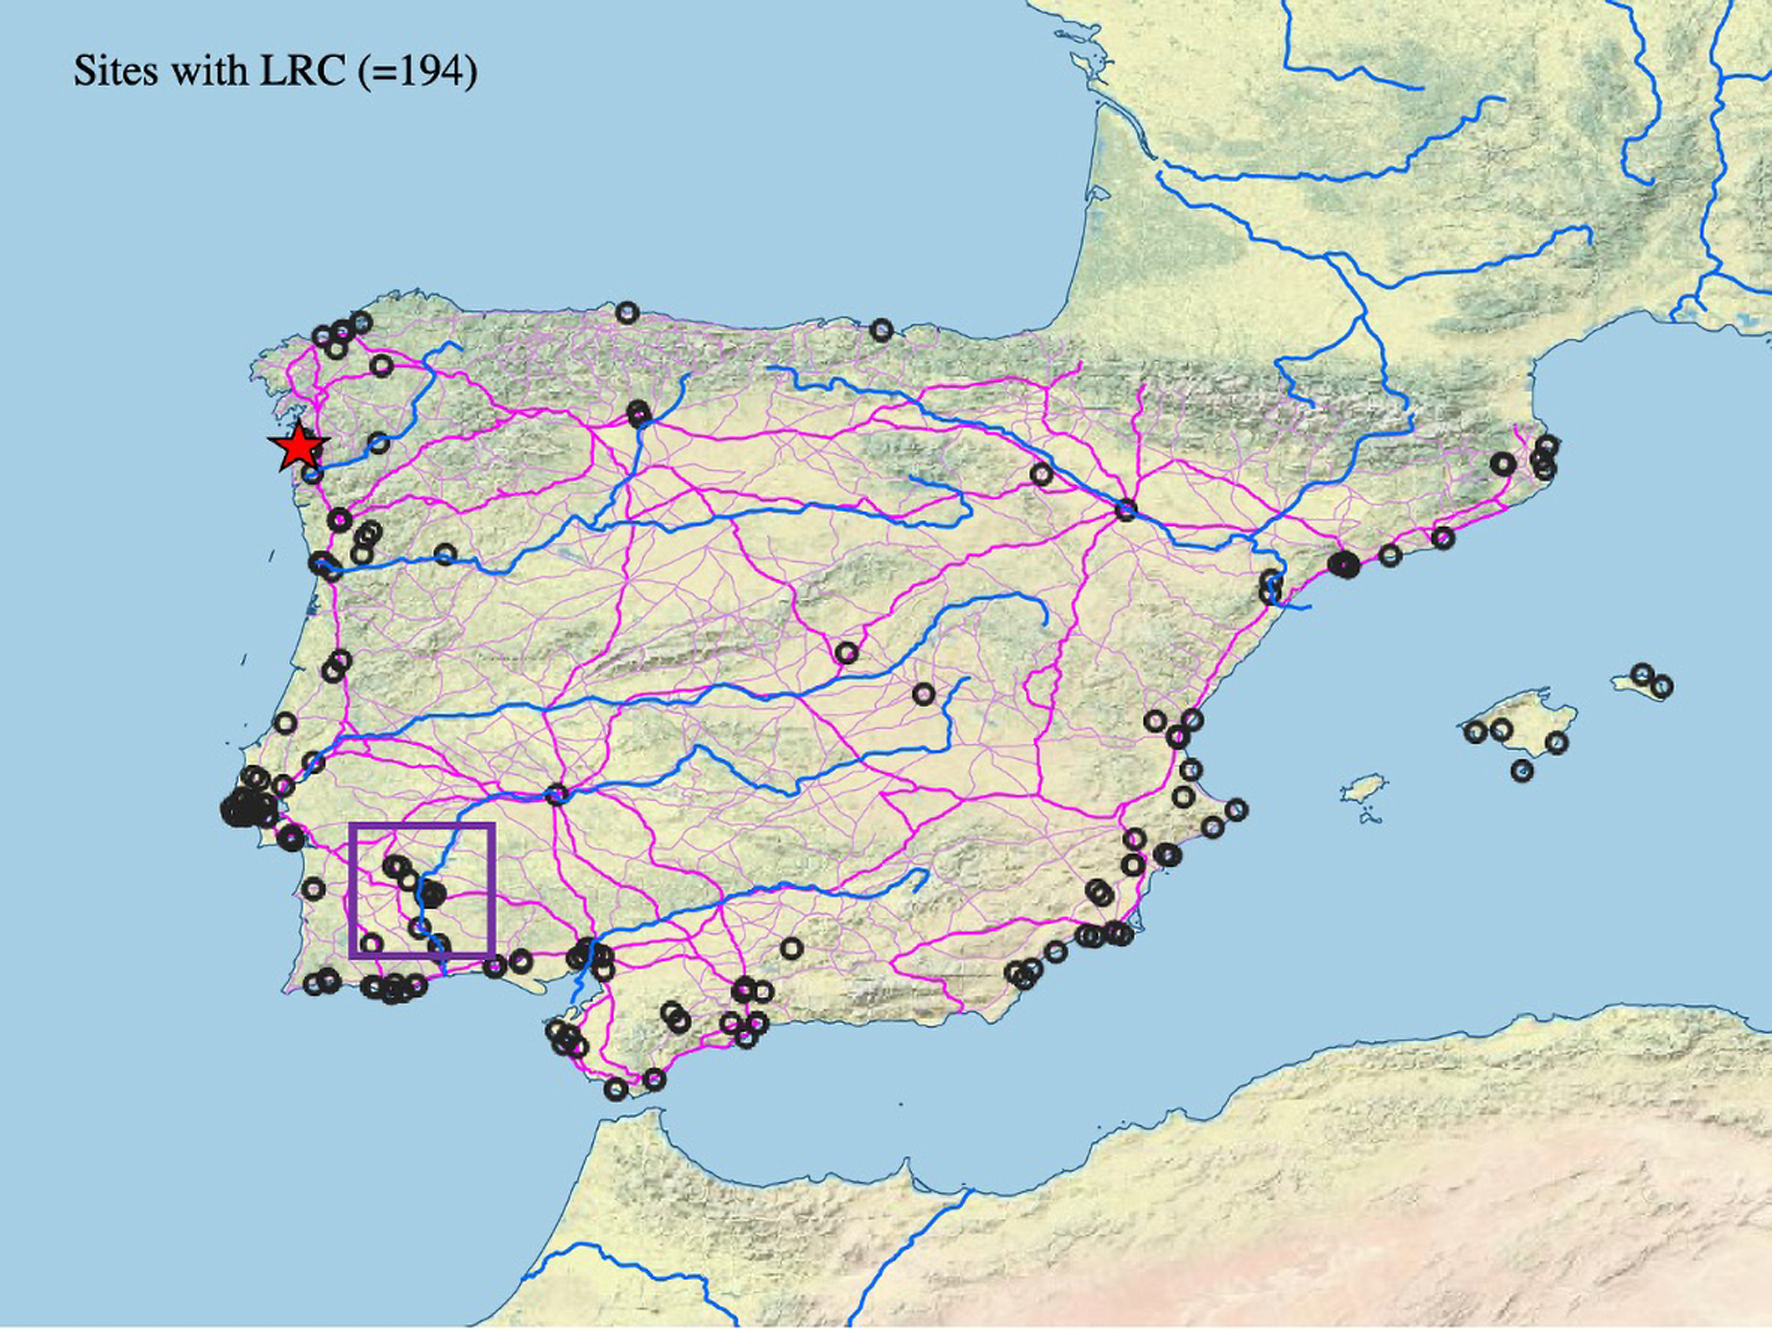
The final finewares found at large numbers of Late Roman and especially post-Roman sites in Hispania are from the eastern Mediterranean. The most common eastern sigillata is the type known as Late Roman C or Phocaean Red Slip Ware, which was produced in modern-day Turkey, near the ancient town of Phocaea (and nearby Grynion).Footnote 32 To a lesser extent, Late Roman D or Cypriot Red Slip Ware is also found in Hispania.Footnote 33 These two types of fine tablewares were produced from approximately 350 to 700 CE. Their distribution is almost entirely coastal. That these ceramic types were imported via seagoing ship routes is clear from the cluster of sites with LRC that are found near the Pulo de Lobo waterfall. This is where seagoing ships had to stop traveling up the Guadiana toward Mérida and goods were transshipped onto smaller vessels. The distribution to the Atlantic, out of the Straits of Gibraltar, continued to the British Isles at least until ca. 540 CE. However, analysis of the phases of importation of LRC into Hispania shows that the earliest forms are almost entirely absent from the peninsula, and that importation only began in earnest after the introduction of the common Hayes 3 form around 450 CE. The distribution presented in Figure 5, therefore, represents a Mediterranean ceramic distribution from the period 450–600 CE. This is a post-Roman ceramic distribution.Footnote 34 It demonstrates that trade between the eastern and western Mediterranean persisted through and beyond the 5th c. It further suggests directed trade beyond the Mediterranean in the late 5th and early 6th c., likely for raw materials (especially ores) available in Britain. The concentration of materials in the estuary of Vigo, on the borders of the ephemeral Suevic kingdom, suggests that this was an emporium site, like those that appeared at the interstices of many early medieval societies.
The distribution of LRC/Phocaean Red Slip Ware in Hispania. Of particular note are: the almost exclusively coastal distribution; the high density of finds along the Atlantic coast, somewhat understated in this map due to the dense cluster at Vigo, in the northwest, marked by a star; and finally, the cluster marked with a square near the Pulo de Lobo waterfall on the Guadiana River southwest of Mérida, which shows the point beyond which seagoing ships could not travel. (Map by the author.)

Distribution by region
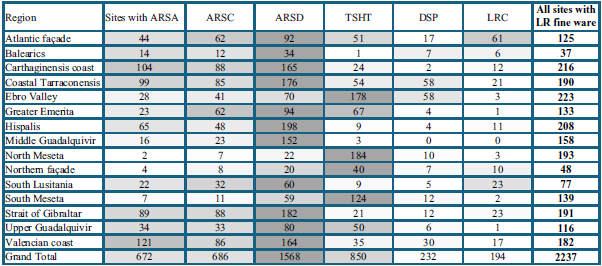
So far, the data have been displayed as overlapping points for one ceramic type at a time, with each point representing a site at which a type of ceramic was found. This shows each type’s maximum diffusion but does not indicate its comparative frequency. The following section therefore presents the distribution of types by region, in both table and map form. This project uses the 15 regions of Spain described above. They range from very small (37 total sites with late sigillata in the Balearics) to relatively large (seven regions with between 175 and 225 sites). Table 2 shows the number of sites in each province where each type occurs, with ARS separated into its three most common subtypes. The most common type overall is the D variety of ARS. In most regions, this is the most common type as well. However, in the central Meseta (both north and south), the Ebro Valley, and the northern façade, TSHT is more common than ARS. The two other forms found in Hispania, DSP and LRC, are significantly less common and, apart from the abundant LRC along the Atlantic façade and the middling presence of DSP in the Ebro Valley, do not occur at significant numbers of sites compared with the other types.
The 15 regions of Spain, and the number of sites in each with each type of fineware. The cells are shaded with respect to each region’s own distributions: the darker the shading, the more common that type of ceramic is within a particular region. The data in this chart is most useful for comparison within regions rather than between them.

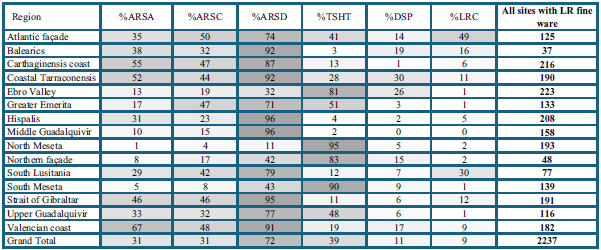
These regional raw totals are difficult to interpret because each region differs in its total number of reported sites. Variations in the intensity of investigation are added to other disparities in ancient settlement density and make it hard to compare the meaning of the 34 sites with ARS-D in the Balearics and the 54 sites with TSHT in coastal Tarraconensis. Table 3 shows not the raw totals but rather the percentage of sites in each region where each type is found. I only use those sites where a form of late sigillata was found; thus, those sites where no sigillata was reported, or where only Early Imperial sigillata was reported, are excluded. What is shown is, therefore, what percentage of sites with any type of late sigillata had each specific type. Since sites can report more than one type, the percentages add up to more than 100.
Distribution of fineware types by region, as a percentage of total sites with any form of Late Roman fineware. The shading represents the saturation across the entire dataset, rather than just in each region, and therefore allows for comparison between regions rather than only within them, as in Table 2 above.

The percentage method also shows that ARS-D, found at 72% of sites where any late fineware has been reported, was the fineware with the widest distribution. The overall total masks significant regional variation. In some areas, such as the Straits of Gibraltar, Hispalis (Seville), and up the Guadalquivir, almost every site with any late fineware has ARS-D. This is perhaps not surprising, but the sheer dominance of the type is stunning. In the center of the peninsula, especially in the Meseta, we find TSHT, not ARS-D, at 90% or more of sites. TSHT also saturates the Ebro Valley, especially the upper Ebro where it was produced in large quantities, and it is present all along the northern façade. Eastern Mediterranean LRC is found primarily along the Atlantic façade, with very little in the interior, or even in coastal Tarraconensis. The regional divisions therefore seem to match the impression generated by the point maps above.
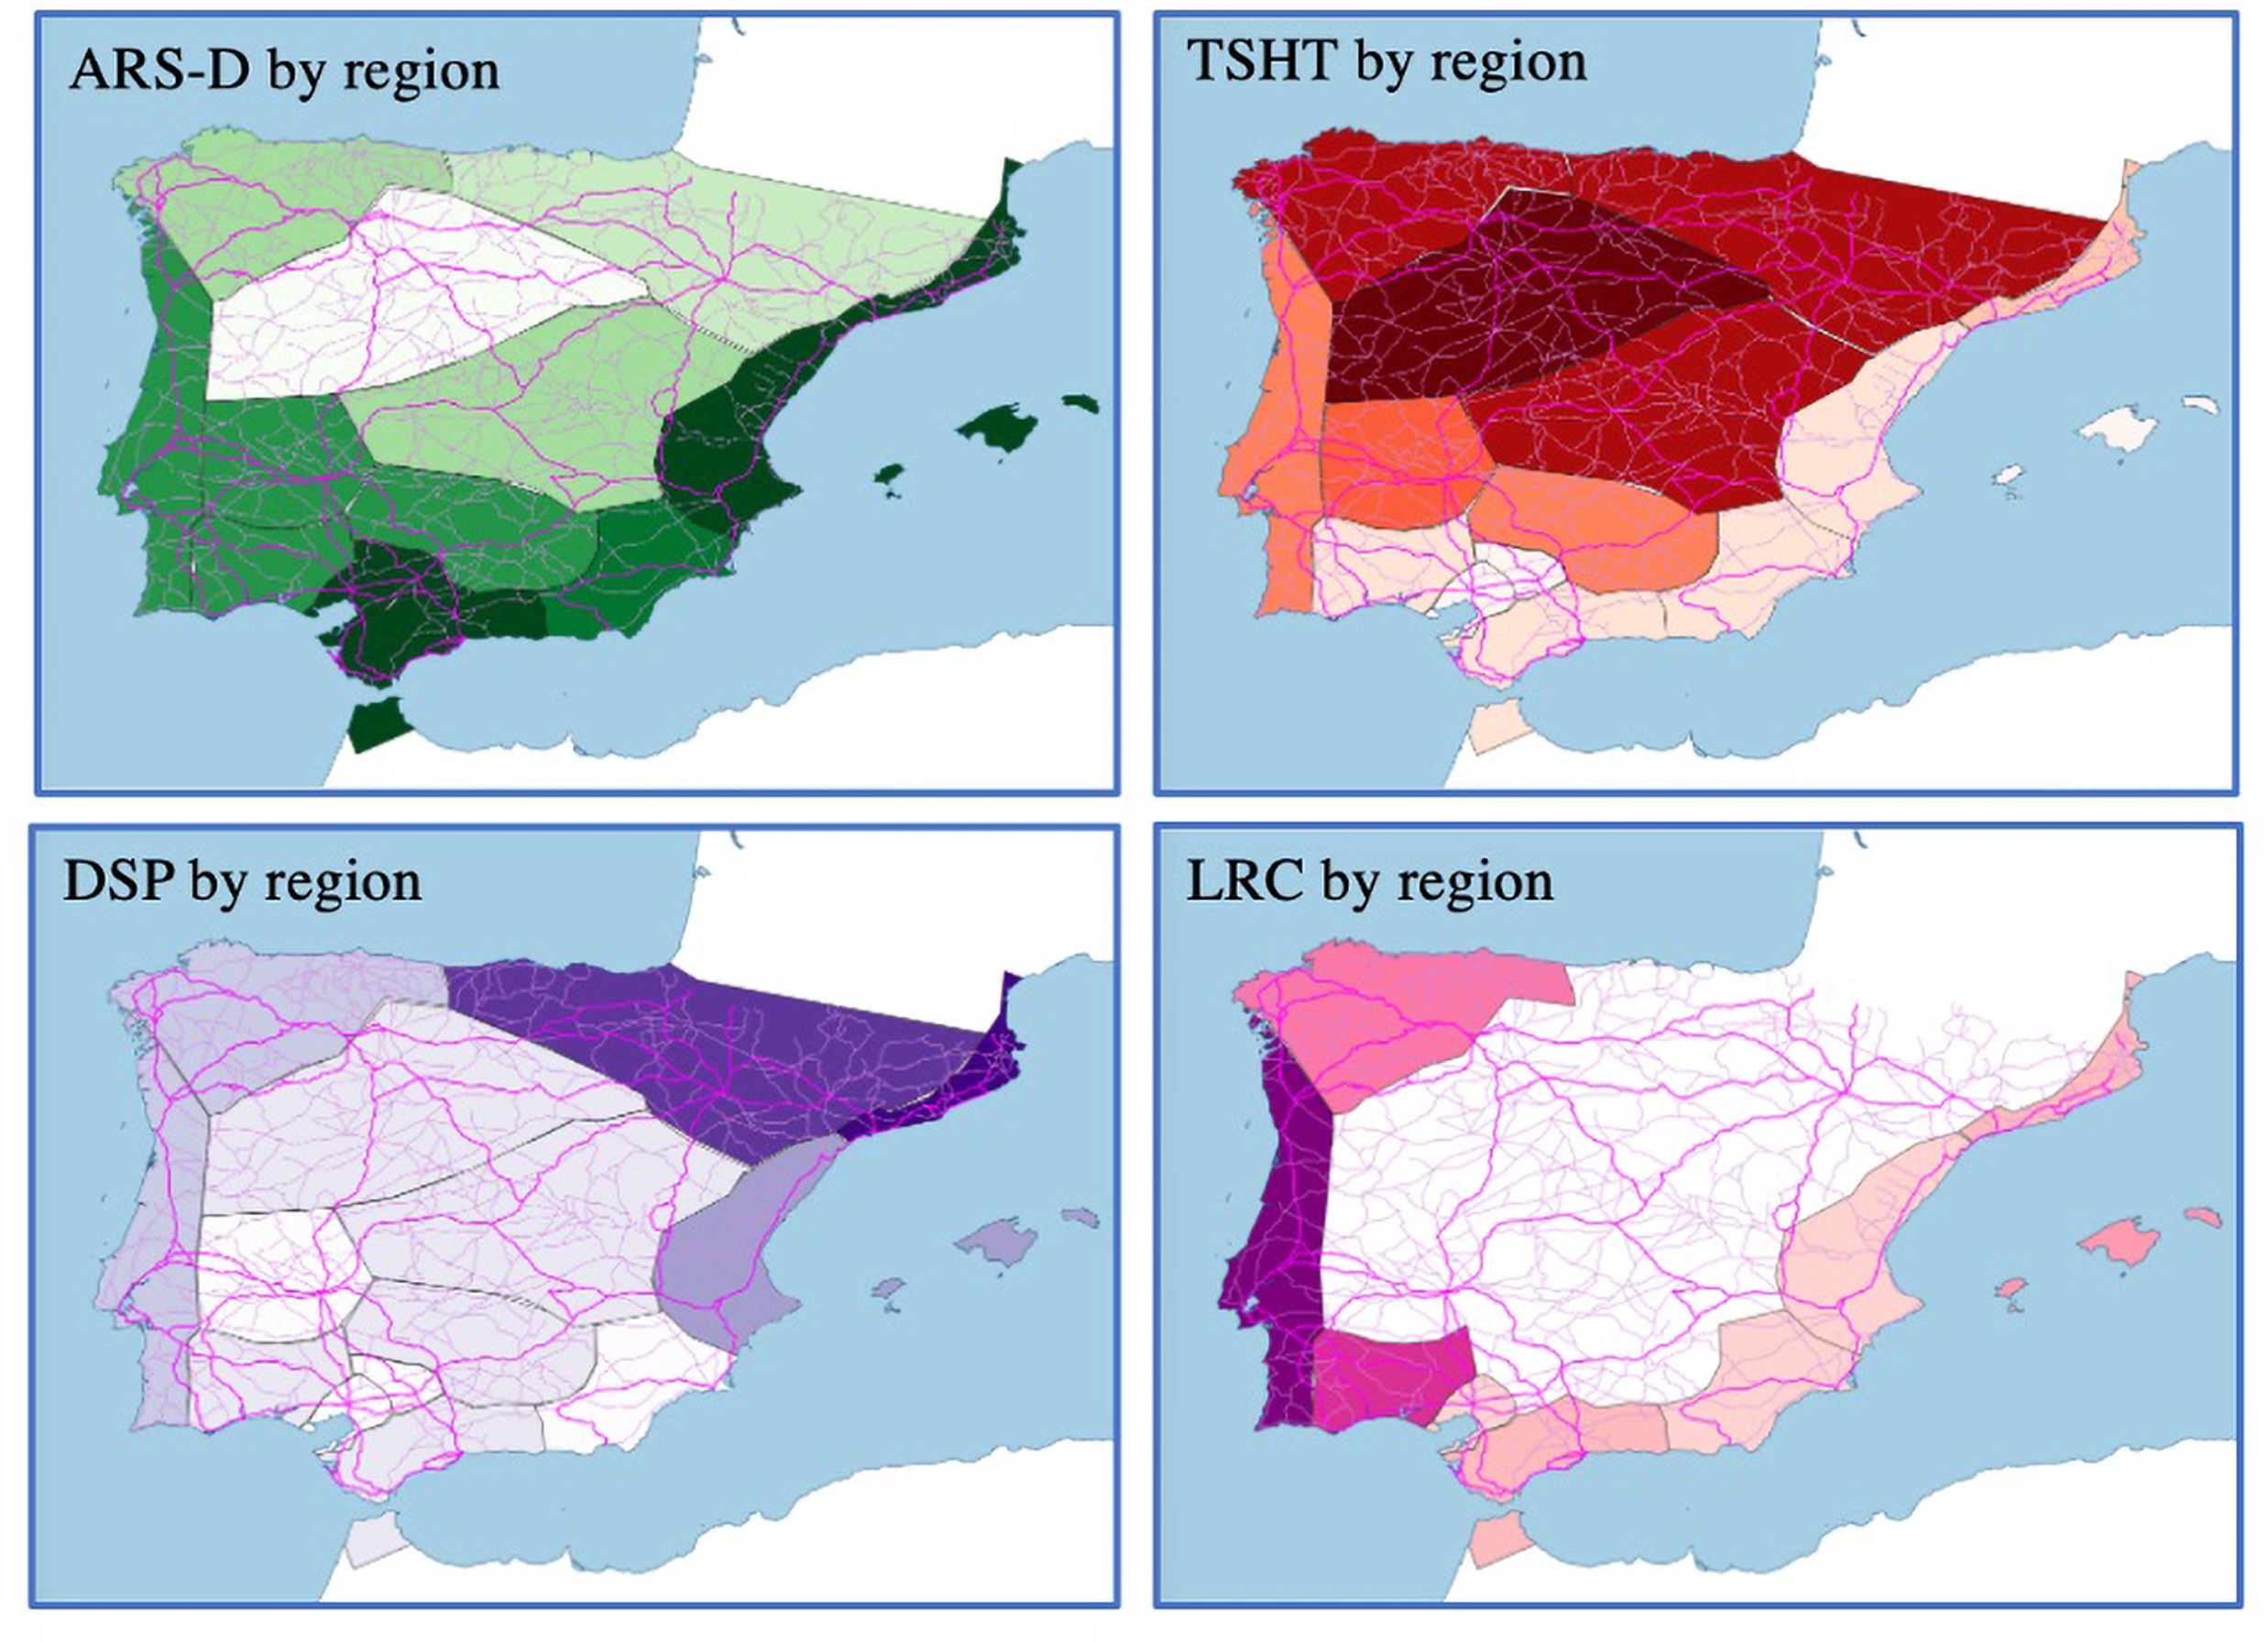
The relative density of each import in each region can be depicted in map form. Figure 6 shows the data from Table 3 – that is, the percentage of sites with any Late Roman fineware that have each type of fineware – as a choropleth map. The darker the shade, the greater the saturation of that ceramic form in that region. The map illustrates the varying regional distributions of these ceramics. The inverse relationship between TSHT and ARS is especially clear. People living closer to the African production centers of ARS had more of it, while those who lived further away had Spanish sigillata that copied African forms, in an almost perfectly inverse proportion.
Distribution of four Late Roman ceramic classes by region. Each is shaded according to a 9-division natural breaks (Jenks) classification in QGIS. Observe the inverse densities of ARS and TSHT, the fundamentally Atlantic distribution of LRC, and how the “Ebro Valley” region obscures the multiple distribution routes of DSP, a problem exacerbated when using the province Tarraconensis (which includes both Mediterranean and Atlantic coasts) as an analytical region. (Map by the author.)

ARS imports over time
The previous section showed that the most common fineware ceramic in Late Roman Spain was the “D” production of African Red Slip Ware. This ceramic type is significantly more common than the earlier “A” or “C” types of ARS and by the end of the 4th c. was present in every region of Hispania. The spread of the “D” production over and against the earlier “A” and “C” productions shows an expansion of networks of exchange, which brought this ceramic to regions far from the coast, over the course of centuries. However, ARS-D can also show us more rapid changes, in the order of decades. One of the most important aspects of ARS is that modern scholars have identified, categorized, and plausibly dated hundreds of distinct forms. The production of specific forms can, in most cases, be dated to the century, and in many cases, even to the half century. Individual contexts comprising multiple forms can therefore often be dated approximately to the decade.
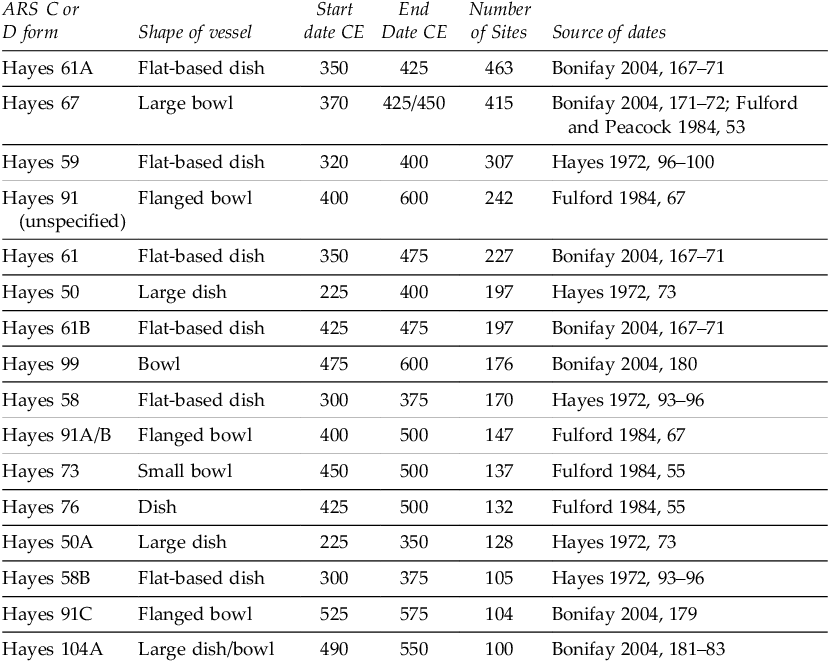
Table 4 shows the forms of ARS-C and ARS-D (that is to say, Late Roman ARS) found at the greatest number of sites in Hispania. Where a certain common or well-differentiated form is indicated without a specific subform, it can be assumed that site reports did not identify the more specific form; sites where, for example, Hayes 61A or 61B have been reported do not also have Hayes 61 (unspecified). The Hayes 61A form is the most common. Its distribution represents the apogee of ARS’s expansion into Hispania. Also common are other late 4th- and early 5th-c. forms, especially the Hayes 67, the entirely 4th-c. Hayes 59s, and the earlier A and B forms of Hayes 91. Hayes 91A and 91B are significantly harder to distinguish from each other than either is from the 91C, which has a distinctively sharp curve in the rim; therefore, it is possible that the 91A and 91B, produced concurrently in the 5th c., are overrepresented in the number of Hayes 91s with unspecified subforms. There are significantly more sites with forms from the late 4th c. than from the early 4th c.; over the course of that century, ARS became more and more popular. Its distribution, in Spain and elsewhere, peaked in the late 4th or early 5th c.Footnote 35 Later forms such as the 99 and the 104 are found at far fewer sites. In cases when we can see the same dish evolve over time, the numbers always decrease: there are fewer Hayes 61B than 61A, fewer 91C than 91A/B, and fewer 104C than 104A.
The forms of ARS-C and ARS-D found at 100 or more sites in Hispania, with rough production dates for each. The most common forms are the Hayes 61A and the Hayes 67, both mid-to-late 4th-c. forms produced into the 5th c. The Hayes 61B, produced from ca. 425, is significantly less common in Hispania than the Hayes 61A, showing the steep drop-off in ARS imports in the early 5th c.

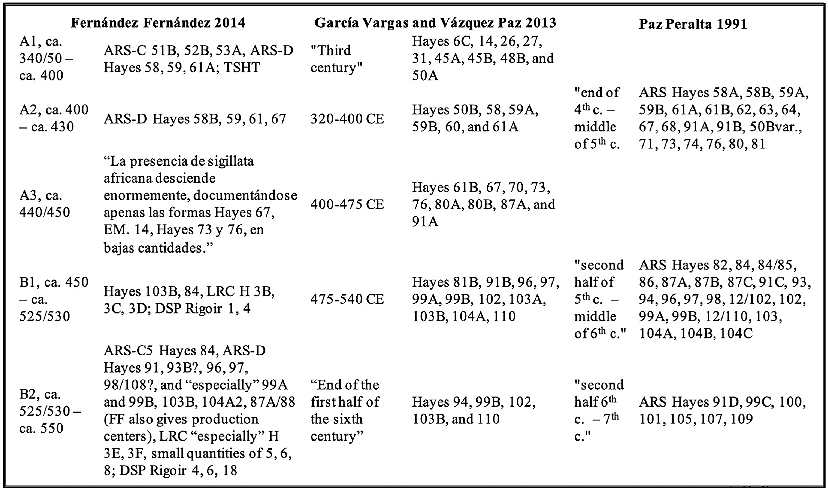
The precision with which we can date individual forms of ARS enables us to examine the changes in the distribution patterns of these ceramics over time. One way to do that is to calculate the volume of ceramics being imported at any one time, either at an individual site or across a region.Footnote 36 This method requires sherd counts and is therefore unsuitable for the data presented here. Another way is to measure the number of sites with any ceramics from different “import horizons.” Rather than tracking the total volume of ceramics traded, it traces how many sites were participating in the exchange networks distributing ceramics at a defined moment. This second method first requires division of ceramic forms into horizons that represent ceramics circulating at broadly the same time. Scholars have constructed import horizons in different ways. Table 5 shows the horizons used by Adolfo Fernández Fernández to interpret his work at Vigo, García Vargas and Vázquez Paz to analyze survey material from around Seville, and Paz Peralta for Zaragoza.Footnote 37 A comparison shows that these horizons differ both in their temporal divisions and in the dates they assign to certain specific forms.
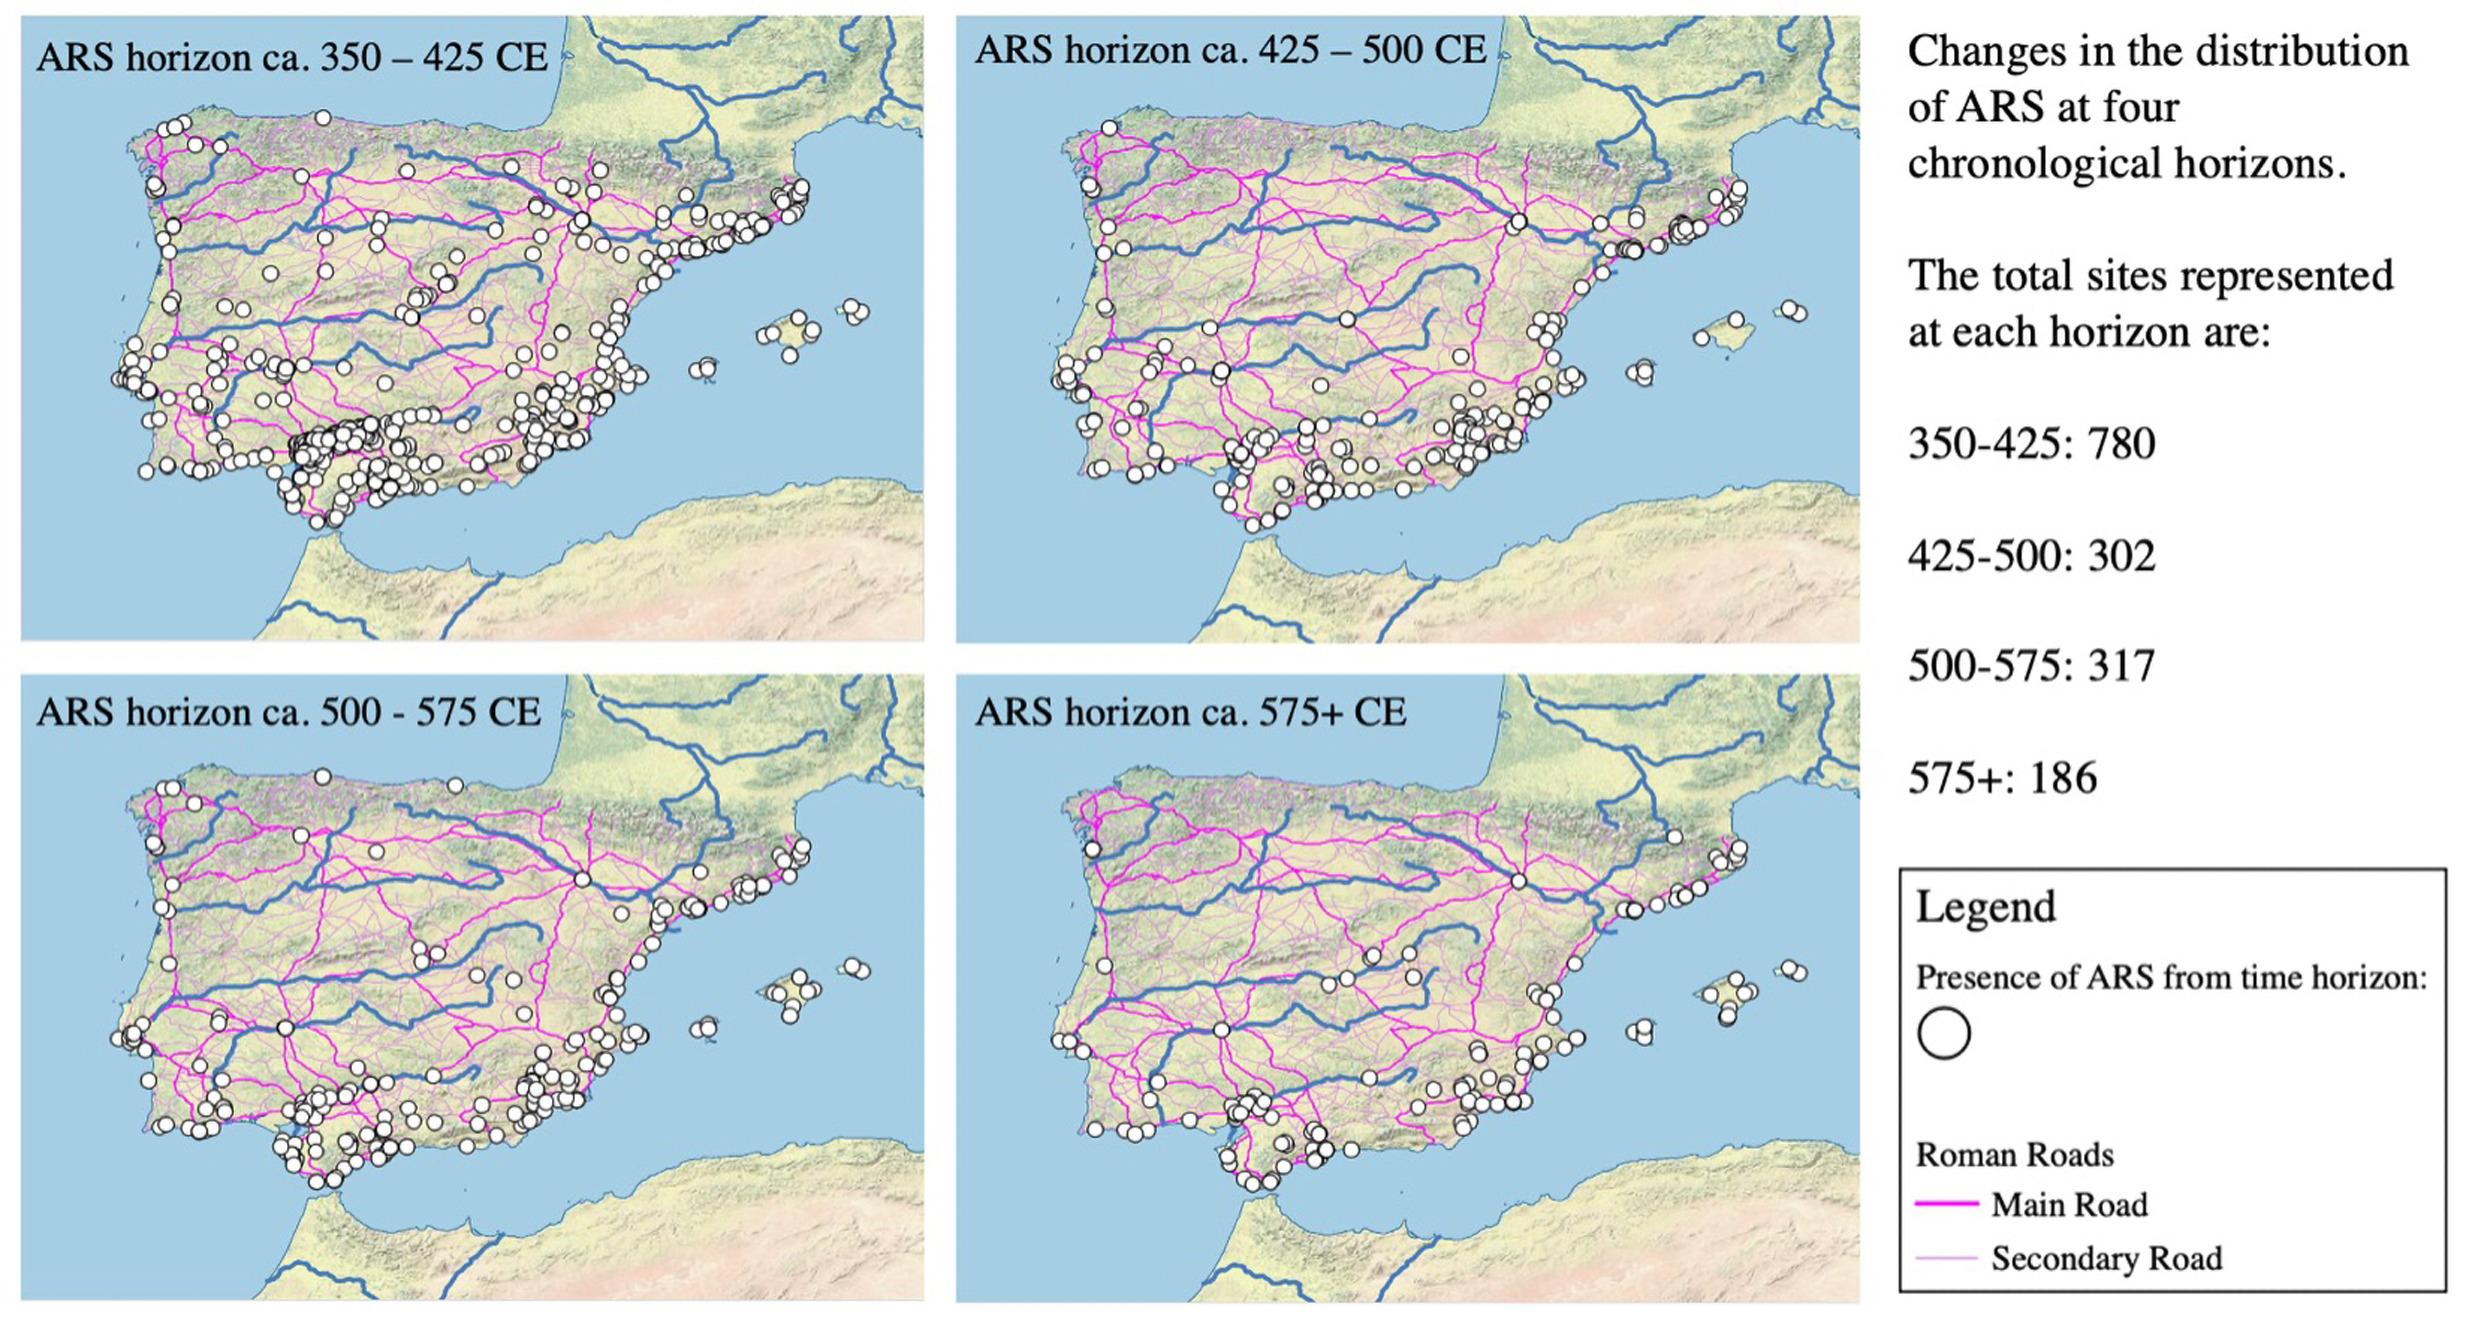
Mapping the changing import horizons of ARS in space. Note the particularly large drop between the late 4th/early 5th c. horizon and the mid-5th c. horizon in inland areas, as well as the continued, if somewhat diminished, presence of ARS along the coasts. (Map by the author.)

Ceramic horizons. The horizons constructed and used by Fernández Fernández, working at Vigo on the Atlantic façade, and by García Vargas and Vásquez Paz, based on their surveys of the lower Guadalquivir near Seville, as well as the three-horizon model used by Paz Peralta at Zarazoga. Note the differences between their treatments of the Hayes 61 and 91 forms. Fernández Fernández does not separate out Hayes 61B, nor does he indicate any subforms for Hayes 91 in his horizons. Disagreement over the Hayes 91A/B chronology is common and reflects the changing views of Hayes and his interlocutors.

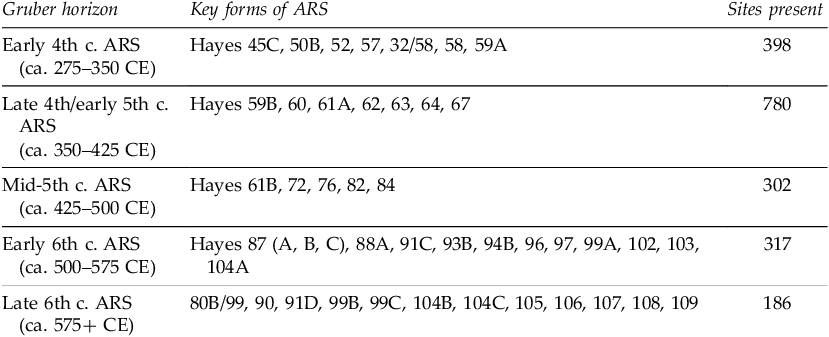
I have constructed a set of five horizons for ARS imports from ca. 300 to 600 CE, which are displayed in Table 6. Each of these import horizons seeks to group together ceramic forms that circulated at more or less the same time, or significantly overlapped, such that sites that contain them can most likely be associated with the networks that dispersed them in different historical periods. These horizons are broad for historians (in the order of decades) but brief for archaeologists (again, in the order of decades). Each horizon represents a 75-year period, but, needless to say, the real-life periodization they loosely capture is far more complex and could shift. The seriation of forms relies, when possible, on the “key deposits” highlighted in the 2011 Late Roman Fine Wares 1 volume.Footnote 38 The horizons do not include all forms of ceramics but seek to highlight the most important forms, which can mark chronological periods. The controverted Hayes 91A/B, for example is not taken to indicate any particular horizon; it most likely circulated ca. 400–500, with possibility of a quarter-century shift earlier, later, or both ways. There are significantly more forms in the later horizons than in the earlier horizons. This is because the horizons have been constructed to capture as many examples of late ceramics as possible. These later imports are much rarer, and part of my argument depends on accurately capturing the magnitude of decline; I therefore erred on the side of including more forms in the later horizons, lest a diversity of later forms should obscure continuity.
ARS import horizons. Each horizon seeks to capture a packet of imported ceramics circulating during one 75-year period. These show participation in exchange networks: after, but most likely also during, a given period.

The five import horizons (Table 6) first show a dramatic flourishing over the course of the 4th c., before a series of drops in the centuries that followed. The expansion from the first to the second phase of ARS distribution (ca. 275–350 CE and ca. 350–425 CE respectively) shows the expansion from the C forms to the earliest D forms over the early 4th c. Characteristic early 4th-c. ARS imports are late versions of the Hayes 50 platter, the Hayes 58 dish, and the 59A. The major expansion of ARS occurred over the course of the mid-4th c., as a comparison between the first and second horizons shows. This shift can be conveniently marked by the arrival of two dishes, the Hayes 61A and the Hayes 67. These are the two most common ARS dishes found in Hispania, occurring at 476 and 424 sites respectively. These forms were produced in the late 4th and early 5th c.: the 61A from ca. 325 to 425 and the 67 from 360 to 450.Footnote 39 Removing the Hayes 67 (ca. 360–450) reduces the number of sites in this horizon from 760 to 618, a decrease of 19%. Removing the Hayes 61A lowers it from 760 to 525, a decline of 31%. In both cases, the ca. 350–425 horizon would still be the most common.Footnote 40 The distribution of ARS therefore reached its apogee in Spain in the late 4th or early 5th c.
Fourth-century abundance was followed by a 5th-c. collapse that left the number of sites receiving ARS ca. 425–500 at 302, down 62% (780 to 302) from ca. 350–425, and down 24% (398 to 302) from the early 4th c.Footnote 41 The next horizon, ca. 500–575, is found at almost the same number of sites as the previous horizon: 317, as opposed to 302, for an increase of about 5%. After this period of relative stability – and in some places, as we will see, expansion – another large decrease in the number of sites receiving ARS occurs between the mid- and late 6th-c. horizons (from 317 to 186, a decrease of about 42%). In all cases, the absence of later forms of ARS is interpreted not as the abandonment of a site – although this, in some cases, must certainly have been the case – but rather as that site dropping out of a shrinking exchange network. This decrease represents an economic not a demographic crisis.
The two periods of crisis in ARS imports are the mid-5th and mid-6th c., with declines of 62% and 42%, respectively. The major, sustained decline between the early and late 5th c. likely reflects a combination of slackening demand from Hispania amidst the loss of its own export markets and the disposable income they provided, a contraction in production in Africa linked to the political and military catastrophes experienced by that province from the Vandal invasion of 429 onwards, and disruptions to exchange networks, including the subsidizing force of the annona. We should not overstate the role of strictly military causes; in fact, the most recent studies of ARS production in Africa have shown little impact from the Vandal conquest, positing instead an earlier decline that began around the turn of the 5th c.Footnote 42 The 6th-c. decline, while not as large as the 5th-c. decline (it also started from a lower point), may have had any number of causes: warfare, changing tastes, or the reunification of Africa with the eastern Mediterranean. We should also not overlook the potential impact of the Justinianic or “First Plague” pandemic of bubonic plague, which initially struck the Mediterranean world in 541.Footnote 43 The following study, by region, may favor one or other of these answers.
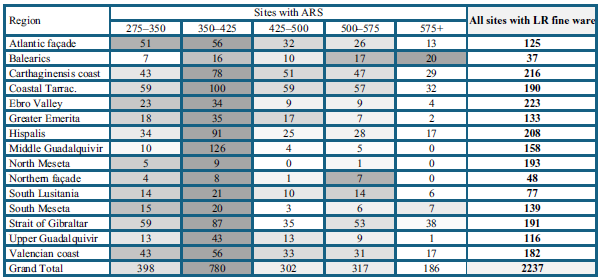
Chronological analysis by region shows differing dynamics between the coast and the interior. Table 7 displays the total number of sites in each region with ARS from a particular horizon. The table cells with the darkest shading represent the period when each region had the most sites with ARS. In almost every region, this is the 350–425 CE horizon. Counting along each row, we can see a dramatic increase in each region between the early and late 4th c., then collapse in the 5th c. The Balearics, not actually part of the peninsula, are the exception that proves the rule. There, it is in the 6th c. that there are the most sites reporting ARS. This was the time when they were part of the Eastern Roman Empire and apparently tightly linked to Africa, to a greater extent than ever before. The regions with the highest numbers of ARS in the late 4th c. are the middle Guadalquivir and the coastal regions from Tarraconensis out through the Straits of Gibraltar as far as Seville (Hispalis). Those regions with the fewest sites with ARS around the year 400 were the northern regions, far from the Mediterranean, and the Balearics. These are for the most part small regions, however, and they reveal the limitations of simply counting sites.
Sites with ARS imports, over five successive time horizons. The darkest shade represents, for each region, the period with the highest number of sites reporting ARS. The apogee of imports in each region except the Balearics is in the period ca. 350–425. The total number of sites in each region with any form of Late Roman fineware (a useful proxy for region size) helps calibrate totals between regions.

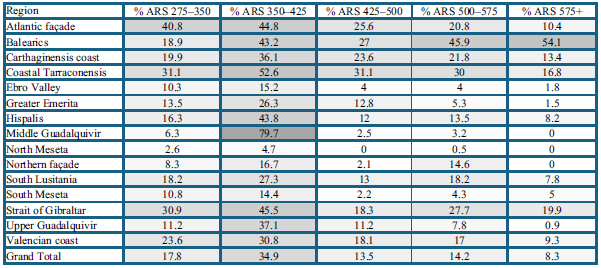
As mentioned above, straight comparisons of regional raw totals do not account for the differing total number of sites in each region. Some regions with few sites reporting ARS were small, like the Balearics or the northern façade; others, like the northern Meseta, were big, but the people who lived there mostly used other finewares. Table 8 shows percentages, as above, but at each temporal horizon. The color-coding extends across the entire table, with the darkest gray marking the intersection of the region and period with the highest density of sites with imports. This allows for comparisons between regions, whereas the raw total data above was mostly useful for comparison within regions over time. For example, a comparison between regions shows that the middle Guadalquivir, the region with the highest total number of sites with ARS imports in the late 4th/early 5th c. at 126, is also the region with the greatest saturation of imports in this period, with 79.7% of sites with any late fineware having ARS from this horizon. The region with the lowest raw number of ARS finds for the period 350–425 is the northern façade, with eight; this represents 17% of sites with late fineware. The region with the second lowest raw total was the northern Meseta, with nine. However, those sites represent just 4.7% of all sites in the region with any Late Roman fineware, showing that people who wanted to live a certain style of Roman life using Roman-style ceramics did not need to rely on imports.
The percentage of sites with any late fineware in each region that has each horizon of ARS. This allows the trans-temporal comparison of ARS penetration by region. Note particularly the saturation of the middle Guadalquivir Valley in the period 350–425 CE, followed by a complete collapse in the percentage of sites with 5th-c. ARS.

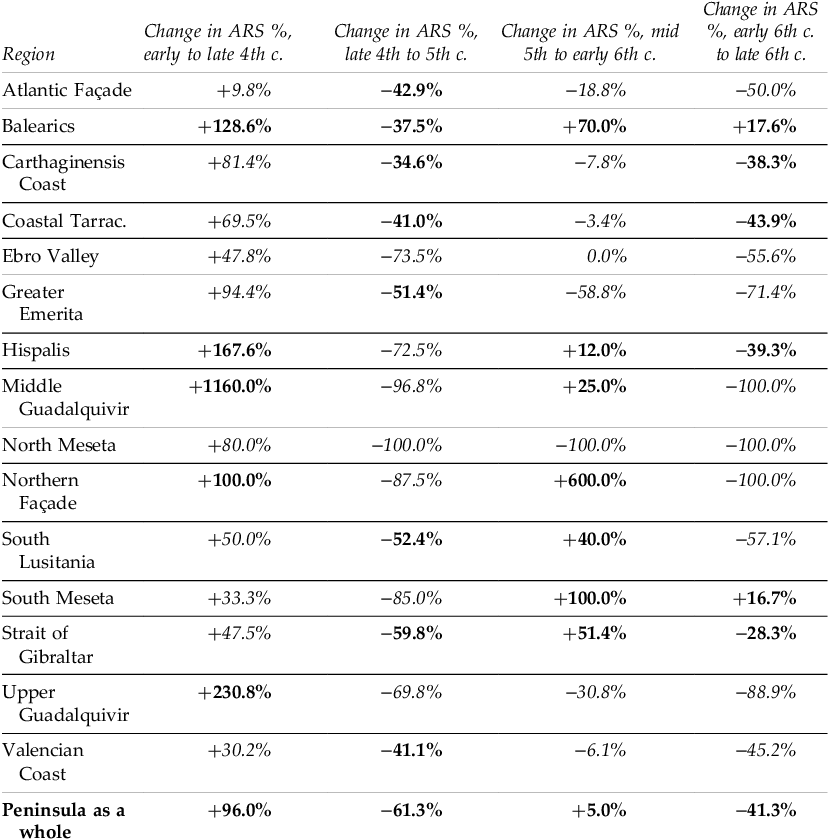
By the end of the 4th c., the presence of ARS had peaked in almost every region. Over the course of the 5th c., as we have seen, ARS imports collapsed by approximately 60% (both in raw numbers and as a percentage of sites). This collapse, however, did not occur uniformly. Table 9 shows the percentage change in the number of sites in each region with ARS from each horizon to the next. This is derived by comparing the percentage of sites with ARS at each time horizon and calculating a percentage increase or decrease. In the table, those regions that either increased more (in periods when the peninsular average was positive) or declined less (in periods when the peninsular average was negative) than the average have numbers marked in bold text; they “overperformed” in comparison to the peninsular average. Those regions that “underperformed” at a certain moment of transition have numbers marked in italics. So, for example, Hispalis, the area immediately surrounding Seville, saw a 167% increase in the number of sites with ARS from the early to the late 4th c., which is a greater increase then the peninsular average; it then had a 72.5% decrease from the late 4th/early 5th c. to the mid/late 5th c., again greater than the peninsular average.
The rate of change of ARS imports. Those regions that outperformed the peninsular average are marked in bold text; those that underperformed are marked in italics. Note that, within the overall collapse between the ca. 350–425 horizon and the 425–500 horizon, there is a comparatively smaller drop-off in the coastal regions (especially the Mediterranean coasts). The decline in ARS in these coastal regions is most prevalent after ca. 500. The Balearic Islands, though similarly affected by the decline ca. 400–450, demonstrate a recovery in the late 5th c. and through the 6th, confirming their important role in the Mediterranean economy after the end of Roman hegemony.

We can map the changes between the ca. 350–425 CE horizon and the ca. 425–500 CE horizon in space in two ways. Figure 7 shows the find spots for each of the four horizons, beginning with the horizon that starts ca. 350. Here, the drop in the prevalence of ARS in the interior regions is particularly clear, with the exception of a small cluster between the Diocesan capital of Mérida and the coast. The decrease is especially obvious in the Ebro Valley, with the only reported ARS from the mid-5th c. or later being at the important city of Zaragoza, halfway up the river valley. However, there was continued importation along the Mediterranean coast. These point-distribution maps make the magnitude of changes hard to compare, especially in those regions where there are significant numbers of sites throughout.
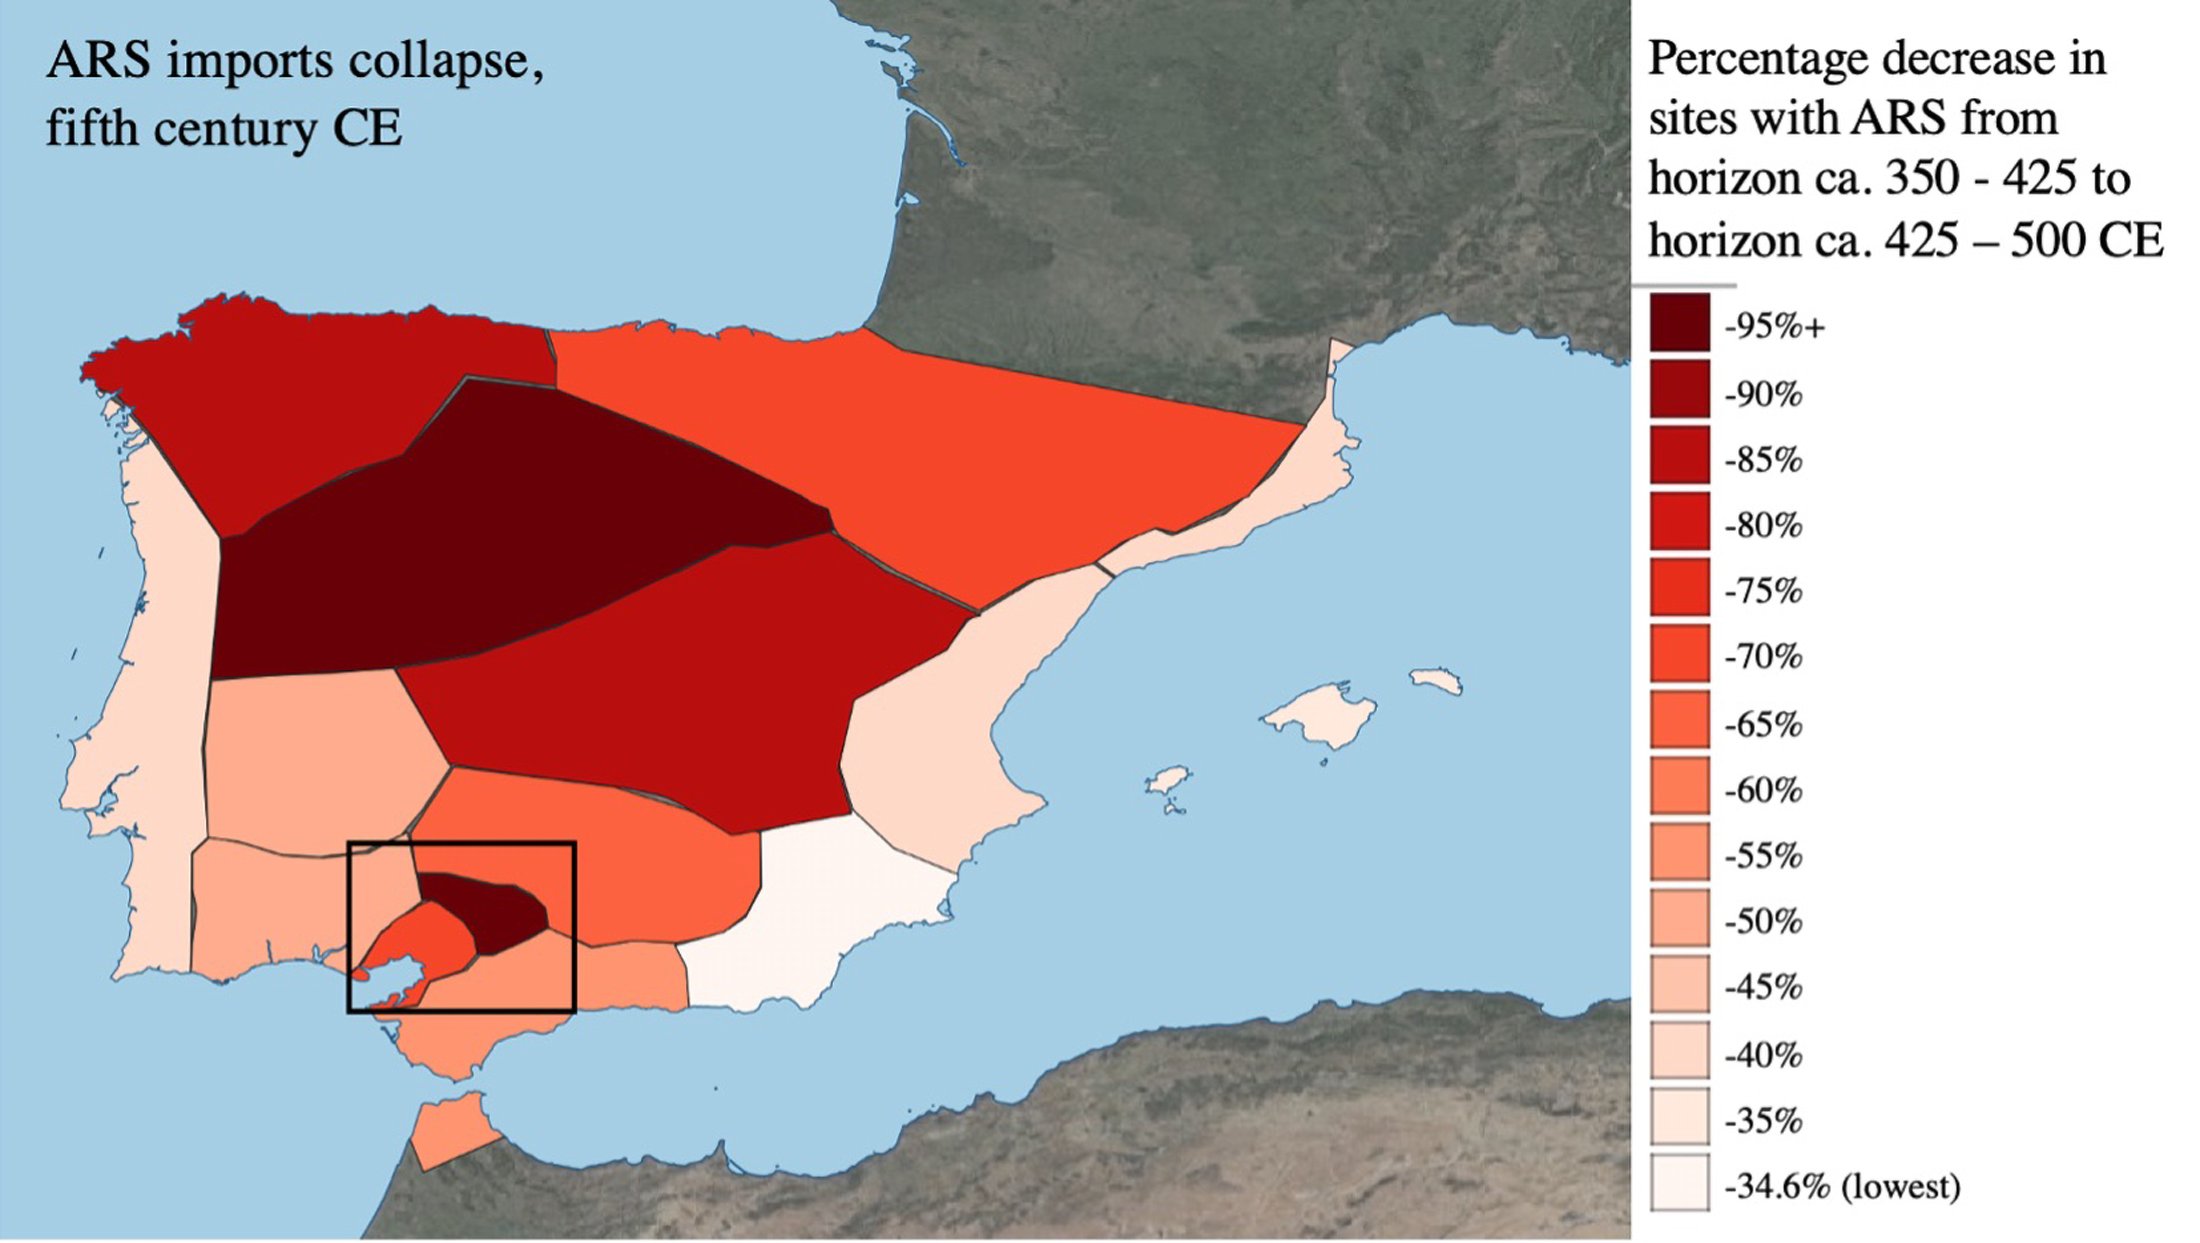
Figure 8 maps the percentage changes in the prevalence of ARS within each region between the ca. 350–425 and the ca. 425–500 CE horizons. The darker the shade, the more severe the drop. The spatial pattern is especially clear: the regions whose trade links with Africa showed above-average resilience from the early to mid-5th c. were the coastlines from Tarraconensis down through the Straits of Gibraltar out to the Atlantic façade, not including Seville or the Guadalquivir. Those regions that saw the greatest comparative decline were the interior regions of the Meseta, the Ebro Valley, and the Guadalquivir Valley (marked with a black rectangle). All three Guadalquivir regions show major contraction, most stunningly in the middle Guadalquivir, a dispersed landscape of olive-producing villas. These seem to be an anomaly given the otherwise straightforward association of proximity to Africa and continued imports of ARS. The next section will therefore look at the Guadalquivir in detail.
Collapse in ARS imports by region. The decline in the percentage of late sites with ARS between the late 4th and mid-5th c., in map form. The darker the shading, the greater the decline. Based on the data in Table 9. Particularly clear here is the outlier represented by the middle Guadalquivir (marked with a black rectangle), which defies the otherwise fairly straightforward link between transport distance from Africa and comparative decline. (Map by the author.)

The cessation of imports to the Guadalquivir
The three regions that comprise the Guadalquivir Valley – Hispalis (Seville), the middle Guadalquivir, and the upper Guadalquivir – all have many more sites receiving ARS in the late 4th c. than in the early 4th c., then rapid decreases between the late 4th and the late 5th c. The middle Guadalquivir has the steepest rise and steepest fall of any region: a 1,160% increase between the ca. 275–350 CE horizon and the ca. 350–425 CE horizon, and a 97% drop between the ca. 350–425 CE horizon and the ca. 425–500 CE horizon. This rise and drop in the Guadalquivir Valley is particularly striking and raises the question of whether there might be some sort of error involved.
The history of investigation in this region is complex. There are primarily four interrelated and, in some cases, mutually dependent sets of sources for the ceramic history of this valley. The first set depends on the surveys carried out by Michel Ponsich and published in four volumes between 1974 and 1991.Footnote 44 Ramón Járrega Domínguez’s Cerámicas finas, which provides the basis for my pre-1991 ARS dataset, translated some of Ponsich’s ceramic finds into Hayes forms.Footnote 45 Third, as part of her 1998 University of Michigan dissertation, which became a 2002 monograph, Vandals to Visigoths, Karen Eva Carr restudied Ponsich’s materials.Footnote 46 My data for the Guadalquivir draws largely from Ponsich and his interpreters, whose data, when analyzed in my chronological scheme, show a major decline in the 5th c.
We can compare this material, derived primarily from Ponsich’s surveys, to an independent fourth source of data, which derives from more recent survey and excavation. In a series of articles and chapters from 2012 and 2013, Enrique García Vargas and collaborators synthesized material for the lower Guadalquivir, focusing on more recent rescue excavations and surveys of the southern bank near Seville.Footnote 47 They have called into question Carr’s conclusions, especially her claims about recovery in the 6th c. drawn from her dating of the Hayes 91 form, but have not questioned her identification of forms or the representativeness of the material collected by Ponsich. Unfortunately, the material of García Vargas and colleagues has not been published in such a way that I could add it to my database. However, we can compare the trends they document to the material I have gathered. As noted above, in a 2012 article García Vargas and Vázquez Paz proposed a set of horizons that differs from mine, and this influences their results.Footnote 48 They show 104 sites in the lower Guadalquivir as “occupied” during the 3rd c., 101 sites “occupied” during the 4th c., then 77 “occupied” in the 5th c. and 28 “occupied” in the 6th c. Their dating scheme, which is by century, differs from mine in its details but shows the same directional trends. The chronology of the specific horizons and forms can be disputed and will likely be refined. I also do not believe that the disappearance of imported ceramics necessarily means a break in the settlement sequence. Whether or not the decline here represents a decline in occupation, or just in access to ceramics, the approximately 75% drop noted by García Vargas and Vázquez Paz between the 4th and 6th c. is similar to the 72.5% drop I find for Hispalis (Seville and its hinterland). It is not as extreme as I find upriver, but their data do not cover the areas with the greatest decline. However, both my results, based largely on Ponsich and on Járrega Domínguez and Carr’s transposition of his results, and García Vargas and Vázquez Paz’s results, derived independently, show a major drop-off in imported ARS at rural sites in the Guadalquivir between ca. 400 and ca. 500 CE.
We can compare the material from these surveys to a few quantified deposits, which are unfortunately quite rare for this region but have the benefit of coming from various points up and down the river. These tend to show a divergent pattern, with imported ceramics still reaching Seville, but not upriver. A large deposit of ARS and other imported ceramics from the Mercado de Encarnación in Seville contained thousands of sherds of imported ceramics from the 3rd through 6th c. (2,582 sherds of table- or cookware, including 1,520 ARS-D).Footnote 49 The most detailed publication of the deposit divides the Late Roman fineware into two broad horizons, ca. 250–450 CE (“Late Roman”) and ca. 450–550 CE (“Late Antique”). There is no material after ca. 550 in the contexts from the Mercado de Encarnación. Based on a series of bar charts, it appears that there are just under 1,000 (rim?) sherds of ARS-D from the period 250–450 CE, and just over 500 from the period 450–550.Footnote 50 The first period covers twice as many years and has twice as many sherds. There is therefore no real indication that the middle of the 5th c. marked a dramatic decrease in ARS imports to the port city of Seville. García Vargas and Vázquez Paz also highlight a series of villas in the immediate hinterland of Seville where the ARS sequence goes into the 6th c.
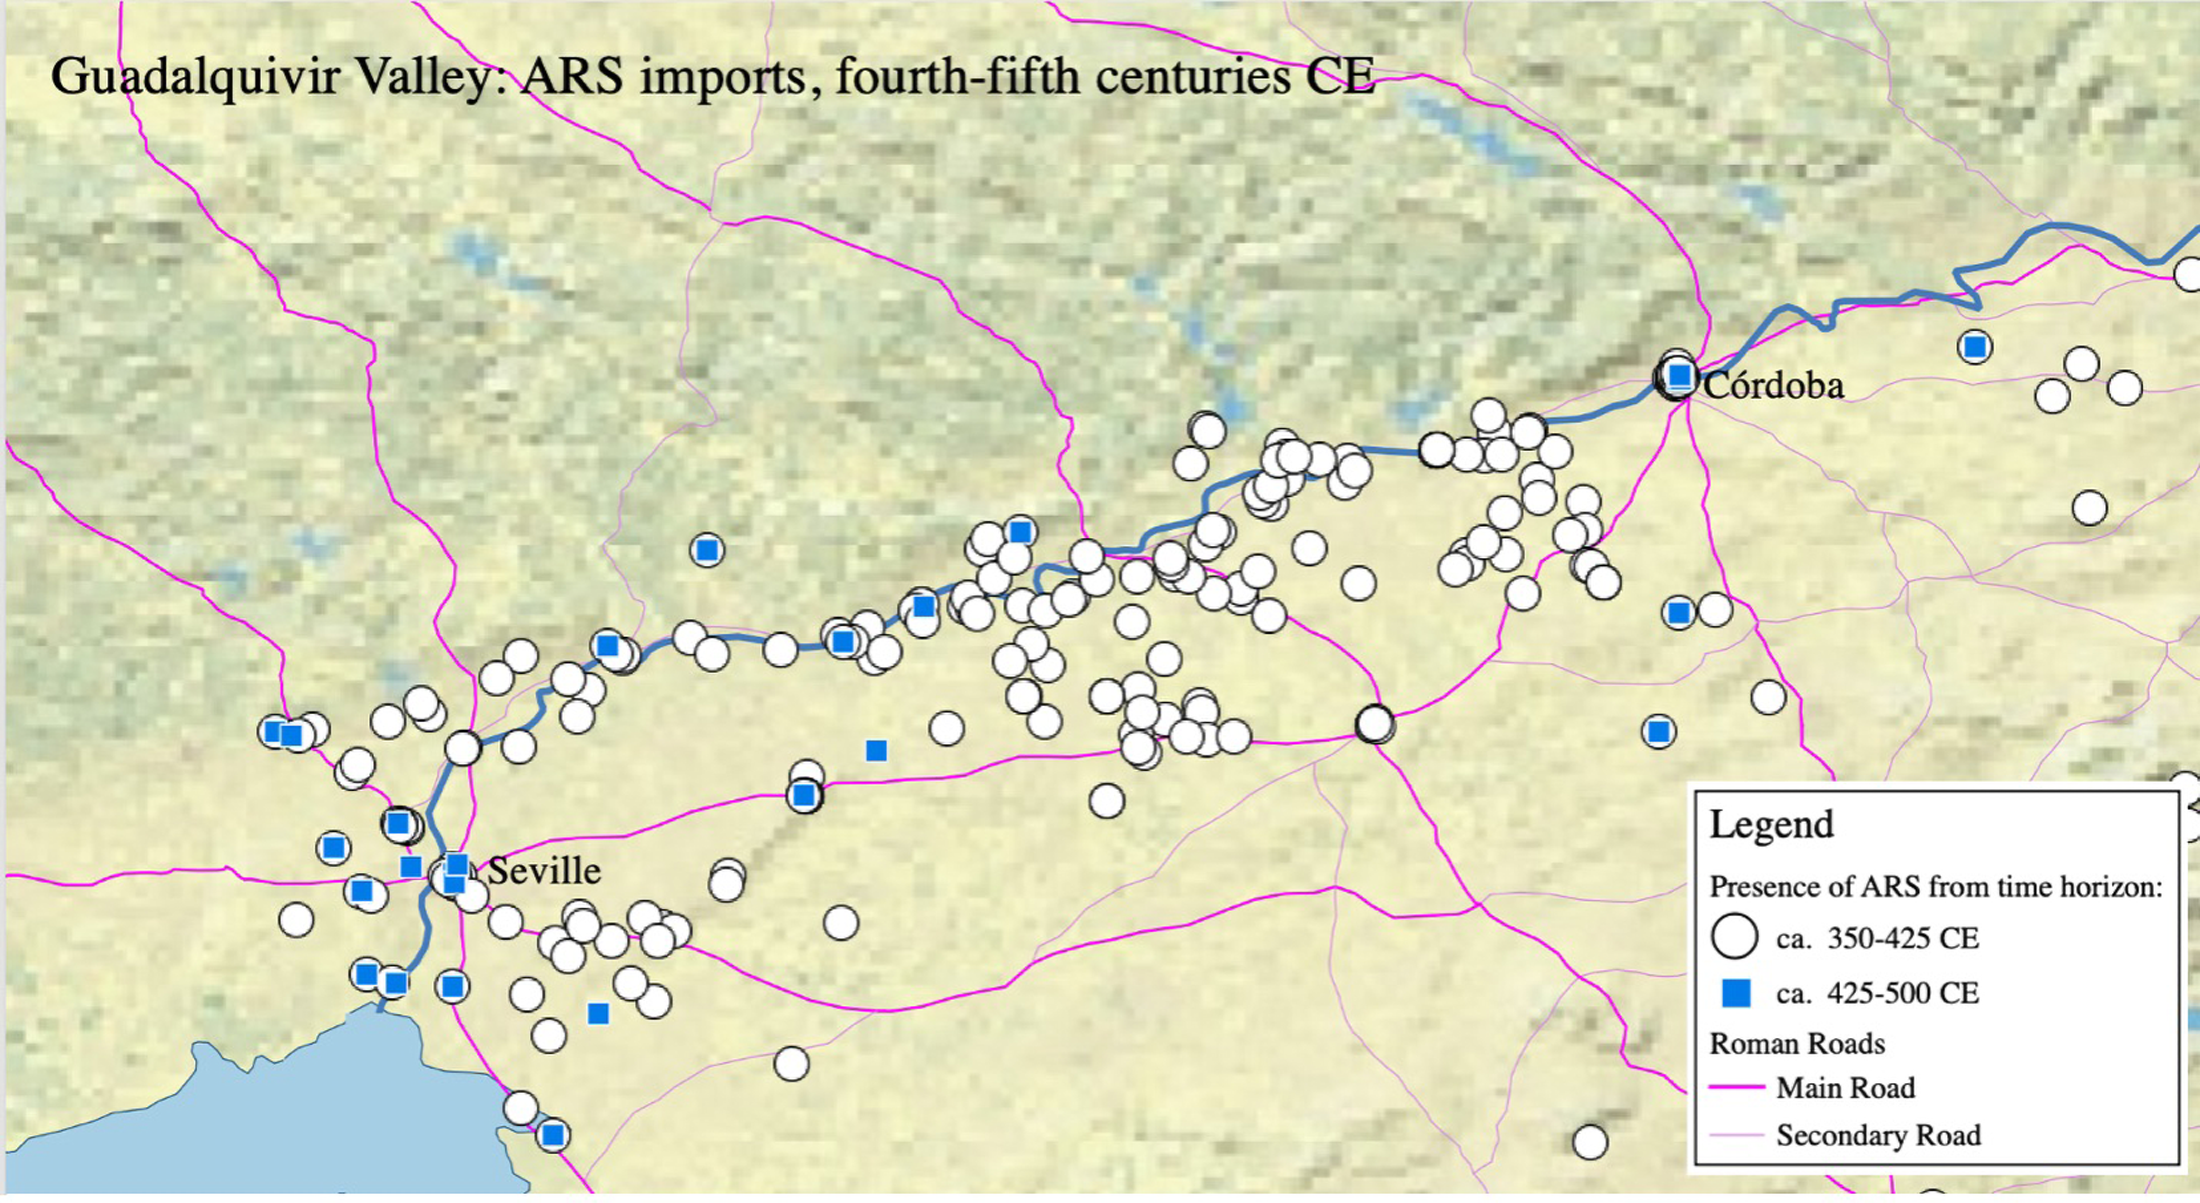
This contrasts greatly with the limited quantified material from other urban sites, especially further upriver towards Córdoba. A 1994 quantification of imports from rescue excavations in Córdoba found that the most common forms were the late 3rd/early 4th c. Hayes 50A dishes, followed by the late 4th/early 5th c. package. There was then a significant drop-off in the 5th c.: 11 sherds of Hayes 61A and just one sherd of Hayes 61B; 18 sherds of Hayes 91A/B and just 2 sherds of Hayes 91C.Footnote 51 An unquantified deposit from a more recently excavated urban context in Córdoba contains ARS forms Hayes 50, 52, 59, 61A, 61B, 67, 73, and 91A/B, the latest of which are mid-5th-c. forms.Footnote 52 At El Ruedo, a villa south of Córdoba whose ceramics have been intensively studied, “the period of greatest importation occurs between the middle of the fourth century and the halfway point, or a little before, of the fifth; the most common forms are ARS-D, forms Hayes 58B, 61A, 59, and 91.”Footnote 53 Juan Alonso de la Sierra Fernández writes that “in Itálica, Orippo, and Córdoba, forms characteristic of the first half of the fifth century were found, in proportions of roughly 39%, 25%, and 23%, respectively, but the few ceramics documented beginning in the middle of the century show us that from this time forward there was an important and irreversible recession that affected the whole lower Guadalquivir.”Footnote 54 This drop-off, and the differential level to which it was felt up and down the river, is shown in Figure 9.
Decreasing prevalence of ARS imports upriver from Seville. In the late 4th c., the dispersed landscape of villas between Seville and Córdoba was well-supplied with ARS (marked by white circles). By the later 5th c., only those sites marked by squares, primarily clustered around the port city of Seville, were receiving ARS imports. (Map by the author.)

Besides the Guadalquivir Valley, the other region with the largest drop-off in ARS imports is the Meseta, the landlocked center of the peninsula. The northern Meseta never imported much African sigillata – ARS is never found, even at its apogee, at more than 5% of sites there. No sites in the northern Meseta have ARS from the 425–500 horizon. The southern Meseta had comparatively more sites with ARS (up to 14% of sites ca. 350–425 CE), but this collapsed to 2% of sites by 500. In a sense, the decrease in sites receiving ARS between ca. 350–425 and ca. 425–500 CE in the north-central part of the peninsula is a reversion to the pattern seen in the distribution of ARS-A and ARS-C; that is to say, the extended reach of ARS-D into the peninsula over the two earlier forms disappeared in the early 5th c. The data at Augusta Emerita (Mérida), the diocesan capital, is similar. A synthesis of earlier excavations at Mérida found an abundance of late 4th-c. ARS: an astonishing 113 sherds of the two most common 4th-c. forms compared with just 4 sherds of the most common 6th-c. forms.Footnote 55 At the 33 urban excavations in Mérida where I have data on ARS, the most common forms are from the late 4th and early 5th c. (the most common forms are the Hayes 61A, at 12 urban sites, the Hayes 59, at 10, and the Hayes 67, at 9). At villas in the hinterland of Mérida, the most common forms of ARS are from the period 375–425 (Hayes 67, found at nine villas, and the Hayes 59 and 61A, each found at six; many sites, as always, do not report individual forms but just fineware types).
Focusing on the southern Meseta, which includes the very well-studied dispersed settlement landscape around modern Madrid, we can see, in the distribution of find sites, a transformation in rural settlement and productive organization across the end of Roman rule. I have identified 282 sites in this region, 90 of which are villas. Half of these villas (45) have reported TSHT. If we take those as the set of Late Roman villas, then 58% of them (16, meaning 29% of the total villas) report ARS-D (all villas with ARS-D also have TSHT). In addition, 8.3% (16) of non-villa rural sites have ARS-D, and 21% (41) have TSHT. By comparison, the broad category “post-Roman commonware” is reported at 17 villas and 76 non-villa sites.Footnote 56 Fineware, and especially imports, are (perhaps predictably) concentrated at villas. One non-villa site, the Camino de Santa Juana, is near a major road and has an exceptional collection of imported goods. It likely represents a ceramic “center of storage and distribution,” giving some indication of the infrastructure by way of which ceramic imports reached the interior.Footnote 57
Although fewer sites report datable ARS, clear trends are apparent: abundant 4th-c. imports, followed by 5th-c. diminution, especially for villas. As for the whole peninsula, the late 4th-c. horizon (Hayes 61A, 67, etc.) is the most common and is found at 10 villas; only two non-villa sites report this horizon. This changed dramatically, however, after ca. 425 CE. Only one site in the whole southern Meseta has ARS from the late 5th-c. horizon. That one villa – the Casa de la Zúa, in Tarazona de la Mancha, Albacete – is an exception that proves the rule, since it is actually much closer to the coast than to the center of the peninsula.Footnote 58 There is a slight resurgence of ARS-D in the southern Meseta in the 6th and into the 7th c. (from one site ca. 425–500 to four sites ca. 500–575, and then down to three sites post 575 CE); none of those sherds was found at villas, or even former villas that were now occupied in some other way. A single Hayes 96 ARS bowl (dated ca. 500–575) appears at the village of Alameda del Señorio de Illescas, where archaeologists have identified approximately 75 underground grain silos and a series of ovens that have returned thermoluminescence dates of 470–650 and 450–630 CE.Footnote 59 This is a post-Roman, “Visigothic” village. The village of Gózquez, where 6th-c. Hayes 99 as well as imported amphoras have been found, shows ties with the Mediterranean world – but not at an old villa site.Footnote 60 Santa María de Melque, with Hayes 105 from the late 6th c., is perhaps the paradigmatic example of a Visigothic-era stone church.Footnote 61 The large fortified hilltop settlement of La Marañosa has a significant collection of imported ceramics (fineware and transport amphora), which may suggest an elite residence; it was not, however, an old Roman villa but rather a newly founded site, typical of post-Roman incastellamento.Footnote 62 None of the sites with 6th-c. or later ARS was or had ever been a villa: there had been a total transformation of the built and social environment of this part of the countryside. Although approximately a third of the Late Roman villas present “post-Roman commonware,” this generally seems to be found in contexts suggesting abandonment, spoliation, or later inhumation. This transformation was well underway by the mid-5th c., and the “Visigothic” villages of the 6th c. seem to bear little relationship to the previous Roman-era settlement hierarchy.Footnote 63
Other wares in the 5th c. and beyond
The data on ARS imports therefore show that the early 5th c. witnessed a major contraction in the networks that distributed ARS. This is particularly visible in the case of ARS because of its well-defined chronological sequence. However, ARS was not the only fineware ceramic being used in Late Roman Spain, and we might wonder whether the decrease in ARS imports shown to have occurred across the peninsula led to, or was associated with, an increase in the production or distribution of its rivals. There is at some sites, in fact, evidence for production of imitation forms of ARS – not new sigillata productions, such as TSHT, but commonware vessels that imitate ARS shapes and their decorations. These generally small-scale productions were “centered in the second half of the fifth century … without conclusive evidence for their existence or not in contexts of the end of the first half of the fifth century … or the early sixth.”Footnote 64 They lasted for a few decades of the 5th c. and indicate supply problems for people who still aspired to using these formerly abundant ceramics.
There is no evidence to suggest that the decline in ARS over the 5th c. was matched by an increase in production of Spanish sigillatas. Many estimates place the end of this industry in the mid-5th c., or at the latest just after 500.Footnote 65 The only possible counterexample seems to be the southern Spanish sigillata (TSHT-M) production centered around Córdoba, which produced pots found in likely “Visigothic” contexts as late as the early 7th c.; this indicates, at the minimum, use well beyond the Roman period.Footnote 66 The decline in the production of Spanish fineware is not a reflection of collapsing interregional trade or connectivity, as TSHT was never imported or traded over long distances. Rather, this must represent the collapse of the local fine ceramic industry due to, or alongside, the end of demand for those ceramics.
There is likewise no evidence for the increased or even continued importation of other types of sigillata to make up for the decrease in ARS and the eventual failure of the TSHT industry. Although the production of DSP in Marseille extends into the 7th c., its importation into Hispania was primarily a 5th-c. phenomenon. The most common form of DSP in Hispania is the Rigoir 1 plate (sometimes differentiated as A or B, but with similar chronologies).Footnote 67 This plate, produced between 400 and 500 CE, was found at 75 sites. The next most common form is the Rigoir 18, a carinated bowl produced between 375 and 500 and found at 56 sites. After that, a series of other dishes are found at between 25 and 35 sites; these are the Rigoir 3, 4, 6, 8, and 15, all of which are dated to 370–500, the main phase of production. Later forms are rarer: the most common possibly 6th-c. form, the Rigoir 29 (perhaps 450–600?), is found at 11 sites. The very late, entirely 6th- or 7th-c. Rigoir 36 is found at just four sites, and almost all other late forms are totally absent (the Rigoir sequence goes, roughly in chronological order, up to 78, with most of the forms after Rigoir’s initial 32 produced only at Marseille).
There is only one Roman-style fineware ceramic whose presence increases after the middle of the 5th c. This is Late Roman C, produced in the eastern Mediterranean from the late 4th c. onward. After the middle of the 5th c., it becomes somewhat common at coastal sites in Hispania. This is not the place to treat the distribution of that ceramic in depth;Footnote 68 however, it will suffice to say that although much LRC reached certain port cities or coastal sites in Hispania, very little penetrated into the interior of the peninsula. Just like ARS in the Guadalquivir, it is found near the coast and near cities linked directly to the coast. The highest concentration of this material occurs in the northwest, at coastal sites like Vigo that seem to have participated in directed trade with Britain until the middle of the 6th c. This does not represent the continuation of Roman trading patterns, but rather something new – and, given the collapse of LRC imports around 550, short-lived. Whatever mechanisms had transported earlier imports across the roads and up the rivers of Spain to the rural settlements and cities of the interior seem, by 450, to have been broken. People were no longer eating their meals off the sigillata platters that had served as everyday luxuries for centuries.
Conclusion
This article has presented geolocated data for the presence and non-presence of fineware (terra sigillata) ceramics at almost 5,000 sites in Roman Hispania. Sigillata ceramics play a particularly important role in interpreting the ancient economy due to their ability to provide both temporal and spatial information, as the generally accepted dates and places of their production, and the reported spots of their archaeological discovery, allow us fixed points from which to infer facts about connectivity. Sigillata is also important, however, as a distinctive class of material culture that was adopted as part of the standard material culture package of the Late Roman Empire. People ate off sigillata dishes, imported or locally produced, to participate in Roman culture. Tracking the end of sigillata production, distribution, imitation, and use can therefore help us move from pots to people.
The evidence collected here suggests three things about the late- and post-Roman world. First, Late Roman Hispania was deeply tied to Mediterranean networks. Those regions closest to the sea or linked to it by rivers (like the Guadalquivir, itself an Atlantic-draining river) were awash with Mediterranean imports, the most typical of which was African Red Slip Ware. Second, the desire to participate in the material culture represented by ARS extended beyond the boundaries to which ARS could efficiently be transported. While there are a few prestigious sites across inland Hispania with small amounts of ARS, the vast majority of sites, and the vast majority of sherds, are from local productions that followed the forms of African imports. The imports and their imitations, which represented a new way of eating not linked to earlier foodways, are found at almost all Roman-style habitations across the peninsula. Third, the end of these ceramics came in spurts. There was an initial 5th-c. breaking point, at which the center of the peninsula lost access to imports, followed within a generation by the end of local productions. This preceded the establishment of the Visigothic kingdom in Iberia, which seems to have expanded, in the late 5th and especially the 6th c., into an area that had already lost all signs of archaeologically visible Romanness. Then, in the middle of the 6th c., those sites along the coast that had continued to import these ceramics ceased those imports. The only exceptions, by the late 6th c., were those coastal towns that comprised the new Byzantine province of Spania. If Roman archaeology is truly delimited by the times and places at which sigillata ceramics are found, then the end of sigillata production and use across Hispania provides a fine-grained measure of the end of Roman Spain.