Introduction
The inherent chemical and structural versatility of minerals of the pyrochlore supergroup and their synthetic analogues results in a broad range of chemical and physical properties, making them relevant for scientific investigations and for diverse technological applications (Fukina et al., Reference Fukina, Belousov and Suleimanov2023, and references therein). One of the most remarkable features of pyrochlore minerals is the three-dimensional tunnel-like structure, capable of accommodating a wide variety of cations as well as water molecules.
The general formula of pyrochlore minerals is A 2–mB 2X 6–wY 1–n, where m, w and n represent structural vacancies. A is an 8-fold coordinated site hosting Na+, Ca2+, K+, Sr2+, Ce3+, U4+, H2O, etc.; B is an octahedral site, usually occupied by high-field-strength elements such as Nb5+, Ta5+, Ti4+, W6+, Sb5+, etc.; X hosts oxygen (occasionally partly substituted by OH–) or fluorine (i.e. in fluornatrocoulsellite, hydrokenoralstonite); lastly, Y can accommodate either water molecules, anions (OH–, F–, O2–), or large cations (K+, Cs+). If Y is fully occupied by large cations, the A position must be vacant due to stereochemical constraints, leading to the so-called ‘inverse pyrochlore’ structure (Ercit et al., Reference Ercit, Černý and Hawthorne1993; Agakhanov et al., Reference Agakhanov, Kasatkin, Britvin, Siidra, Pautov, Pekov and Karpenko2021), which displays the structural formula □B 2X 6Y. The crystal structure (cubic Fd  $\bar 3$m) consists of two interpenetrating networks: (1) a B 2X 6 framework made of corner-linked BX 6 octahedra, and (2) an A 2Y network, analogous to that of anticristobalite-type Cu2O (Vanderah et al., Reference Vanderah, Levin and Lufaso2005). The octahedral framework gives rise to tunnels running along [110], which are occupied by A and Y atoms (Fig. 1).
It is known that pyrochlore minerals that host large amounts of highly mobile species such as water in their tunnel sites exhibit significant ion-exchange properties (Zoppi, Reference Zoppi2004), because water molecules are only weakly bonded to tunnel walls (Ercit et al., Reference Ercit, Hawthorne and Černý1994). In nature, strongly hydrated pyrochlores exist as alteration products of usually anhydrous magmatic pyrochlores, e.g. hydropyrochlore (Ercit et al., Reference Ercit, Hawthorne and Černý1994), hydrokenopyrochlore (Biagioni et al., Reference Biagioni, Meisser, Nestola, Pasero, Robyr, Roth, Schnyder and Gieré2018), and hydrokenomicrolite (Andrade et al., Reference Andrade, Atencio, Chukanov and Ellena2013).
All these considerations have recently driven research towards a promising application in the environmental field: the use of hydropyrochlore and hydrokenopyrochlore, which contain substantial amounts of water, as mineral sinks for hazardous water pollutants like monovalent thallium (Taddei et al., Reference Taddei, Bindi, Lepore, Skogby and Bonazzi2024). The rising concern over increasing thallium pollution, which poses severe environmental and health risks due to its high toxicity and enhanced mobility in aqueous matrices, underlines the importance of pursuing this research. This issue is further exacerbated by the progressive discovery of new and unexpected sources of Tl pollution, e.g. in lithium ores, whose exploitation is necessary for green energy production (Liu et al., Reference Liu, Yuan, Lin, Wang, Sonne and Rinklebe2023). Taddei et al. (Reference Taddei, Bindi, Lepore, Skogby and Bonazzi2024) observed that the structures of hydropyrochlore and hydrokenopyrochlore can incorporate large amounts of Tl+ in a relatively short time (≤ 5 days), with an ion-exchange mechanism involving an aqueous species (either H2O + OH– or H3O+). The present study further investigates this mechanism, focusing on the kinetics of the ion-exchange process. The experiments were carried out using the same starting material, namely hydropyrochlore and hydrokenopyrochlore from the Lueshe carbonatitic deposit (Bwito, Rutshuru Territory, North Kivu, D.R. Congo), with ideal formulae (H2O,□)2Nb2(O,OH)6(H2O) and (□,H2O)2Nb2(O,OH)6(H2O), respectively. Notably, the hydrokenopyrochlore sample used in this study, as well as those investigated by Taddei et al. (Reference Taddei, Bindi, Lepore, Skogby and Bonazzi2024), represent the first occurrence of this mineral at the Lueshe carbonatite. Hydropyrochlore and hydrokenopyrochlore from Lueshe display a partially inverse character, with a unique enrichment in K+ which is fully ordered at Y (Ercit et al., Reference Ercit, Černý and Hawthorne1993, Reference Ercit, Hawthorne and Černý1994). Due to this unusually high K+ content, the mineral was originally named kalipyrochlore (van Wambeke, Reference van Wambeke1978), long before the current nomenclature was approved by IMA-CNMNC (Atencio et al., Reference Atencio, Andrade, Christy, Gieré and Kartashov2010; Atencio, Reference Atencio2021).
The pyrochlore structure as viewed approximately down [110]; drawn using data collected from Hkpcl. Symbols: blue octahedra = B; green spheres = A; red spheres = A’; pink spheres = Y’. The vertices of the octahedra also represent the X site. The unit cell is outlined.

Materials and methods
Electron microprobe analyses (EMPA)
The composition of two small single crystals (Hkpcl and Hpcl) was determined by means of a JEOL JXA-8230 electron microprobe, operated at 10 nA and 15 kV in wavelength-dispersive mode. Counting times were 30 s (Na, Si, Ca, Mn, Fe, Zr, Sn, Sb, Ba, Pb, Th, U, F), 20 s (Ti, Sr, Ta) and 15 s (Al, K, Nb, Ce, La, Tl). Standard materials were fluorite (FKα), albite (NaKα and SiKα), plagioclase (AlKα), sanidine (KKα), diopside (CaKα), ilmenite (TiKα and FeKα), bustamite (MnKα), celestine (SrLα), zirconia (ZrLα), Nb-metal (NbLα), cassiterite (SnLα), Sb-metal (SbLα), baryte (BaLα), monazite (CeLα and LaLα), Ta-metal (TaMα), lorandite (TlMα), crocoite (PbMα), Th-metal (ThMα) and U-metal (UMα). ZAF correction was applied for absorption and matrix effects. An overlap correction factor was calculated and applied for Tl determination, given the interference between TlMα and NbLβ.
Chemical data were normalised on the basis of 2 B cations, with all iron considered as Fe3+. The H2O content was inferred from chemical and structural data. Average values for both crystals are listed in Table 1.
Average microprobe analyses (wt.% oxides) of untreated Hkpcl and Hpcl along with the apfu values normalised on the basis of ΣB = 2

Notes: σ = standard deviation; n = number of analytical points; n.d. = not determined;
* H2O calculated on the basis of the formulae (1) and (3).
Imbibition experiments
The two single crystals were immersed in a solution of thallium(I) formate dissolved in deionised water. The Tl+ concentration used was 1M for Hkpcl and 0.1M for Hpcl. The crystals were soaked for increasing durations (30, 60, 120, 240 and 480 minutes), with cumulative soaking times of 30, 90, 210, 450 and 930 minutes. After the fourth imbibition experiment (240 minutes, or 450 minutes cumulatively), Hpcl fractured and detached from the Kapton loop; only a small fragment (10 × 10 × 5 μm) remained attached to the sample holder, preventing further analysis. Subsequently to the treatments, the crystals underwent a gradual colour change, shifting from colourless to pale yellow, bright orange and eventually to dark brown.
Single-crystal X-ray diffraction (SC-XRD)
Hkpcl and Hpcl were handpicked from the polished mount used for the microprobe study to undergo X-ray diffraction data collection, which was performed using a Bruker D8 Venture diffractometer equipped with a Photon III detector. Data collection was repeated after each imbibition experiment. Unit-cell parameters (Table 2) and intensity data were collected using graphite-monochromatised MoKα radiation (λ = 0.71073 Å); the data were then integrated and corrected for Lorentz-polarization effects and absorption using the APEX5 software suite (Bruker, Reference Bruker2023). Due to the fracture of Hpcl after the 240-minute imbibition experiment, only unit-cell parameters could be obtained using 42 reflections within the range 6.63° < θ < 20.28° (exposure time = 11 s, step size = 1.5°).
Single-crystal X-ray diffraction experimental details and crystal data of Hkpcl and Hpcl before and after each Tl imbibition

Notes: after the 240 minutes long Tl imbibition of Hpcl, the collected unit-cell parameter was a = 10.657(6) Å [V = 1210.3(2) Å3].
Structure refinements
Structure refinements were carried out in the space group Fd  $\bar 3$m (origin choice 2) using SHELXL (Sheldrick, Reference Sheldrick2015). The starting atomic positions were assigned as follows: the A site at Wyckoff position 16d (½, ½, ½), the B site at 16c (0, 0, 0), the Y site at 8b (⅜, ⅜, ⅜) and the X site at 48f (x, ⅛, ⅛). The only free coordinate was that of the X site, initially set to the value reported by Ercit et al. (Reference Ercit, Hawthorne and Černý1994). All refinements were performed under the assumption that the X site is fully occupied by oxygen, while the Nb/Ti ratio at the B site was fixed to that obtained with the EMPA. The refinement procedure followed the approach described by Taddei et al. (Reference Taddei, Bindi, Lepore, Skogby and Bonazzi2024), with some differences between untreated and Tl-treated samples.
For untreated crystals, the occupancy of the A site was fixed to the values obtained from EMPA, without accounting for potential water content. Instead, the latter was assigned to an A’ site displaced to a 32e position nearby A, whose occupancy was refined, with its displacement parameters constrained to be equal to those of A.
Extremely large displacement parameter values, indicating significant positional disorder at 8b and its vicinity, led to the replacement of this site by a slightly displaced one located at a 32e position (Y’), corresponding to the ϕ’’ site identified by Ercit et al. (Reference Ercit, Hawthorne and Černý1994). This adjustment yielded more reasonable displacement parameters. In the models of untreated crystals, Y’ was assumed to host all K⁺ (as determined via microprobe analysis), along with an aqueous species (either H2O or H3O⁺) to complete ¼ of the occupancy of the 32e position.
Scattering curves for neutral atoms were taken from the International Tables for Crystallography (Wilson, Reference Wilson1992) and used as follows: A = Sr vs. □ (untreated crystals) or Tl vs. □ (Tl-treated crystals); A’ = O vs. □ (untreated crystals) or Tl vs. □ (Tl-treated crystals); B = Nb vs. Ti; X = O; Y’ = K vs. O (untreated crystals) or O vs. □ (Tl-treated crystals).
The refinement methods for the Tl-treated samples were the same used for untreated ones, except for the refinement of the occupancies of A, A’, and Y’.
Finally, convergence was achieved by refining anisotropic atomic displacement parameters (ADPs) for all atoms except Y’ (all refinements), A and A’ (Hpcl and Hkpcl_30min refinements), which were refined with isotropic ADPs.
Details of data collection and structural refinements are summarised in Table 2, while bond distances and structural parameters are provided in Table 3. All crystallographic information files are available as supplementary material.
Selected bond distances and structural parameters for Hkpcl and Hpcl, before and after Tl imbibitions

Notes: u. = unshared edge of the octahedron; s. = shared edge between B and A polyhedra; n.e– = number of electrons. Bond angle variance (σ2) was computed according to the formula proposed by Robinson et al. (Reference Robinson, Gibbs and Ribbe1971).
Results and discussion
Crystal-chemistry of the untreated samples
The two studied crystals are almost topologically identical to the samples reported in Taddei et al. (Reference Taddei, Bindi, Lepore, Skogby and Bonazzi2024), which were extracted from the same sample. Minor differences in crystal-chemical features arise from the inherent chemical variability of these species, especially considering that the fragment underwent severe, heterogeneous weathering at the Lueshe carbonatitic deposit (Wall et al., Reference Wall, Williams and Woolley1996; Nasraoui and Bilal, Reference Nasraoui and Bilal2000).
Before the imbibition experiments in Tl-rich solutions, the a-parameter of Hkpcl and Hpcl (Table 2) is comparable to that of other hydropyrochlores from the same locality (van Wambeke, Reference van Wambeke1978; Ercit et al., Reference Ercit, Hawthorne and Černý1994; Taddei et al., Reference Taddei, Bindi, Lepore, Skogby and Bonazzi2024). The B site is dominated by Nb (1.83–1.86 atoms per formula unit), with a partial substitution by Ti (0.14–0.16 apfu) and Fe3+ (0.01 apfu in Hpcl), in agreement with the octahedral distances determined by SC-XRD investigations (Table 3). The dominant A-site cation is Sr (0.17–0.18 apfu), with very minor amounts of Na in both crystals (0.01 apfu) and, in Hkpcl, Ca and Pb (0.01 apfu).
The A’ site in untreated crystals was assumed to mainly host an aqueous species (either H2O or H3O+), accommodating 0.40 apfu in Hkpcl and 1.05 apfu in Hpcl. This assumption is based on stereochemical considerations: in Hkpcl, the A–Y’ distances are too short for stable O–H···O bonds (2.44 Å), whereas the slightly displaced A’ site exhibits a more suitable A’–Y’ distance (2.73 Å) for at least three out of eight possible positions. In Hpcl, the A–Y’ distance is 2.765 Å, representing a reasonable separation for H-bridges; nonetheless, the amount of water hosted at 16d (and its vicinity) is more than double that of Hkpcl.
The Y’ site, slightly displaced around the ideal 8b position, was considered fully occupied by minor K+ (0.10–0.12 apfu) and an aqueous species, assuming a moderately inverse character of the structure (Ercit et al., Reference Ercit, Černý and Hawthorne1993; Reference Ercit, Hawthorne and Černý1994) for this species.
Lastly, a partial substitution of O by (OH)– at X was taken into account to achieve charge neutrality, with the extent of this substitution depending on whether H2O or H3O+ are hosted at the tunnel sites.
Based on the discussed data and the current nomenclature system (Atencio et al., Reference Atencio, Andrade, Christy, Gieré and Kartashov2010; Atencio, Reference Atencio2021), both samples belong to the pyrochlore group, as the B site is dominated by Nb. Specifically, Hkpcl can be classified as a hydrokenopyrochlore, with a vacancy-dominated A site and a water-dominated Y site. Its crystal-chemical formula can be written either considering H2O ( formula 1) or H3O+ (formula 2) at the tunnel sites:
[□1.40(H2O)0.40Sr0.17Na0.01Ca0.01Pb0.01](Nb1.86Ti0.14)[O4.35(OH)1.65][(H2O)0.90K0.10] (1)
[□1.40(H3O)0.40Sr0.17Na0.01Ca0.01Pb0.01](Nb1.86Ti0.14)[O5.65(OH)0.35][(H3O)0.90K0.10] (2)
On the other hand, Hpcl hosts mainly water at both tunnel sites – thus it is a hydropyrochlore. Similarly to Hkpcl, the crystal-chemical formula of Hpcl can be written assuming H2O (formula 3) or mainly H3O+ (formula 4) at A+A’ and Y’:
[(H2O)1.05□0.76Sr0.18Na0.01](Nb1.83Ti0.16Fe0.01)[O4.31(OH)1.69][(H2O)0.88K0.12] (3)
[(H3O)1.05□0.76Sr0.18Na0.01](Nb1.83Ti0.16Fe0.01)O6[(H3O)0.64(H2O)0.24K0.12] (4)
Consequences of Tl+ incorporation and ion-exchange reaction kinetics
The first observable effect of imbibition experiments in Tl-rich solutions is a progressive colour change in the initially colourless crystals. Their colour shifts from colourless to pale yellow, to bright orange and lastly to dark brown as the treatment duration increases. This phenomenon was observed in other studies on natural pyrochlores that incorporated thallium after treatments in various Tl-concentrated solutions (Jäger et al., Reference Jäger, Niggli and van der Veen1959; Harris, Reference Harris1965; Zoppi, Reference Zoppi2004; Bindi et al., Reference Bindi, Petříček, Withers, Zoppi and Bonazzi2006; Taddei et al., Reference Taddei, Bindi, Lepore, Skogby and Bonazzi2024). English et al. (Reference English, Sleight, Fourquet and De Pape1980) described the same colour transition in synthetic pyrochlore-like Nb-compounds, where increasing Tl+ amounts in the crystal lattice induced a colour shift from colourless to light yellow and then to dark brown. These authors suggested that the colouration depends on Tl concentration and is probably related to Tl–Tl interactions.
After just 30 minutes of treatment, Hkpcl and Hpcl exhibit an increase in electron density at both the A+A′ and the Y′ sites (Table 3) caused by the entry of Tl+, as it can be accommodated at A, A′ and/or Y′ (Ercit et al., Reference Ercit, Černý and Hawthorne1993). This increase in electron density is accompanied by a slight lengthening of the A–X, A–Y′, A′–X and A′–Y′ bond lengths (Table 3), leading to an overall expansion of the unit cell (Table 2). Given the large ionic radius of Tl+ (r = 1.59 Å in eight-fold coordination), its incorporation induces an enlargement of both the A site and, consequently, of the unit cell (Taddei et al., Reference Taddei, Bindi, Lepore, Skogby and Bonazzi2024).
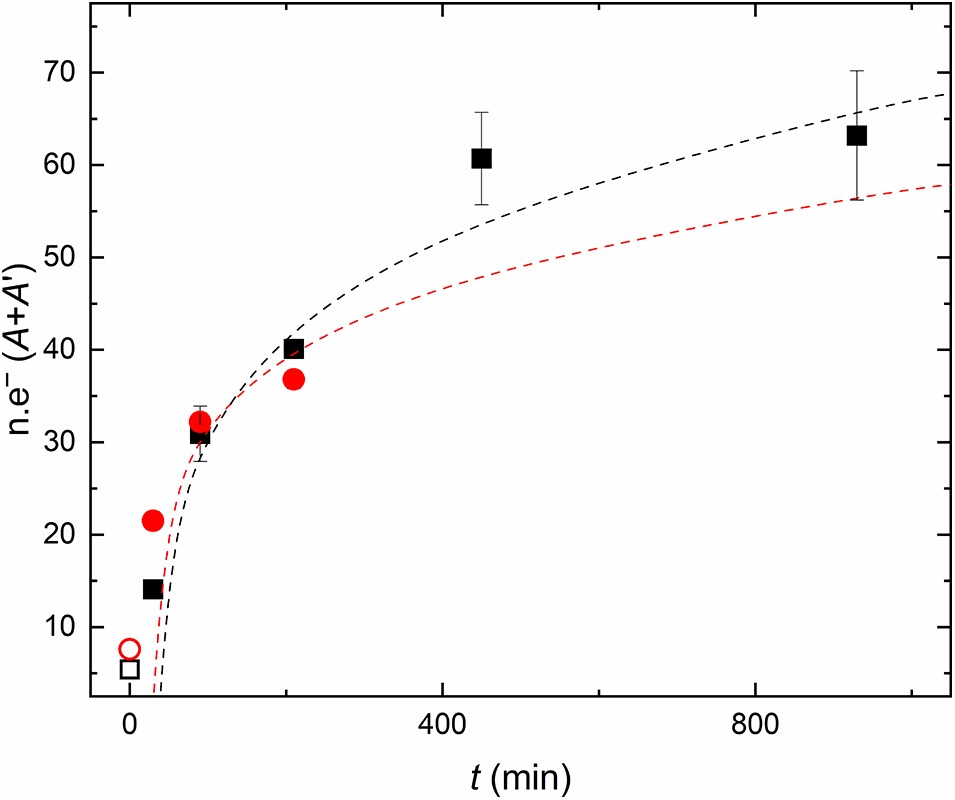
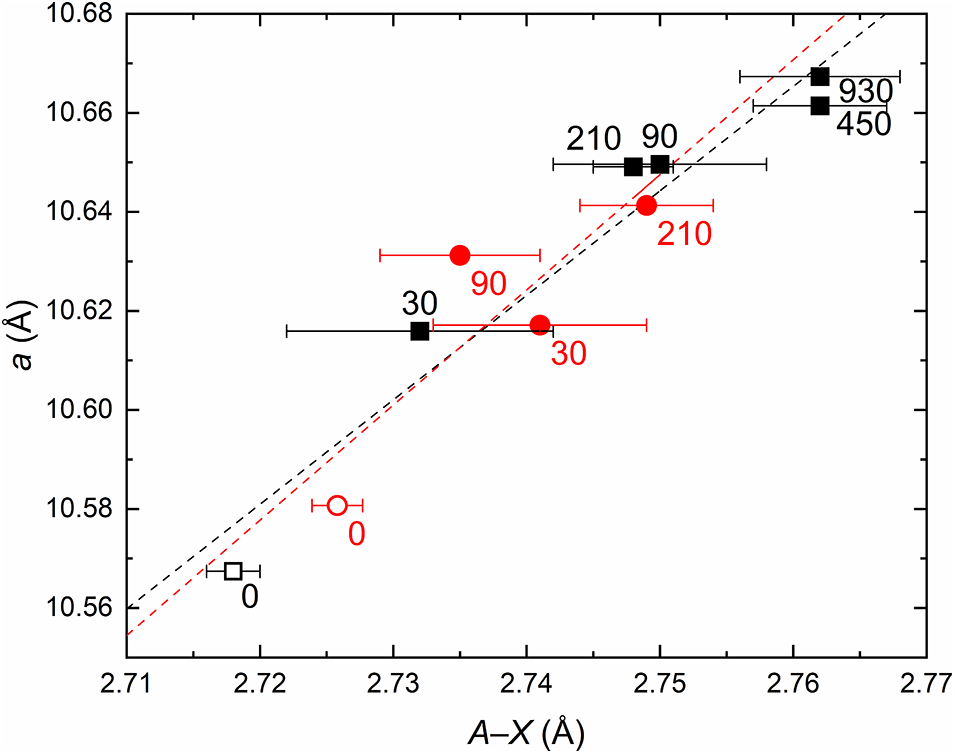
As the number of electrons at A+A’ continues to rise with longer imbibition times (Fig. 2), the A–X bond length also progressively increases in both Hkpcl and Hpcl, resulting in an expansion of the unit cell linearly correlated with the A–X lengthening (Fig. 3). The increase in electron density at A+A’ follows a logarithmic trend, approaching a saturation limit corresponding to the maximum occupancy of available sites for Tl+ within the crystal structure. The upper limit for Tl+ incorporation could be controlled by factors such as the initial water content in the crystals and, more importantly, stereochemical constraints: the A +A′Tl+–Y ′Tl+ interaction would be very unfavourable on electrostatic grounds, thus the coexistence of Tl+ at A+A′ and Y′ is improbable (English et al., Reference English, Sleight, Fourquet and De Pape1980). According to Taddei et al. (Reference Taddei, Bindi, Lepore, Skogby and Bonazzi2024), this limit appears to be reached when the cumulative occupancy of the sites at the 16d position and its surroundings approaches ∼70–75% (∼1.40–1.50 Tl+ pfu), consistently with the present findings (Fig. 2).
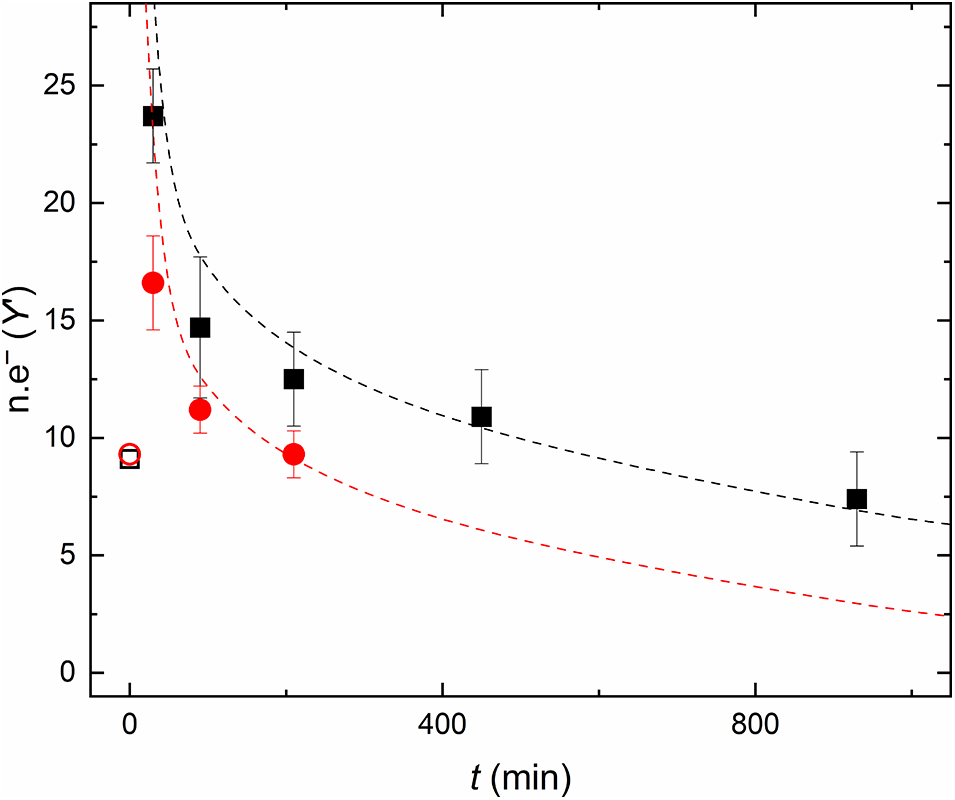
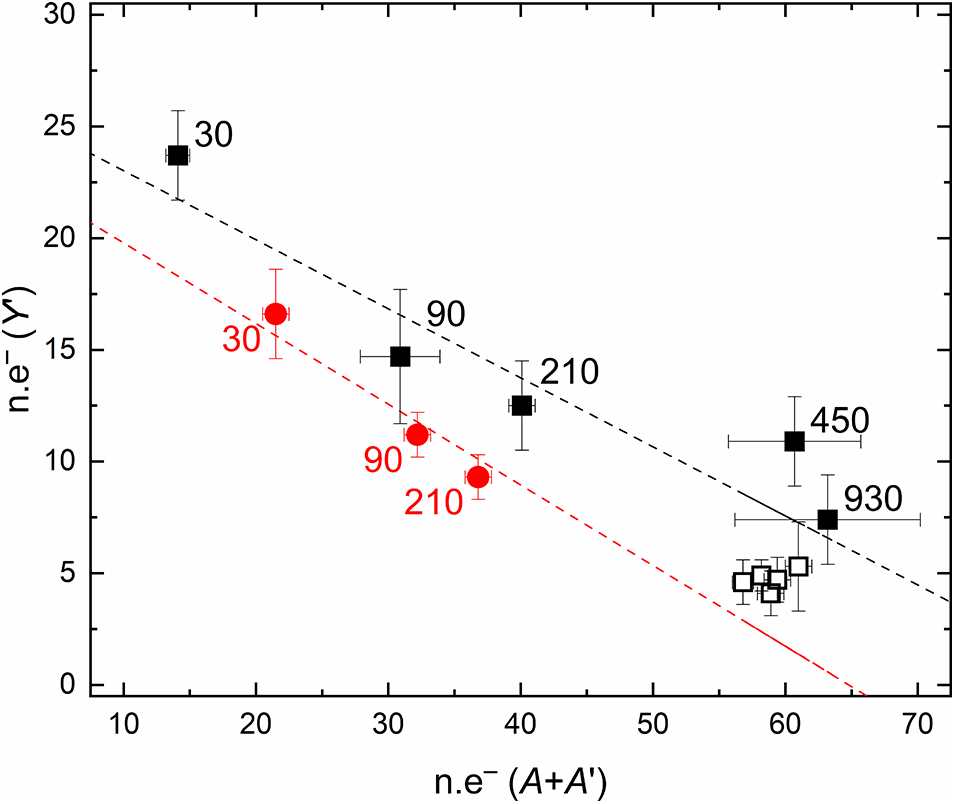
Neither the Y′–X nor the A–Y′ distances exhibit similar correlations, as the x coordinate of the Y′ site can vary considerably, possibly due to positional disorder affecting this site. In the structural model, only one Y′ site was included for the sake of simplicity, but the presence of multiple, slightly displaced sites in the 8b neighbourhood cannot in fact be ruled out (Ercit et al., Reference Ercit, Hawthorne and Černý1994). After the initial increase of electrons at Y′ occurring during the first 30 minutes of treatment, a subsequent logarithmic decrease of electron density occurs for longer imbibition times (≥ 90 minutes; Table 3), as opposed to the trend observed at A+A′ (Fig. 4). Notably, the rate of electron loss at Y′ is slower than the rate of electron gain at A+A′. This trend is in keeping with the progressive ordering of Tl+ at 16d (and its neighbourhood) as it enters the structure: the more thallium is incorporated, the more it preferentially occupies the A+A′ sites at the expense of Y′. A similar behaviour was predicted by Grins et al. (Reference Grins, Nygren and Wallin1980) and English et al. (Reference English, Sleight, Fourquet and De Pape1980) in synthetic K- and Tl+-bearing pyrochlore-like compounds with (Ta,W) or Nb at the octahedral site. These studies underline that tunnel cations with ionic radii in the range 1.50 ≤ r ≤ 1.60 Å (e.g. K, Tl+ in eight-fold coordination) tend to order at A and/or Y depending on the A:B occupancy ratio. At high A:B ratios the normal pyrochlore structure is stable, and (K,Tl) order at the A site; conversely, at low A:B ratios (namely when A is largely vacant), (K,Tl) preferentially occupy the Y′ site, stabilizing the inverse pyrochlore structure. This behaviour is evident in both Hkpcl and Hpcl (Fig. 5): as thallium incorporation increases with longer imbibition times, the A:B ratio rises, leading to a redistribution of Tl+ and/or K+ from Y′ to A+A′. Upon approaching the saturation limit (Hkpcl_450min and Hkpcl_930min), the global number of electrons at (A+A′+Y′) remains approximately the same, while a slight migration of Tl+ and/or K+ from Y′ towards A+A′ is observed.
Number of electrons at A+A’ plotted against time of imbibition. The points of both datasets (Hkpcl = black squares; Hpcl = red circles; empty symbols are untreated samples) are approximated by a logarithmic curve, analogous to a typical kinetic curve for ion-exchange reactions (e.g. Inglezakis, Reference Inglezakis2005, fig. 3). Data collected at t = 0 were not considered for the calculation of the curves. The black dashed line (which fits data from Hkpcl) can be expressed as y = 15.107ln(x) – 37.339 (R 2 = 0.96), while the red dashed line (fitting the Hpcl data) can be expressed as y = 10.681ln(x) – 16.396 (R 2 = 0.98). n.e– = number of electrons. The error bars relative to n.e– (A+A’) that are not visible are contained within the data symbols.

The A–X distance plotted against the unit-cell parameter a (symbols as in Fig. 2; the numbers indicate the duration of imbibition), showing a linear correlation trend. The black dashed line fits Hkpcl data (y = 2.111x + 4.839; R 2 = 0.95), while the red dashed line fits Hpcl data (y = 2.326x + 4.251; R 2 = 0.74). The error bars relative to a that are not visible are contained within the data symbols.

Number of electrons at Y’ plotted against time of imbibition (symbols as in Fig. 2). The curves were calculated similarly to those in Fig. 2. The black dashed line, fitting Hkpcl data, can be expressed as y = –4.383ln(x) + 36.803 (R 2 = 0.93); the red dashed line, which fits Hpcl data, can be expressed as y = –3.912ln(x) + 29.619 (R 2 = 0.99).

The inverse correlation between electrons at A+A’ and those at Y’ is approximated by a linear trend, with the slight differences possibly due to different initial compositions (especially water content). The black dashed line approximates Hkpcl data (y = –0.309x + 26.109; R 2 = 0.85), while the red dashed line fits Hpcl data (y = –0.361x + 23.394; R 2 = 0.98). Symbols as in Fig. 3 except for the black empty squares, which represent data from the treated crystals reported in Taddei et al. (Reference Taddei, Bindi, Lepore, Skogby and Bonazzi2024).

The octahedral bond length also exhibits a slight but significant increase, confirming the trend reported by Taddei et al. (Reference Taddei, Bindi, Lepore, Skogby and Bonazzi2024). The B and A polyhedra share an edge, thus remarkable geometrical modifications occurring at the A polyhedron are expected to produce distortions in the octahedron. In fact, the bond angle variance (σ2) of the octahedron increases with Tl+ incorporation, indicating accordingly greater distortion at B with the entry of Tl+; however, this effect becomes significant only for longer imbibition durations (≥ 450 minutes), when σ2 jumps to 0.53, a value comparable to those observed in Tl-treated hydropyrochlore crystals by Taddei et al. (Reference Taddei, Bindi, Lepore, Skogby and Bonazzi2024). This ‘jump’ never occurs in Hpcl, whose structural data were collected only up to 210 minutes of imbibition, suggesting that substantial octahedral distortion occurs only after the uptake of remarkable amounts of Tl+, nearing the saturation limit.
Despite differences in the Tl concentration of the solutions used for the imbibition experiments, the variations affecting the structural parameters observed in Hkpcl and Hpcl are readily comparable, following analogous trends. This seems to be related to the ‘concentration-valency effect’ described by Pabalan and Bertetti (Reference Pabalan and Bertetti2001) for ion-exchange reactions occurring in natural zeolites. According to these authors, the selectivity of zeolites for a particular ion seems to be independent of the total concentration of the aqueous solution, when the ion-exchange mechanism involves homovalent ions.
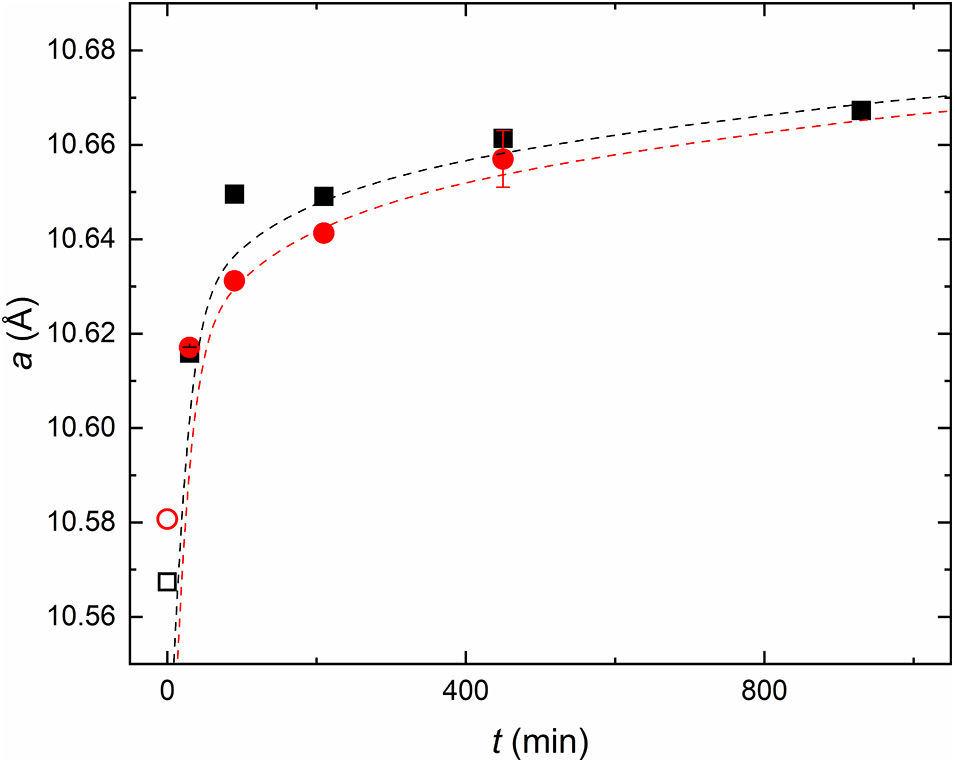
Nevertheless, minor deviations can be observed, such as a slight difference in the rate of Tl incorporation. The crystal soaked in the 1 M Tl solution seems to incorporate thallium more rapidly than the one soaked in the 0.1 M Tl solution (Fig. 2). For Hkpcl, near-complete saturation is reached after just 450 minutes of treatment, whereas no equivalent data are available for Hpcl. However, based on the unit-cell parameter vs. imbibition duration trend (Fig. 6), Hpcl is expected to follow an analogous pattern.
The relative amounts of Tl+ and H+ pfu were tentatively calculated based on the refined number of electrons at the A+A’ and Y’ sites, following the ion-exchange mechanism described by Taddei et al. (Reference Taddei, Bindi, Lepore, Skogby and Bonazzi2024), and assuming that Sr, Na, Ca, Pb and K were not involved in the exchange process. To isolate the contribution of Tl+ and H+, a fixed number of electrons (corresponding to that assigned to Sr, Na, Ca and Pb) was subtracted from the total electrons refined at A+A’. Likewise, the electrons assigned to K+ were subtracted from the total refined at Y’. Tl+ and H+ pfu were then estimated from the remaining number of electrons at each site. According to this method, the calculated bulk Tl+ content confirms a progressive increase with soaking time. For sample Hkpcl, it reached 0.44 apfu (~22 wt.% Tl2O) after 30 minutes, 0.79 apfu (~35 wt.%) after 90 minutes, 1.02 apfu (~42 wt.%) after 210 minutes, 1.52 apfu (~53 wt.%) after 450, and 1.54 apfu (~53 wt.%) after 930 minutes. For sample Hpcl, the values were 0.48 apfu (~25 wt.%) after 30 minutes, 0.70 (~33 wt.%) apfu after 90 minutes, and 0.80 apfu (~36 wt.%) after 210 minutes; no data are available for longer durations. As previously discussed, the incorporation of these quantities of Tl+ leads to the loss of an equal amount of H+.
Concluding remarks
The increasing concern over thallium pollution stems from the high toxicity and environmental persistence of Tl+, which accumulates in various ecosystems as well as the human body, combined with the discovery of new Tl sources (both geogenic and anthropogenic) highlight the need for effective remediation strategies. Addressing this issue requires the development of waste forms capable of not only securely immobilizing Tl⁺ but also favours its incorporation through efficient reaction kinetics. Concerning the extent of Tl+ incorporation into the structure of hydropyrochlore and hydrokenopyrochlore, all the results are consistent with those presented by Taddei et al. (Reference Taddei, Bindi, Lepore, Skogby and Bonazzi2024), confirming that Tl+ enters the structure at the tunnel sites according to one of the following two ion-exchange reactions, either involving H2O + OH– (formula 5) or H3O+ (formula 6):
A□ + A ′+Y′H2O + XOH− ↔ ATl+ + A ′+Y′□ + XO2− (5)
A□ + A ′+Y′H3O+ + XO2− ↔ ATl+ + A ′+Y′□ + XO2− (6)
Unit-cell parameter a plotted against time of imbibition; Hkpcl and Hpcl show an almost identical behaviour despite the different solutions used for the treatments. Symbols as in Fig. 2. The black dashed line fits Hkpcl data (y = 0.013ln(x) + 10.580; R 2 = 0.90), while the red dashed line approximates Hpcl data (y = 0.0144ln(x) + 10.567; R 2 = 0.99). The error bars relative to a that are not visible are contained within the data symbols.

The data reported in this study are not able to solve the conundrum of whether the hydronium ion is actually present in the structure of natural, weathered pyrochlores, and thus, which of the two ion-exchange mechanisms takes place during the imbibition experiments in the Tl-rich solutions. However, the presented results provide greater depth to the research, with an improved time resolution necessary to shed light on the reaction kinetics. A key finding of this work is that significant Tl+ incorporation occurs within very short timescales: while Taddei et al. (Reference Taddei, Bindi, Lepore, Skogby and Bonazzi2024) performed five days long imbibition experiments in a more concentrated solution, the present results make it safe to assume that ∼450 minutes are sufficient to induce the entry of Tl+ at most of the available sites, regardless of its concentration in solution. Effective Tl-uptake and high incorporation rates suggest that both hydropyrochlore and hydrokenopyrochlore are promising candidates for thallium sequestration, particularly in dynamic environments where rapid immobilization is essential. However, it is important to note that Taddei et al. (Reference Taddei, Bindi, Lepore, Skogby and Bonazzi2024) pointed out the loss of approximately one third of the incorporated Tl after a seven days long imbibition experiment in deionised water, underlining the need for more insight into the factors that might affect the capability of the structure to retain Tl or that could trigger its release, such as the presence of competing cations in solution along with Tl+, temperature and pressure conditions and the pH of the solutions used for the treatments. Therefore, the question of whether pyrochlore minerals are suitable as effective sinks for thallium dispersed in polluted natural or industrial aqueous environments remains open and requires further research.
Supplementary material
The supplementary material for this article can be found at https://doi.org/10.1180/mgm.2025.10123.
Acknowledgements
The authors acknowledge M. Batoni (private collector) for providing the pyrochlore sample. SC-XRD and EMPA data were collected at CRIST (Centro di Servizi di Cristallografia Strutturale) and LaMA (Laboratorio di MicroAnalisi) of the Università degli Studi di Firenze, respectively. The research was funded by the University of Florence, Ateneo project 2024 (PI: Luca Bindi). Thanks are due to the Associate Editor Mike Rumsey and to Jens Najorka as well as two anonymous referees for the comments and suggestions that greatly improved the manuscript.
Competing interests
The authors declare none.