


Introduction
Large-shear boundaries are among the most distinctive visual features of ice sheets. In West Antarctica, narrow lateral shear margins are the hallmark of the fast-flowing Ross ice streams. Enhanced deformation along these margins facilitates plug-like flow within the ice streams. Similarly, the flow of the inland ice sheet is accommodated by large vertical shear in a relatively thin (compared to the full ice thickness) layer of deep ice. Moreover, the depth of maximum deformation rates has been observed in some locations to be well above the bed. Below that large-shear boundary, ice deformation is slow. We draw an analogy between these horizontal and vertical “shear margins”, both of which are important to the stress balance within the flowing ice.
The lateral margins of ice streams have been studied by numerous authors, and their importance to the flow of ice streams is clear. Large shear stresses within ice-stream margins support the majority of the gravitational driving stress, up to 100% on both Whillans Ice Stream (Reference Jackson and KambJackson and Kamb, 1997) and Ice Stream D (Reference Price, Bindschadler, Hulbe and BlankenshipPrice and others,2002). Upstream, in the tributaries that feed ice into the ice-stream onsets, the magnitude of lateral shear is reduced (Reference Price, Bindschadler, Hulbe and BlankenshipPrice and others, 2002), yet distinct shear bands appear in the surface velocity field well upstream of the ice-stream onsets (Reference JoughinJoughin and others, 1999). A relict horizontal shear margin, advecting throughthetrunk of Whillans Ice Stream, has been identified as the cause of anomalous strain rates measured at the surface of the stream (Reference Hulbe and WhillansHulbe and Whillans, 1997).
Pronounced vertical shear layers develop at depth within ice flowing over irregular bedrock topography. The layers contain ice with a strong single-maximum c-axis fabric and develop over time due to the large shear strain at depth (Reference Russell-Head and BuddRussell-Head and Budd, 1979; Reference Li, Jacka and BuddLi and others, 1996; Reference Morgan, van Ommen, Elcheikh and LiMorgan and others, 1998). The fabric enhances deformation. Below the depth of maximum shear, annealing occurs and a multi-maximum fabric develops. The deep ice is relatively stiff and deforms more slowly than the overlying ice. The boundary between these two regions is analogous to the outer boundary of a horizontal (ice-stream) shear margin. Correct identification of these vertical shear margins is important to numerical simulation of ice-sheet flow for such purposes as assigning ages to internal layers and investigating past flow variability (Wang and others, in press). Vertical shear layers may also be studied for their effect on ice-sheet flow. The layers serve to separate the overlying ice from obstructions that would otherwise impede its flow. Just as lateral shear bands accommodate the gravitational driving stress in the ice streams, vertical shear margins must balance the driving stress in regions where they isolate fast-flowing ice from the bed.
The properties of shear layers have received little attention in studies of the upstream origin of West Antarctic ice streams. It is usually assumed that the transition from basal to lateral control, which defines the ice-stream onset, is due to a transition in bed properties alone. That is, the transition is largely external to the flowing ice. In the present contribution, the perspective is changed. Enhanced shear, both lateral and vertical, is considered as a precursor to ice-stream flow. We conclude that vertical shear layers can play a significant role in the onset of fast ice-stream flow. The role of lateral shear is less clear.
Ice Stream D
Ice Stream D is one of five fast-flowing streams through whichWest Antarctic ice drains from the inland catchment to the Ross Sea. In plan view, each ice-stream drainage system is a network of tributaries that coalesce upstream of a faster-flowing ice-stream trunk. Tributary speeds range from a few tens of m a–1 to about 100 m a–1 at the ice-stream onset. In some areas the lateral boundaries between slow-and fast-flowing ice are sharp, as along Ice Stream D’s southern margin. In other locations, the transition is more diffuse, as along the stream’s northern margin and in a complicated tributary structure that supplies ice to both Ice Streams D and E (Fig. 1; Reference JoughinJoughin and others, 1999).
the ross ice streams and tributaries. the sar-derived surface speed color map is plotted over the radarsat-1 antarctic mapping project (ramp) radar mosaic. the speed color bar is logarithmic, and arrows indicate the flow direction. the ice stream d particle paths used in the present models are plotted in black. heavier black lines denote trajectories simulated by the flowline model. the dashed path is labeled d6 in figure 3. byrd station is at about 80° s, 120° w. the onset of ice-stream flow correlates to aspeed threshold of about 100 ma1.

Ice Stream D’s flow appears to have been relatively constant over at least the last several millennia. Surface elevation at the Byrd borehole site, upstream of Ice Stream D, has changed by <100m since the Last Glacial Maximum (Reference Steig, Alley and BindschadlerSteig and others, 2001). Analysis of internal layers observed by radio-echo sounding (RES) along the Byrd Station Strain Network (BSSN) also indicates steady flow in the region (Reference WhillansWhillans,1976). Siple Dome, which rises between the downstream trunks of Ice Stream D and the now-stagnant Ice Stream C, isapersistent feature, implying that ice on both its flanks has been relatively thin and fast-flowing for millennia (Reference NeresonNereson,1998). This relative steady state simplifies model simulation of strain-dependent changes in ice properties, which develop over hundreds to thousands of years.
Recent analyses of the transition from inland to ice-stream flow have emphasized the interface between the ice and the bed over which it flows. Ice-thickness and surface-velocity measurements have been used together with simple estimates of ice temperature to demonstrate the importance of bed shape to the broad pattern of tributary flow leading to Ice Streams D and E (Reference Hulbe, Joughin, Morse and BindschadlerHulbe and others, 2000). A strain grid installed on the ice-sheet surface was used in a detailed study of stress gradients in the transition from tributary to ice-stream flow at the main onset to Ice Stream D (Reference Price, Bindschadler, Hulbe and BlankenshipPrice and others, 2002 ).Their force-budget analysis showed clearly that the dynamic transition at the ice-stream onset is from large basal shear and small lateral drag within the ice to small basal shear and large lateral drag. That change was interpreted to represent a change in ice–bed interaction, due perhaps to a change in basal meltwater supply or in the strength of subglacial sediments. These studies conform with the general understanding of ice-stream onset dynamics, in both the nature of the change and its underlying cause (cf. Reference Alley, Bindschadler, Alley and BindschadlerAlley and Bindschadler 2001).
Observations and Model Domains
The onset to Ice Stream D is one of the more intensely observed flow transitions in Antarctica, and the present contribution draws on data from many sources. Surface velocity over the broad region has been mapped using RADARSAT synthetic aperture radar interferometry (InSAR) and the Ice Stream D onset strain-grid displacements (Reference Chen, Bindschadler and VornbergerChen and others, 1998; Reference JoughinJoughin and others, 1999). Strain rates are computed using centered differences on a 1km grid. Bed elevation and ice thickness from the BEDMAP project (BAS, 2001) form the foundation of our geographic dataset. Higher-resolution measurements of surface elevation and ice thickness made by the Corridor Aerogeophysics of the South East Ross Transect Zone (CASERTZ) project (Reference Blankenship, Alley and BindschadlerBlankenship and others, 2001) augment the dataset where they are available. The surface ice-accumulation rate is specified using present-day observed accumulation rates compiled by the British Antarctic Survey (Reference Vaughan, Bamber, Giovinetto, Russell and CooperVaughan and others, 1999). The ice-surface temperature derives from observed infrared temperature (Reference ComisoComiso, 1994), and the depth variation of temperature is initialized using Byrd Station borehole measurements (data given in Reference Robin and RobinRobin, 1983). Ice-internal layers, used to validate the flowline model, were observed by ice-penetrating RES surveys conducted in the mid-1970s(Reference RoseRose,1978,Reference Rose1979; the surveys were supported by the Scott Polar Research Institute, the U.S. National Science Foundation and the Technical University of Denmark). The original RES data are converted from analog to digital format for this and other studies (cf. Siegert andothers, in press).
Our calculations are made along a suite of particle paths that converge toward Ice Stream D (Fig. 1). The paths are selected to represent a range of possible flow histories for ice entering the stream. They are computed according to the surface velocity azimuth and follow the downslope direction within the resolution and accuracy of the datasets. Machine-selected particle paths are not unique (cf. Reference Price and WhillansPrice and Whillans, 1998) but do represent typical flow trajectories in the catchment basin. Two of the particle paths, labeled D1 and D2 in Figure 1, are selected for the anisotropic ice-flow model. Bed elevation along the two paths is smoothed to reduce noise in the model. D1 passes within several km of the Byrd Station borehole. A downstream end of one of the BSSN RES flight-lines is nearly coincident with the upstream end of the D1path and is used to validate the model calculations. D2 extends down the main Ice Stream D tributary and ends a few km downstream from the onset. No internal observations are available along this particle path, although one RESflight-line parallels the tributary to its south.
Shear Layers
Shear strain rotates ice crystals and warms ice by viscous dissipation. We hypothesize that these effects may be an important precursor to fast ice-stream flow and evaluate that thesis using two computational approaches. The contribution of vertical shear to tributary flow is considered using a flowline model that embodies fabric development in an enhancement factor to the flow law. Lateral shear is studied as a Lagrangian problem, using high-resolution measurements of surface velocity and an estimate of the flow-law rate factor derived from the flowline model.
Vertical shear
The flowline model simulates the effects of anisotropy on the deformation of glacier ice (Reference Wang and WarnerWang and Warner, 1999). Constrained by observations along the flowline, the model predicts a maximum-shear depth, at which the ice has a strong single-maximum c-axis fabric. Below this nearly continuous vertical shear margin, ice flow is restricted by large-scale bed roughness such that effective shear stresses and strain rates are reduced. Above the maximum-shear layer, flow is largely undisturbed by irregularities in the bedrock.
The anisotropic flowline model is introduced briefly here. Details can be found in Reference Wang and WarnerWang and Warner (1999). As is typical of most ice-sheet models, the laminar flow approximation is made, so that along any flowline, compression in the vertical direction,
 and the vertical shear,
 , are the only relevant strain rates (Reference PatersonPaterson, 1994). As can be seen in the horizontal shear analysis, this is a reasonable assumption along the D1 and D2 particle paths. The usual constitutive relationship between stress and strain is amended to include anisotropic effects by the introduction of an enhancement factor that is the ratio of the tertiary strain rate for anisotropic ice to the minimum strain rate for isotropic ice:


where
 represents the strain rate and τ represents the deviatoric stress, with the subscripts xz and zz denoting shear and compressive components, respectively, in a Cartesian coordinate system with z the vertical coordinate. A0(T) represents the usual temperature-dependent rate factor, τo represents the octahedral shear stress, and the quantities G(λc ) and f(λc are enhancement factors for shear and compression. λc i a compression factor, defined:

Laboratory experiments (Reference Li, Jacka and BuddLi and others, 1996) show that the enhancement factor can be simplified into a single quantity:
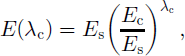
where es and ec are shear and compression factors alone.
Replacing the shear stress terms from Equation (1), a cubic equation for the vertical shear strain rate is derived:

 is computed from the horizontal strain rates, assuming incompressibility The enhanced rate factor, e(λc)a0(t), is of particular interest here.
The anisotropic relationship between stress and strain is solved iteratively, assuming steady-state flow along the selected particle path. The flowline domain is discretized into 100 equally spaced vertical layers using a contour-following vertical coordinate. Measured ice thickness and bed elevation, and surface velocity, accumulation rate and temperature guide the iteration. The depth variation of ice temperature is initialized using the Byrd Station borehole temperature. Ice flow due to sliding over the bed is not included in the present implementation of the model. The implications of this omission are discussed below.
The solution method assumes steady-state ice-sheet flow. This assumption is reasonable, according to a range of observational datasets. Its validity can also be evaluated by comparison of modeled and observed internal layers (Fig. 2). The model-simulated and observed layers agree in general, though detail is lost in the model due to smoothing of the bedrock surface.
Comparison of internal layers digitized from airborne RES surveys with those produced by the anisotropic flowline model along the D1 trajectory. Ages of the simulated layers are recorded.

As for any non-linear flow law, shear strain-rate gradients within the simulated ice sheet are small through most of the ice thickness and grow large near the base of the ice sheet. The effect of the anisotropic flow-law formulation is to modulate the depth at which maximum shear strain rates are achieved. The depth variation is presented in terms of depth variation in the enhanced rate factor, e(λc)a0(t) (Fig. 3).
Observed and mod el-simulated quantities along three particle paths.The anisotropic flow-law rate factor, computed for the D1 and D2 trajectories, is contoured within profiles of surface and bed elevation. The rate-factor contour interval is 0.1 a–1 bar–3, the minimum contour value is 0.1 a–1 bar–3 and maximum values are about 1.6 a–1 bar–3 (warm colors represent larger rate factors).The heavier black contour indicates the depth of maximum shear strain rates. The relatively thin, bounded layer of large vertical shear (close contour spacing) is analogous to the lateral shear margins of the ice streams. Surface speed and cumulative warming (including both viscous heating and diffusive cooling) are plotted along the D1, D2 and D6 profiles. Of all the trajectories considered, ice along D6 remains within a lateral shear margin for the greatest distance. Cumulative error in the viscous heating calculation is plotted as short dashed lines. The D6 trajectory emerges from greater depth, but in other regards the (omitted) thickness profile is similar to the D1and D2 paths.

Lateral shear
Across-flow variations in the downstream motion of large ice masses are small enough to be neglected in most stress-balance formulations (cf. Reference PatersonPaterson, 1994). The lateral margins of the West Antarctic ice streams are a striking exception to that condition. The narrow across-flow transitions from relatively slow to relatively fast flow correspond primarily to a jump in basal slip and secondarily to a change in bed elevation (Reference Raymond, Echelmeyer, Whillans, Doake, Alley and BindschadlerRaymond, and others, 2001). Upstream, in the tributary system, margins appear to arise initially from changes in bed elevation (at the edges of deep subglacial valleys) and to evolve with distance downstream (cf. Reference Price, Bindschadler, Hulbe and BlankenshipPrice and others, 2002).
The across-flow gradient in downstream velocity, that is, the horizontal shear strain rate, dissipates gravitational energy. That viscous dissipation warms, and thereby softens, the ice. In the downstream margins of ice streams, shear strain rates, and thus energy dissipation rates, are quite large (Reference Echelmeyer, Harrison, Larsen and MitchellEchelmeyer, and others, 1994; Reference Raymond, Echelmeyer, Whillans, Doake, Alley and BindschadlerRaymond, and others, 2001). Reference Raymond, Echelmeyer, Whillans, Doake, Alley and BindschadlerRaymond and others’ (2001) theoretical analysis of margin stability produces strain heating rates as large as 0.3 mWm–3 . Net warming of the ice by viscous dissipation depends on the residence time of ice within the large-shear margin, and on the cooling effects of vertical advection and diffusion and on the pooling of cold air in surface crevasses (Reference Harrison, Echelmeyer and LarsenHarrison and others, 1998; Reference Raymond, Echelmeyer, Whillans, Doake, Alley and BindschadlerRaymond and others, 2001).
Shear strain also rotates ice crystals. The effect of that rotation is significant in the vertical direction, as discussed above. Reports of its effect in the horizontal direction are contradictory. Laboratory study and numerical simulation suggests that ice-crystal c axes should rotate to align perpendicular to the plane of dominant shear (cf. Reference Van der Veen and WhillansVan der Veen and Whillans, 1994). Large shear near the Sør-Rondane Mountains, East Antarctica, produces an ice fabric with c axes aligned but oriented about 45° from the flow direction (Reference Fujita and MaeFujita and Mae, 1994). Reference Jackson and KambJackson and Kamb (1997) conclude that no significant flow enhancement would result from the fabrics they observed in ice samples from a margin of Whillans Ice Stream, while Reference Hulbe and WhillansHulbe and Whillans (1997) found circumstantial evidence of relict c-axis alignment in a band of ice within the same ice stream. I n much of the present study area, horizontal shear strain rates are an order of magnitude or more smaller than areas where shear is anticipated to produce special fabrics, so we do not pursue this topic here.
Lateral shear in the inland ice sheet is treated as a Lagrangian problem. The histories of individual parcels of ice are simulated using gridded (1km) InSAR surface velocity measurements and principal strain rates derived from them. Making the assumption that horizontal temperature gradients are very small, steady-state heat balance along a particle path is described by the advective–diffusive expression:
in which the first term on the left represents vertical diffusion of temperature T, the second term accounts for advection with vertical velocity w, the third term represents downstream advection, and the fourth term is the viscous heating due to across-flow shear in a flow-following (l; t; z) coordinate system.

Our interest is in the downstream warming of ice, ∂t/∂x l, due to viscous dissipation of gravitational energy. The warming at any depth z is expressed:

in which the flow-law rate factor relating the observed strain rates to shear stresses derives from the flowline model. As can be anticipated from the rate-factor panels in Figure 3, simulated heating with and without downstream variation in this quantity are nearly identical along these limited model domains. A value of 6.63 6 107 W m–1 K – 1 is used for the thermal conductivity k, and the volumetric heat capacity p c is 1.83 6 106J K–1 m–3.
The depth variation of most terms in Equation (7) is not well known in most of the study area. However, the flowline model can be used as a guide in this regard. A depth-integrated approximation of Equation (7) is adopted in which the depth variation of ea0 (Equation (5)) is used as a guide and ∂2t/∂z2 is a mean value from the Byrd Station borehole. The expression for strain heating along a particle path is then discretized into a set of coupled equations for dt/dxl and dxl/dt, where t represents time. Measurement errors are propagated through this formulation of the problem using error estimates reported for the various data sources. A comprehensive discussion of the error budget in a similar calculation is offered by Reference Price, Bindschadler, Hulbe and BlankenshipPrice and others (2002). The largest uncertainty is in our knowledge of the flow-law rate factor. We assume a 30% error in its estimation, but its effecton the overall budget of forces is small. A typical error in dT at any xl is about 3×10⁻⁴ K.
Cumulative warming and errors along the D1, D2 and D6 particle paths are plotted in Figure 3. The simulated temperature change is modest, typically no larger than 0.5 K over the course of a particle path (4–5 kyr). Mild diffusional cooling dominates the calculation along D1and D2 until the trajectories enter the main tributary channel. Along D6, ice warms where the trajectory enters the tributary’s southern lateral margin. The warming persists as the trajectory remains within the margin for an extended distance. The plan-view representation of warming demonstrates two other dT/dxl patterns (Fig. 4). Where ice remains outside the main tributary channel, gradual warming persists. Where ice passes through the onset or a lateral margin, a brief warming is followed by no significant additional warming.
Strain heating along particle paths, plotted over tours of surface speed. Color changes along the paths represent dT thresholds in increments of 0.1 K: magenta represents <0.1K and the spectrum proceeds through blue, cyan, and yellow, to red representing 40.5 K cumulative warming, as indicated in the figure legend. The contour interval for speed is 10 m a–1from 10 to 100, and 50 m a–1thereafter.

Discussion
The onset of fast ice-stream flow coincides with a transition from a relatively roughto a relatively smooth bedrock topography (Reference JoughinJoughin and others, 1999; Reference Blankenship, Alley and BindschadlerBlankenship and others, 2001), although tributary flow begins well upstream of that transition. In many locations, tributary speeds are too fast to be accounted for by the usual isotropic flow law, without invoking large basal sliding (Reference Hulbe, Joughin, Morse and BindschadlerHulbe, and others, 2000; Reference Price, Bindschadler, Hulbe and BlankenshipPrice and others, 2002). Significant sliding is not unreasonable, given the likely availability of basal meltwater in the tributary region. However, in both of those studies, reproduction of the smoothly varying surface speed over the relatively rough tributary bed required spatially heterogeneous sliding, even after significant horizontal averaging of the driving stress. Reference Price, Bindschadler, Hulbe and BlankenshipPrice and others (2002) concluded that longitudinal stress gradients are the physical mechanism by which large variations in basal shear stress, and thus in tributary flow, are smoothed. A deep vertical shear margin, isolating overlying ice from the long-wavelength variations in bed elevation, would have the same effect. The anisotropic flow model predicts just such a mechanism.
At the upstream limits of tributary flow, where surface speeds first exceed those predicted by an isotropic flow law (cf. Reference Hulbe, Joughin, Morse and BindschadlerHulbe and others, 2000), a large-shear layer develops directly over the bed (Fig. 4, near the 100 km mark in both the D1 and D2 profiles). With distance downstream, this faster flow causes ice to thin, and, in traditional ice-flow models, basal sliding must be invoked to explain the continual downstream increase in ice speed. In the anisotropic model, the depth of maximum shear (the depth of max-conimum enhancement) moves away from the bed, and the resulting vertical shear margin isolates the tributary ice from the undulating bed (at about 150 km downstream green along D 1and about 175 km downstream along D2).
Horizontal strain heating in ice flowing toward the onset ice to Ice Stream D is modest because it is diffuse. Eventually, all particle paths converging on the ice stream pass through a region of relatively large horizontal shear, but residence times in these nascent lateral shear margins are too short to produce significant warming of the ice. However, the diffuse nature of the warming is found to have one significant effect: it either balances or exceeds vertical diffusion in almost all locations outboard of the ice-stream margins. The implication is that heating due to lateral shear may be important to the thermodynamics of broad, low-slope ice masses, where vertical terms usually dominate the heat balance.
Conclusion
Our simulations of ice flow upstream of the on setto Ice Stream D offer a new scenario for the downstream evolution of tributary flow. A layer of strong vertical shear clearly develops over the relatively rough bedrock over which the tributary makes its way toward the ice-stream onset. Far upstream in the tributary, the largest shear strain rates occur near the bed, but, with distance downstream, this layer rises from the bed, isolating the overlying ice from basal topographic highs that would otherwise provide significant basal drag. This vertical shear margin balances the gravitational driving stress, and ice speed continues to increase toward the onset. At the ice-stream onset, the vertical shear layer descends toward the bed, as it must in that small driving-stress regime.
Our analysis does not seek to invalidate alternative scenarios for ice-stream tributary flow. Clearly, an appropriately derived sliding parameterization could reproduce the tributary speed-up toward the ice-stream onset. However, we do note that a sliding model capable of reproducing the pattern of speeding and slowing over the rough bedrock terrain just north of our study area (cf. Reference Hulbe, Joughin, Morse and BindschadlerHulbe and others, 2000) would not be simple, while our model would work as well in that setting as in the present area (for which we had the most available data). The development of vertical shear margins maybe contemporaneous with changes occurring at the interface between ice and subglacial bed, although the processes are probably not complementary. A sliding model would depend in some way onthe production of basal meltwater and would in turn generate water by friction while large vertical shearing at some height above the bed would tend to limit the warming of basal ice by viscous dissipation and thus also limit basal melting. That is, the more pronounced the vertical shear, the less cause there is for basal sliding (and the less need to invoke it to explain the observed flow speed).
Acknowledgements
This work was supported by U.S. National Science Foundation grant OPP-0105308 and the NASA IceSat project. Conversations with S. Price about his Ice Stream D onset force budget inspired the endeavor. The manuscript benefited from thoughtful reviews by G. Catania and an anonymous reader.



