The characterization of language impairment (LI) in Spanish speakers indicates that morphology and syntax are vulnerable areas that may be used for identification of the population (Bosch & Serra, Reference Bosch and Serra1997; Morgan, Restrepo & Auza, Reference Auza2009; Restrepo, Reference Restrepo1998). Research examining LI in this population, however, includes monolingual and bilingual children with different language contact situations, which can impact overall language performance (Jacobson, Reference Jacobson2012). For example, bilingual children who speak a minority language as their first or home language (L1) and learn their second language (L2) in the L2 environment (i.e., school, community) demonstrate different patterns of language development when compared to their monolingual peers (Montrul, Reference Montrul2008; Paradis, Reference Paradis2010; Silva-Corvalán, Reference Silva-Corvalán, Montrul and Ordoñez2003). One such pattern is incomplete acquisition, which describes a language learner that does not reach full maturation in a language skill when compared to monolingual peers (Montrul, Reference Montrul2008). A similar pattern to incomplete acquisition is protracted language development, which describes a bilingual child who is not meeting the same language milestones as his monolingual peers but is still in the process of developing his two languages (e.g., Guiberson, Barret, Jancosek & Itano, Reference Guiberson, Barret, Jancosek and Itano2006; Jacobson, Reference Jacobson2012); in some cases this protracted development results in incomplete acquisition (Jacobson, Reference Jacobson2012; Montrul, Reference Montrul2008). Without knowing the full language development history of the child, it is difficult to distinguish between incomplete acquisition and protracted development; however, both complicate the differentiation of children with LI given that these patterns can impact the child's performance on morphological and syntax tasks.
Identification of LI in bilingual children is difficult, especially when elements of language that have been found to be vulnerable to error in children with LI undergo protracted development in bilingual children with typical language development (TD), thus giving the appearance that the children with TD are language impaired. For example, there are elements of L1 morphology, such as clitic pronouns, that have been observed to be near full development in five-year-old monolingual Spanish speakers with TD, while these same elements are still in the process of development in older Spanish–English (SE) bilingual school-age children (Pérez-Leroux, Castilla & Brunner, Reference Pérez-Leroux, Castilla and Brunner2011). Similarly, morphological errors in Spanish are currently viewed as strong predictors of LI in SE bilingual children (Bedore & Leonard, Reference Bedore and Leonard1998, Reference Bedore and Leonard2001; Bedore & Peña, Reference Bedore and Peña2008; Gutiérrez-Clellen, Restrepo & Simon-Cereijido, Reference Gutiérrez-Clellen, Restrepo and Simon-Cereijido2006; Gutiérrez-Clellen & Simon-Cereijido, Reference Gutiérrez-Clellen and Simon-Cereijido2007; Restrepo, Reference Restrepo1998). Therefore, when compared to monolingual Spanish-speaking peers, SE bilingual children may appear delayed and be over-identified as LI. Research on the overlap of bilingualism and LI is growing (Anderson & Marquez, Reference Anderson and Marquez2009; Crago & Paradis, Reference Crago, Paradis, Levy and Schaeffer2003; Paradis, Reference Paradis2010; Paradis & Crago, Reference Paradis and Crago2000, Reference Paradis, Crago, Prévost and Paradis2004; Paradis, Crago & Genesee, Reference Paradis, Crago and Genesee2005/2006; Paradis, Crago, Genesee & Rice, Reference Paradis, Crago, Genesee and Rice2003) and the current study adds to this body of literature by examining the Spanish morphosyntactic errors of SE bilingual children with LI and with TD and comparing them to monolingual peers living in Mexico.
Protracted development of L1 in Spanish–English bilingual children
Protracted development of L1 can occur in subtractive bilingual environments when the L1 input is limited (Genesee, Paradis & Crago, Reference Genesee, Paradis and Crago2004; Jacobson, Reference Jacobson2012) and is further exacerbated when the child's L2 is the community's majority language; that is, the child's L2 is the language that the surrounding community speaks and the language of instruction at the child's school (Montrul, Reference Montrul2008). Changes in the amount of L1 and L2 input, such as systematic exposure to L2 (e.g., schooling in L2) with limited support of L1, seems to be a strong contributing factor to protracted development of the L1 (Guiberson et al., Reference Guiberson, Barret, Jancosek and Itano2006; Hammer, Lawrence & Miccio, Reference Hammer, Lawrence and Miccio2008; Montrul, Reference Montrul2008; Restrepo et al., Reference Restrepo, Castilla, Schwanenflugel, Neuharth-Pritchett, Hamilton and Arboleda2010). However, Montrul and Potowski (Reference Montrul and Potowski2007) suggest that systematic support of the L1 in bilingual children in a language minority context helps to maintain L1: Although when bilinguals are compared to monolingual peers protracted development may still occur. Montrul and Potowski (Reference Montrul and Potowski2007) observed the Spanish grammatical gender marking of SE bilingual children (six to eleven years old) enrolled in a dual-language immersion school in a large city in the U.S. and compared the SE bilinguals to monolingual Spanish-speaking children living in a small city in Mexico and to native English speakers learning Spanish in the U.S. on a story retell and a puzzle picture-naming task. On the story retell task, which targeted determiners (e.g., el, la, los, las), they found that the monolinguals correctly marked gender nearly 100% of the time, but the SE bilinguals had a statistically significant error rate of 5% below the monolinguals. For the puzzle picture-naming task, which targeted gender agreement with adjectives, the monolinguals again correctly used grammatical gender nearly 100% of the time whereas the bilinguals had a statistically significant error rate of nearly 30% below the monolinguals on average. A 30% error rate can impact diagnostic language test scores and most likely clinical judgment when identifying LI.
Spanish–English bilingual children in the U.S. often do not receive systematic support for their L1 in school, leading to slower L1 growth (Hammer et al., Reference Hammer, Lawrence and Miccio2008; Restrepo, Castilla, Schwanenflugel, Neuharth-Pritchett, Hamilton & Arboleda, Reference Restrepo, Castilla, Schwanenflugel, Neuharth-Pritchett, Hamilton and Arboleda2010). For example, Restrepo et al. (Reference Restrepo, Castilla, Schwanenflugel, Neuharth-Pritchett, Hamilton and Arboleda2010) found that Spanish-speaking children who entered English-only preschool programs and received a Spanish add-on intervention made significantly greater gains in Spanish than peers who did not receive the Spanish add-on intervention and received English-only instruction. Their results indicated that the mean length of utterance in words and subordination index in Spanish grew at a slower rate in the English-only group, whereas those who received the Spanish add-on intervention showed significant gains in these two areas. The control group showed protracted development in these areas in only one academic school year. Similarly, Paradis, Nicoladis, Crago and Genesee (Reference Paradis, Nicoladis, Crago and Genesee2010) found that in morphological skills French–English bilingual preschool-to-kindergarten-aged children who spoke English at home and were schooled only in French were significantly less accurate in the use of English past tense compared to the English monolingual norms on the Test of Early Grammatical Impairment (Rice & Wexler, Reference Rice and Wexler2001) and that the bilingual children were significantly less accurate in the use of French past tense when compared to monolingual French-speaking peers.
Often morphological test results indicate that typical bilinguals are similar to monolingual children with LI because features of language that are vulnerable to error in children with LI are also vulnerable to error in children experiencing incomplete acquisition (Crago & Paradis, Reference Crago, Paradis, Levy and Schaeffer2003; Jacobson, Reference Jacobson2012; Montrul & Potowski, Reference Montrul and Potowski2007; Paradis et al., Reference Paradis, Nicoladis, Crago and Genesee2010; Paradis & Crago, Reference Paradis and Crago2000, Reference Paradis, Crago, Prévost and Paradis2004). We examine the characteristics of SE bilingual and monolingual Spanish-speaking children with LI and with TD and then examine their performance on tasks that target features of Spanish grammar that have been found to be impaired in a variety of children with LI who speak Spanish.
Grammatical markers vulnerable to error in Spanish-speaking children with LI
Grammatical errors in combination with parent report have been found to lead to the accurate identification of predominately Spanish-speaking children with LI who were living in the U.S. and attending schools with bilingual education (Restrepo, Reference Restrepo1998). Research in the last decade has focused on identifying the grammatical clinical markers in this population, which has improved the identification process of Spanish-speaking children with LI (e.g., Bedore & Leonard, Reference Bedore and Leonard1998, Reference Bedore and Leonard2001; Dollaghan & Horner, Reference Dollaghan and Horner2011; Gutiérrez-Clellen, Reference Gutiérrez-Clellen2002, Reference Gutiérrez-Clellen2004; Gutiérrez-Clellen et al., Reference Gutiérrez-Clellen, Restrepo and Simon-Cereijido2006; Jacobson, Reference Jacobson2012; Jacobson & Schwartz, Reference Jacobson and Schwartz2002; Morgan et al., Reference Morgan, Restrepo and Auza2009; Restrepo & Gutiérrez-Clellen, Reference Restrepo and Gutiérrez-Clellen2001, Reference Restrepo and Gutiérrez-Clellen2012; Restrepo & Kruth, Reference Restrepo and Kruth2000). Specifically, vulnerable elements of Spanish morphology, such as articles, clitics, and subjunctive verbs, among others, have been identified as probable predictors of LI in monolingual and bilingual Spanish-speaking children (Auza, Reference Auza2009; Bedore & Leonard, Reference Bedore and Leonard1998, Reference Bedore and Leonard2001, Reference Bedore and Leonard2005; Bosch & Serra, Reference Bosch and Serra1997; Gutiérrez-Clellen, Reference Gutiérrez-Clellen2004; Gutiérrez-Clellen et al., Reference Gutiérrez-Clellen, Restrepo and Simon-Cereijido2006; Gutiérrez-Clellen, Restrepo, Bedore, Peña & Anderson, Reference Gutiérrez-Clellen, Restrepo, Bedore, Peña and Anderson2000; Merino, Reference Merino1983, Reference Merino and Butler1992; Restrepo & Kruth, Reference Restrepo and Kruth2000; Restrepo & Silverman, Reference Restrepo and Silverman2001). Further, in a recent meta-analysis, Dollaghan and Horner (Reference Dollaghan and Horner2011) reported that grammatical morphology continues to be the best identifier of LI in bilingual children.
Although there are now measures in the U.S. for the identification of LI in Spanish speakers who are bilingual, these measures focus on developmental language acquisition milestones instead of targeting markers of LI in Spanish; further, they have no norms for monolingual populations (Restrepo & Gutiérrez-Clellen, Reference Restrepo and Gutiérrez-Clellen2012). Assessment of bilingual Spanish speakers in the use of syntax and morphology relies primarily on language sampling (Restrepo, Reference Restrepo1998), dynamic (Peña, Iglesias & Lidz, Reference Pérez-Leroux and Nelson2001) or structure grammatical tasks (Anderson, Reference Anderson1996; Gutiérrez-Clellen et al., Reference Gutiérrez-Clellen, Restrepo and Simon-Cereijido2006). However, work on linguistic markers in Spanish LI demonstrates some equivocal work at least in the types of errors. One of the primary issues is the variability across studies in the demographic characteristics of the samples, such as sociolinguistic context (e.g., Anderson, Reference Anderson2012; Anderson & Marquez, Reference Anderson and Marquez2009; Restrepo & Gutiérrez-Clellen, Reference Restrepo and Gutiérrez-Clellen2012). Examination of the markers and how sociolinguistic factors impact performance is critical for the clinical and theoretical implications. We examine which markers have been found to differentiate between TD and LI in Spanish speakers.
Articles
Monolingual and bilingual Spanish-speaking children with LI commit significantly more errors with articles than age- and language-matched peers with TD (Anderson & Marquez, Reference Anderson and Marquez2009; Anderson & Souto, Reference Anderson and Souto2005; Auza, Reference Auza2009; Bedore & Leonard, Reference Bedore and Leonard2001, Reference Bedore and Leonard2005; Bosch & Serra, Reference Bosch and Serra1997; Eng & O'Connor, Reference Eng and O'Connor2000; Morgan et al., Reference Morgan, Restrepo and Auza2009; Simon-Cereijido & Gutiérrez-Clellen, Reference Simon-Cereijido and Gutiérrez-Clellen2007; Restrepo & Gutiérrez-Clellen, Reference Restrepo and Gutiérrez-Clellen2001). Bosch and Serra (Reference Bosch and Serra1997) reported on the use of articles in Spanish–Catalan bilingual children with LI as compared to peers with TD matched on mean length of utterance in words and age-matched peers with TD. Results from spontaneous language sample analyses indicated that the children with LI committed significantly more article errors than peers with TD and that article omissions were by far the most frequent error type. Similar results have been observed in several other studies (Anderson & Souto, Reference Anderson and Souto2005; Bedore & Leonard, Reference Bedore and Leonard2001; Morgan et al., Reference Morgan, Restrepo and Auza2009; Simon-Cereijido & Gutiérrez-Clellen, Reference Simon-Cereijido and Gutiérrez-Clellen2007).
Article substitution errors, in particular gender agreement, have also been reported as a dominant error type in Spanish-speaking children with LI, mostly in bilingual speakers whose first language is Spanish (Bedore & Leonard, Reference Bedore and Leonard2005; Restrepo & Gutiérrez-Clellen, Reference Restrepo and Gutiérrez-Clellen2001). Restrepo and Gutiérrez-Clellen (Reference Restrepo and Gutiérrez-Clellen2001) and Bedore and Leonard (Reference Bedore and Leonard2005) reported high incidences of errors with el (masculine, singular article) in the story retell and spontaneous language sample analyses of predominately Spanish-speaking children with LI living in the U.S. Restrepo and Gutiérrez-Clellen (Reference Restrepo and Gutiérrez-Clellen2001) observed an overall higher incidence of errors with singular forms, whereas Bedore and Leonard (Reference Bedore and Leonard2005) observed an overall higher incidence of errors with plural forms. Anderson and Souto (Reference Anderson and Souto2005) also examined gender-agreement errors in monolingual Spanish-speaking children with LI. They observed significantly more omission than substitution errors in children with LI; however, when the children with LI did make substitution errors, the authors attributed it more to difficulty accessing the correct article form and not due to a knowledge deficit of the gender-agreement paradigm (Anderson & Souto, Reference Anderson and Souto2005). One difference between the first two studies (Bedore & Leonard, Reference Bedore and Leonard2005; Restrepo & Gutiérrez-Clellen, Reference Restrepo and Gutiérrez-Clellen2001) and the third study (Anderson & Souto, Reference Anderson and Souto2005) is that the first two studies examined children living in the U.S. in a language contact context with English, whereas the third study examined children living in Puerto Rico, a highly Spanish dominant context. It is possible that in language contact contexts, substitutions may be more predominant than in monolingual contexts. Further, age of the children and language elicitation techniques may also influence outcomes (Restrepo & Gutiérrez-Clellen, 2011).
To sum up, predominately Spanish-speaking children and bilingual Spanish–English speaking children tend to substitute articles, while monolingual Spanish-speaking children tend to omit them in obligatory contexts (e.g., Niños quieren pan vs. Los[masc-pl] niños quieren pan “The children want bread”). In many cases, the substitutions concerning gender agreement are observed in the bilingual population. Gender-agreement errors are rarely observed in monolingual children, which leaves omissions as the most frequently observed error pattern in that population.
Clitics
Research indicates that Spanish-speaking children with LI commit significantly more errors with clitics (object and indirect object pronouns) than peers with TD (Bedore & Leonard, Reference Bedore and Leonard2005; Bosch & Serra, Reference Bosch and Serra1997; Gutiérrez-Clellen et al., Reference Gutiérrez-Clellen, Restrepo and Simon-Cereijido2006; Jacobson & Schwartz, Reference Jacobson and Schwartz2002; Morgan et al., Reference Morgan, Restrepo and Auza2009); however clitic error patterns, like those associated with article use, vary across studies. Morgan et al. (Reference Morgan, Restrepo and Auza2009) and Bosch and Serra (Reference Bosch and Serra1997) reported greater rates of omission than substitution errors in Spanish-speaking children with LI who were living in a Spanish-speaking country. In contrast, Bedore and Leonard (Reference Bedore and Leonard2001, Reference Bedore and Leonard2005) and Jacobson (Reference Jacobson2012) reported significantly greater rates of substitution than omission errors in children with LI who were living in the U.S.
As with articles, one explanation for the differences in rates of clitic substitution error types could be the differences in the language contact context. For example, bilingual children who are immersed in an L2 that does not mark gender agreement as extensively as Spanish, may not attend to gender agreement between clitics and their referents in the L1. (Ella se la[fem-sg] come; referent: manzana[fem-sg] “She eats it”; referent: apple].)
Number-agreement errors seem to be reported more than gender-agreement errors in monolingual contexts. One explanation for number-substitution errors is the “near miss” phenomenon (Bedore & Leonard, Reference Bedore and Leonard2001), which hypothesizes that children are approximating the plural form by only producing the singular form because the final /s/ is less salient (i.e., lo or la for los or las); however, the near miss explanation does not account for greater occurrence of omissions than substitutions observed in some studies with Spanish clitics (Bosch & Serra, Reference Bosch and Serra1997; Jacobson, Reference Jacobson2012; Jacobson & Schwartz, Reference Jacobson and Schwartz2002; Morgan et al., Reference Morgan, Restrepo and Auza2009). Regardless of error type, Spanish-speaking children with LI commit significantly more errors with plural clitics; therefore, items that target plural clitics should strongly be considered for tasks that are used to identify Spanish-speaking children with LI.
Mood selection (subjunctive use)
Mood selection (indicative vs. subjunctive) has been observed to be vulnerable to error in Spanish-speaking children (Anderson, Reference Anderson2001; Blake, Reference Blake1983; López-Ornat, Fernández, Gallo & Mariscal, Reference López Ornat, Fernández, Gallo and Mariscal1994; Morgan et al., Reference Morgan, Restrepo and Auza2009; Pérez-Leroux, Reference Pérez-Leroux1998, Reference Pérez-Leroux and Nelson2001; Sánchez-Naranjo & Pérez-Leroux, Reference Sánchez-Naranjo and Pérez-Leroux2010). This is true in particular for Spanish-speaking children living in the U.S. when in language contact with English (Merino, Reference Merino1983; Montrul, Reference Montrul2004), bilingual children experiencing incomplete acquisition of the L1 (Silva-Corvalán, Reference Silva-Corvalán, Seliger and Vago1991, Reference Silva-Corvalán1994, Reference Silva-Corvalán, Montrul and Ordoñez2003), bilingual children with LI living in the U.S. (Gutiérrez-Clellen et al., Reference Gutiérrez-Clellen, Restrepo and Simon-Cereijido2006), and monolinguals with LI in Mexico (Morgan et al., Reference Morgan, Restrepo and Auza2009). Morgan et al. (Reference Morgan, Restrepo and Auza2009) reported that monolingual Mexican Spanish-speaking children with LI committed significantly more subjunctive errors than peers with TD when prompted with a question and sentence stem that had an open-ended dependent clause in the form of a complement clause where the main verb required the use of the subjunctive in the complementary clause (e.g., Los platos están sucios. La mama quiere que él [target response:] se lave los platos, se los lave, láveselos “She wanted that [target response:] he wash the dishes”). They reported that the children with LI often switched to the indicative (19% of responses) or provided the infinitive (32% of responses), whereas the children with TD never switched to the indicative, but 14% of their responses used the infinitive. Closer examination of the responses by Morgan et al. concluded that the responses that included the infinitive could be grammatically acceptable because of how the questions in the task were structured. Responses in the indicative were not acceptable, which is consistent with the fact that the children with TD never responded using the indicative; in addition, the prompts used complement and relative clauses with verbs in the independent clause that required a subjunctive verb in the dependent clause. Gutiérrez-Clellen et al. (Reference Gutiérrez-Clellen, Restrepo and Simon-Cereijido2006) reported similar results with predominately Spanish-speaking children with LI who were living in an English language contact context; children with LI committed significantly more subjunctive errors than children with TD. They did not provide a detailed analysis of error types; therefore, a comparison across the studies could not be made.
Derivational morphemes
Derivational morphemes in Spanish have been found to be vulnerable to error in Spanish-speaking children with LI. Morgan et al. (Reference Morgan, Restrepo and Auza2009) found that monolingual Spanish-speaking children with LI scored significantly lower than typical peers on a cloze task that elicited derivational morphemes of occupations and adjectives (jardín – jardinero “garden” – “gardener”, enojarse – enojado “get angry” – “angry”). Spanish derivational morphemes have not been reported to necessarily be vulnerable to error in Spanish-speaking children who live in an English language contact context; however, results of related studies indicate that SE bilingual children with LI are significantly slower than typical peers at learning rules for applying an invented derivational morpheme (Roseberry & Connell, Reference Roseberry and Connell1991). In addition, SE bilingual children have significantly slower reaction times than monolingual Spanish-speaking children when repeating words and pseudo-words embedded with derivational morphemes (Auza & Hernández, Reference Auza, Hernández, Mayor, Zubiauz and Díez2005). Considering these three studies, it is probable that SE bilingual children with LI will struggle when probed on items that target derivational morphemes.
In summary, articles, clitics, subjunctives, and derivational morphemes are forms that have the potential to differentiate between TD and LI groups in different sociolinguistic contexts. However, systematic examination between monolingual and bilingual context in the two groups would help elucidate how these two contexts impact performance in the two ability groups and whether these forms are sensitive across the different language contact contexts. Further, examination of error types would help determine whether there are quantitative and qualitative differences across ability and language context groups.
Purpose of the present study
Evidence from studies of morphological skills suggests that SE bilingual children who are experiencing protracted development in these skills also commit errors in the same areas of Spanish morphology as Spanish-speaking children with LI. This overlap creates the potential for the misdiagnosis of LI in SE bilingual children (Anderson, Reference Anderson1999a, Reference Anderson2012; Anderson & Marquez, Reference Anderson and Marquez2009; De Jong, Reference De Jong2010; Guiberson et al., Reference Guiberson, Barret, Jancosek and Itano2006; Montrul, Reference Montrul2004, Reference Montrul2008; Montrul & Potowski, Reference Montrul and Potowski2007). This is especially the case when many native Spanish-speaking children enter U.S. schools and receive no L1 support or instruction. What is still unclear is whether there are unique error rates or types that can be used to characterize or distinguish between SE bilinguals with LI and SE bilinguals with TD who are experiencing incomplete acquisition or protracted development.
The purpose of this study is to answer three main research questions in order to address the issue of evaluating SE bilinguals. The research questions we address are:
1. Do SE bilinguals with LI commit significantly more errors in the use of overall morphological skills, and specifically in clitics, articles, subjunctives, and derivational morphemes, than SE bilinguals with TD who are at risk of incomplete acquisition?
2. How do bilinguals with LI and with TD compare to monolinguals with LI and with TD in the use of morphological skills, and specifically in clitics, articles, subjunctives, and derivational morphemes? For example are there differences in error types?
3. Are there differences in classification accuracy for bilingual children when using cutoff scores that are derived from monolingual-only data or bilingual-only data?
It is hypothesized that the morphosyntactic ability of the SE bilinguls with TD will overlap with their monolingual counterparts with LI and with TD thus creating a potential problem of over-identification of LI in SE bilinguals with TD if they are compared to monolinguals. In contrast, it is also hypothesized that the morphosyntactic ability of the SE bilinguals with TD will be significantly greater than their SE bilingual peers with LI, which would therefore lead to an improvement in classification accuracy.
Methods
To answer the three research questions, we examine the Spanish morphological skills of SE bilingual children with LI and with TD in comparison to monolingual Spanish-speaking children with LI and with TD in a monolingual Spanish-speaking context (Mexico). The groups were compared on an experimental Spanish morphology measure that targeted Spanish morphological skills that are vulnerable to error in Spanish-speaking children with LI in monolingual and bilingual contexts. Further, we examine whether a cutoff score based on monolingual data increases the rate of over-identification in bilinguals with TD.
Participants
As part of a larger study in the Southwest of the U.S., thirty SE bilingual children of Mexican descent were recruited from kindergarten and first-grade classrooms that provided English-only instruction and no Spanish language support. Of those thirty children, seven children were identified with LI. For the monolingual comparison group, 27 monolingual Spanish-speaking children were recruited from kindergarten and first-grade classrooms in a school in central Mexico. Of those 27 children, nine were identified with LI. (The results of the nine monolingual children with LI and nine TD age-matched peers have been reported and described in a previous study, see Morgan et al., Reference Morgan, Restrepo and Auza2009.) To increase the sample size, an additional nine monolinguals with TD, who were not selected as age matches for the Morgan et al. study, were included in the current sample because their data was collected at the same time and in the same manner. (Mean ages and standard deviations for each group are reported in Table 2 below.) Children living in Mexico attended a private school for middle-income families and children living in the U.S. attended a public school; thus, socioeconomic status (SES) was included as a covariate in the statistical analyses where the monolinguals were compared to bilinguals.
Participant selection criteria
All participants from the U.S. met the following criteria: (i) parent report indicated no history of mental retardation or neurological deficits; (ii) scored 75 or greater on the Kaufman Assessment Battery for Children, second edition (KABC–II) (Kaufman & Kaufman, Reference Kaufman and Kaufman2004); (iii) passed a pure tone hearing screening; (iv) parent report indicated that Spanish was spoken in the home at least 50% of the time or greater; (v) teachers reported that the participants spoke Spanish as their native language and were not native English speakers; (vi) were enrolled in a kindergarten or first-grade English language development classroom; and (vii) had attended at least one year of English-only education.
All participants from the U.S. with typical language development (TD group) met the following additional criteria: (i) parent and/or teacher reports indicated no concerns of speech or language impairments; (ii) scored within normal limits on two subtests (Estructura de Palabras and Repetición de Oraciones) of the Spanish Clinical Evaluation of Language Fundamentals 4 (SCELF–4) (Wiig, Semel & Secord, Reference Wiig, Semel and Secord2006); and (iii) had been screened and not referred for speech or language services by their school's ASHA certified native Spanish-speaking bilingual speech-language pathologist.
All participants from the U.S. with LI met the following additional criteria: (i) parent and/or teacher report indicated concerns of speech or language impairments; (ii) scored below normal limits (1 SD) on two subtests (Estructura de Palabras and Repetición de Oraciones) of the SCELF–4; and (iii) scored below 1 SD from the mean on the third edition of the Structured Photographic Expressive Language Test (SPELT–3) (Dawson, Stout & Eyer, Reference Dawson, Stout and Eyer2003). Item (iii) ensured that these students also demonstrated a language deficit in English and that low Spanish performance was not due to limited Spanish proficiency.
All participants from Mexico met the following criteria: (i) parent report indicated no history of mental retardation or neurological deficits; (ii) only spoke Spanish at home and in school; (iii) obtained a nonverbal IQ score of 75 or above on the KABC–II; and (iv) parents reported no history of hearing impairment.
Children with typical language met the following additional criteria: (i) parent report indicated no concern of speech or language impairment; (ii) at least 80% of their utterances in a language sample were grammatically correct (Restrepo, Reference Restrepo1998); and (iii) scored greater than or equal to 1 SD from the monolingual sample scale score mean on two subtests (Estructura de Palabras and Repetición de Oraciones) of the SCELF–4.
Children with LI met the following additional criteria: (i) parents indicated concerns pertaining to their child's speech and language (Restrepo, Reference Restrepo1998); (ii) at least 20% of their utterances in a language sample were not grammatically correct (Restrepo, Reference Restrepo1998); (iii) scored less than or equal to 1 SD from the monolingual sample scale score mean on two subtests (Estructura de Palabras and Repetición de Oraciones) of the SCELF–4; and (iv) were identified as LI by a native Spanish-speaking speech-language pathologist.
Identification measures
Parent report of language use and proficiency
An adaptation of Restrepo's (Reference Restrepo1998) parent report measure was used to profile the participant's language use and proficiency, education history, and speech and language concerns that parents may have about their child. Parents were asked to report on the language (Spanish, English or both) in which individual family members communicate to the participant and which language the participant communicates with them; the type of previous education or daycare the participant had and in what language the instruction or care was in; special education history; and speech and language concerns; and the mothers of the participants were asked to report whether or not they completed high school or a general education degree (GED) as a proxy for socioeconomic status.
Kaufman Assessment Battery for Children, second edition
In order to rule out cognitive impairment, the Nonverbal inventory of the KABC–II was administered; directions in Spanish were used when nonverbal methods of communication were ineffective. Subtests vary according to age and include: conceptual thinking, face recognition, story completion, triangles, block counting, pattern reasoning, and hand movements. Scale scores for each subtest were calculated and then summed; a standard non-verbal IQ score was calculated from the summed scale scores for each child.
Spanish Clinical Evaluation of Language – 4
The SCELF–4 is intended to identify Spanish-speaking participants with LI; further, it has scoring adaptations that allow it to be used with SE bilinguals. The technical manual (Wiig et al., Reference Wiig, Semel and Secord2006) indicates that the SCELF–4 is valid and demonstrates high sensitivity (96%) and specificity (87%) for Spanish-speaking participants ages 5 and above and the test retest reliability across subtest is above .80, with most above .85. This measure was used according to the norms with the bilingual population; however, for the monolingual population, the cut-off score had to be adjusted one standard deviation based on the clinical report of a speech-language pathologist (SLP) and the language samples.
Grammaticality per terminable unit ratio (Restrepo, Reference Restrepo1998)
A language sample in the form of a story retell was collected from each child who lived in Mexico. The children were read the Spanish version of If You Give a Mouse a Cookie (Numeroff & Bond, Reference Numeroff and Bond1985) and instructed to listen carefully because they were going to tell the story back to the tester. Language samples were used to corroborate the status of a child's group membership (TD or LI) with (a) the parent report with ungrammaticality above 20% errors per T – unit indicating LI status (Restrepo, Reference Restrepo1998) – and (b) the clinical judgment of an SLP. .
Structured Photographic Expressive Language Test, third edition
The SPELT–3 is intended to identify English-speaking participants with LI; however, it was used as part of the bilingual evaluation of LI in this study because bilingual participants identified with LI must demonstrate deficits in both languages (Bedore & Peña, Reference Bedore and Peña2008; Kohnert, Reference Kohnert2008; Restrepo & Silverman, Reference Restrepo and Silverman2001) and it was necessary to rule out misdiagnosis of LI in Spanish when the children presented typical language in English. The SPELT–3 evaluates English morphosyntactic structures using pictures; there is only one test with 53 items. Perona, Plante and Vance (Reference Perona, Plante and Vance2005) evaluated the classification accuracy of the SPELT–3. Results indicated that a cut-off score of 95 on the standard score scale of the SPELT–3 yielded a sensitivity of 91% and a specificity of 100%. Results suggested that the SPELT–3 had good classification accuracy of LI in English-speaking participants and Hispanic participants who speak English as a native language. For the purposes of this study, we used a cut-off score of 85 to determine that a child presented typical language in English, and thus was disqualified for the study as LI, because the cut-off score in Perona et al., (Reference Perona, Plante and Vance2005) was with monolingual children.
English language development classroom
The State of Arizona mandates that all participants who speak English as a second language that do not pass the Arizona English Language Assessment with a score of 5 out of 5, must be placed in an English language development (ELD) classroom. In order to ensure that the participant participants spoke Spanish as their primary language and English as their second language, participants were enrolled in an ELD classroom.
Experimental measure
The Spanish grammatical morphology measure (SGMM) developed by Morgan et al. (Reference Morgan, Restrepo and Auza2009) is a task that is given orally with a cloze format and questions for the elicitation of four grammatical areas that have been previously identified as vulnerable to error in Spanish-speaking children with LI: articles, clitics, subjunctive verbs, and derivational morphemes.
Each individual section controls for various factors that pertain to the particular grammatical marker that is being tested, and language acquisition was considered when developing the experimental task. Two native Spanish-speaking speech-language pathologists and two native Spanish-speaking linguists reviewed all of the items for content validity, grammaticality, and age appropriateness: items were rejected or changed through group consensus.
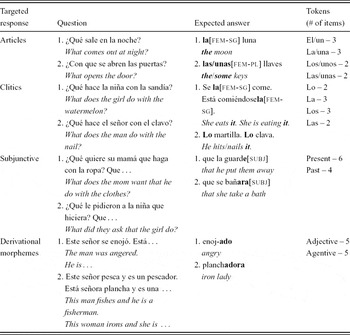
Clitic items were developed controlling for gender and number of the clitic (lo[masc-sg], la[fem-sg], los[masc-pl], las[fem-pl]); only direct object clitics were elicited and the tense of the verb that was used with the clitic was not considered when scoring. Credit was given for producing a clitic that matched in gender and number to the direct object in the question (e.g., Se la[fem-sg] come; referent: sandía[fem-sg] “She eats it”; referent: the watermelon). If the clitic was omitted, it was considered an error. The use of the full noun phrase was not considered as correct or incorrect and thus the item was eliminated in the percentages. Dative clitics (le and les) were not elicited, but if a child used a dative clitic that matched in number to the referent it was counted as correct, otherwise it was incorrect. For example, ¿Qué le hace el gato al ratón? “What did the cat do to the rat?” Lo atrap “He caught it”, resulted in a few children responding with le atrapa instead of lo atrapa; in this case it was counted as correct.
The article items were also developed controlling for number and gender, in addition to the semantic functions of the word to which the article referred (la[fem-sg] luna “the moon”; unos[masc-pl] ratones “some mice”). Errors in gender or number agreement and omissions were tracked.
The subjunctive items were developed controlling for tense (Quiere que la guarde[subj-pres] “(She) wants that she keep it”), plurality, and the semantic functions of the predicate verbs (desiderative and directive). Research indicates that the subjunctive mood develops slowly over time (Blake, Reference Blake1983; Hernández-Pina, Reference Hernández-Pina1984; López Ornat et al., Reference López Ornat, Fernández, Gallo and Mariscal1994); in addition, evidence suggests that the optative form (expresses hopes, wishes, or commands) of the subjunctive is one of the first forms to be acquired by Spanish-speaking children (López Ornat, Fernández, Gallo, & Mariscal, Reference López Ornat, Fernández, Gallo and Mariscal1994). Consequently, subjunctive item development focused on this form and items were written to elicit subjunctive complements to desiderative and directive predicates (e.g., obligation, possibility, necessity) (e.g., ¿Qué le pidieron a la niña que hiciera? “What was the girl asked to do?” Que bañara[subj]/Lavara al perro “That she wash the dog”). While controls for the types of subjunctives were used when creating the items, it became clear to us that multiple tenses of the subjunctive would be acceptable as answers; therefore we accepted all tenses of the subjunctive as correct.
The derivational morphemes items were developed controlling for the type of morpheme in the eliciting adjective (enoj-ado “angry”) or agentive formation (pesc-ador “fisherman”). Table 1 provides some examples of the target items in each grammatical section and the number of tokens for each grammatical marker. In the derivational morpheme section, children received credit for producing any of the adjective morphemes (enoj-ado “angry”, prend-ido “turned on”) or the agentive morphemes (mes-ero “waiter”, planch-ador(a) “iron lady”).
Example items and number of tokens.

Each item referred to a color picture to provide the student with an additional point of reference. Items were presented orally and the child responded orally. Scoring criteria for each item was provided along with expected answers and examples of possible deviations. Items were scored on the basis of whether the child appropriately used the targeted grammatical marker, but the children did not receive credit when they omitted the target or produced any other word or marker apart from the expected. When a clitic, article, subjunctive form, or derivational morpheme was not produced in an obligatory context (e.g., ¿Qué le quitó la niña a la muñeca? “What did the girl take off the doll?” El/unzapato “The/a shoe”) it was considered an omission.
Procedures
Children were administered all measures in random order; monolingual Spanish-speaking children were tested by a group of five trained native Spanish-speaking graduate students from the same city as the children in Mexico; the SE children living in the U.S. were tested by a group of trained native and bilingual proficient Spanish-speaking graduate students. Testers were blind to the language status of the children at the time of testing. Data was collected over the course of two weeks for the monolingual children from Mexico and over a six-month period for the SE bilingual children. Children were excused from their class for two to three sessions of between 45 and 60 minutes to complete the testing.
Reliability of scoring
For the data from Mexico, all of the experimental test protocols were double scored; total agreement was 95% (Morgan et al., Reference Morgan, Restrepo and Auza2009). For the data from the U.S., 20% of the test protocols were double scored during administration; total agreement was 96%.
Test and item analyses of Spanish grammatical measure
Cronbach's alpha, a measure of internal consistency, was calculated for each subtest. A Cronbach's alpha above .80 is considered to be an adequate result of internal consistency (Green, Lissitz & Mulaik, Reference Green, Lissitz and Muliak1977). In addition, difficulty values (e.g., proportion of participants to get an item correct, a.k.a. p-values) were calculated for each item; items with high p-values are easy and those with low values are hard. Items that have p-values of .5 are the most desirable because they provide the most amount of differentiation between groups (Anastasi & Urbina, Reference Anastasi and Urbina1997).
Analyses
Research question 1: Bilingual TD vs. bilingual LI
Group differences on the total score of the SGMM were compared using analyses of variance (ANOVA) and group differences on the subscale scores of the SGMM were compared using a multivariate analysis of variance (MANOVA). In all analyses alpha was set at < .05 and effect sizes were calculated using partial eta-squared (η2).
Research question 2: Monolingual vs. bilingual
Group differences on the total score of the SGMM were compared using analyses of covariance (ANCOVA), and group differences on the subscale scores of the SGMM were compared using a multivariate analysis of variance (MANCOVA). The covariate for the ANCOVA and MANCOVA was a categorical variable that represented whether or not the mother graduated from high school (0 = did not graduate from high school, 1 = graduated high school) and served as a proxy variable for SES. In all analyses alpha was set at < .05 and effect sizes were calculated using partial eta-squared. Follow-up tests were conducted using Sidak's test for multiple comparisons.
Research question 3: Classification accuracy
To evaluate the classification accuracy of the SGMM, receiver operating characteristic (ROC) curves were examined to determine the cutoff score that produced the best rates of sensitivity (i.e., the proportion of children with LI who scored below a cutoff score) and specificity (i.e., the proportion of children with TD who scored above a cutoff score). Sensitivity and specificity rates of .90 and higher are considered excellent, .80 to .89 are considered good, .70 to .79 are considered fair, and below .70 are considered inadequate (Plante & Vance, Reference Plante and Vance1994). To demonstrate possible misclassifications due to the comparison of children across language contact contexts, two different cutoff scores were established using ROC curves derived from only the monolingual data and then from only the bilingual data.
Results
Descriptive statistics
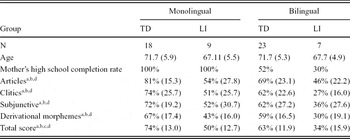
Across sites, participants in the current study ranged in age from 60 to 80 months. On average, the children with TD were three months older than the children with LI; however, this difference was not significant, F(1,55) = 0.15, p = .71. The mothers from the monolingual group all graduated high school, whereas only 47% of the mothers from the bilingual group graduated high school. There was a significant between-group difference for graduation status, F(1,55) = 29.77, p < .001; therefore, it was included as a covariate in all analyses that included comparisons of the monolingual and the bilingual groups. Lastly, there was no significant between-group difference on the measure of nonverbal intelligence (KABC–II), F(1,55) = 0.09, p = .83; therefore, it was not included as a covariate.
Across all subtests of the SGMM, Cronbach's alpha was equal to .86. Average total scores for the different groups ranged from 34% to 74% correct, with the monolinguals with TD scoring the highest on average and the bilinguals with LI scoring the lowest on average. Results of the item analyses indicated p-values that ranged from .27 to .86 with a mean, median, and mode of .63, .66, and .59 respectively; descriptive statistics at the subtest and total score level are reported by group in Table 2.
Descriptive statistics – age in months and raw mean percent correct (SDs) by group, by subtest scores, and by total score.

TD = typical language development; LI = language impaired
a Significant differences observed after controlling with Sidak between B-TD and B-LI
b Significant differences observed after controlling with Sidak between M-TD and B-LI
c Significant differences observed after controlling with Sidak between B-TD and M-LI
d Significant differences observed after controlling with Sidak between M-TD and M-LI and reported from Morgan, Restrepo & Auza (Reference Auza2009)
Note: There were no significant differences between the B-TD and M-TD groups.
Research question 1: Bilingual TD vs. bilingual LI
Results from the ANOVA indicated a significant between group difference on the total score of the SGMM, F(1,28) = 26.26, p < .001, partial η2 = .484. Results from the MANCOVA of the individual subtest scores indicated a significant multivariate difference, Wilks’ Λ = .49, F(4,25) = 6.54, p < .001, partial η2 = .51 and significant between-group effects for articles, F(1,28) = 5.51, p < .05, partial η2 = .16; clitics, F(1,28) = 14.78, p < .01, partial η2 = .35; subjunctives, F(1,27) = 4.33, p = .047, partial η2 = .14; and derivational morphemes, F(1,28) = 14.8, p < .001, partial η2 = .36.
Research question 2: Monolingual vs. bilingual
Results from the ANCOVA indicated a significant between group difference on the total score of the SGMM, F(3,52) = 14.49, p < .001, partial η2 = .46; the covariate, maternal high school completion rate, was not significant, F(1,52) = 1.28, p = .27. Follow-up pair-wise comparisons revealed that the monolinguals with TD (M-TD) significantly outperformed the bilinguals with LI (B-LI), but not the bilinguals with TD (B-TD) and the B-TD scored significantly higher than the M-LI group. No other group comparisons were significant. As reported in Morgan et al. (Reference Morgan, Restrepo and Auza2009), the M-TD group scored significantly higher than the M-LI group on the total score of the SGMM.
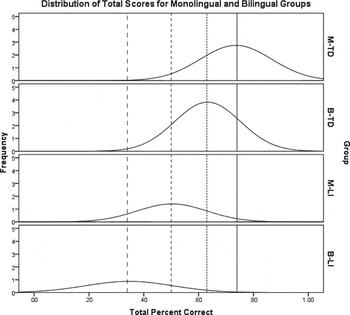
Results from the MANCOVA of the individual subtest scores indicated a significant multivariate difference, Wilks’ Λ = .51, F(12,129.93) = 3.18, p < .01, partial η2 = .20; the covariate, maternal high school completion rate, was not significant, Wilks’ Λ = .90, F(4,49) = 1.23, p = .31. Significant between-subjects effects were observed for articles, F(3,52) = 4.66, p < .01, partial η2 = .21; clitics, F(3,52) = 5.33, p < .01, partial η2 = .24; subjunctives, F(3,52) = 3.51, p < .05, partial η2 = .17; and derivational morphemes, F(3,52) = 8.80, p < .001, partial η2 = .34. Follow-up tests indicated that the M-TD group scored significantly higher than the B-LI group on all subtests. No other differences were observed. As reported in Morgan et al. (Reference Morgan, Restrepo and Auza2009), the M-TD group scored significantly higher than the M-LI group on all subtests. Figure 1 summarizes the results for questions 1 and 2.
Distributions of Total Scores for Monolingual and Bilingual Groups with LI and with TD.
Reference lines indicate the mean of each group: large dashes = B-LI, small dashes = M-LI, dots = B-TD, solid = M-TD.

Error types
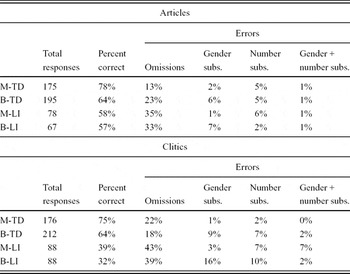
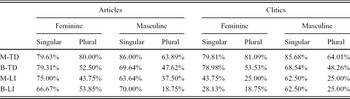
Descriptive statistics of error types for articles, clitics, and subjunctives are reported in Tables 3, 4, and 5. Table 3 indicates that omission errors were the most frequent type of error across all groups for articles. For clitics, the monolinguals committed more omission errors while omission and substitution errors were similar for the bilinguals. Further examination revealed that bilinguals committed more gender than number substitutions for both articles and clitics, while monolinguals had slightly more number than gender substitutions. Table 4 indicates that plural articles and plural clitics were the most vulnerable to error across all groups. In addition, with the exception of the feminine plurals for the monolinguals with TD, all groups had the lowest percentage correct on plural articles and clitics.
Article and clitic errors by type: percentage of total responses.

TD = typical development; LI = language impaired; M = monolingual; B = bilingual; subs. = substitutions
Note: Adding across the columns within each group may not add up exactly to 100% because of rounding
Article and clitic percent correct by specific form.

TD = typical development; LI = language impaired; M = monolingual; B = bilingual
Subjunctive percent correct and percent of errors by type.

TD = typical development; LI = language impaired; M = monolingual; B = bilingual
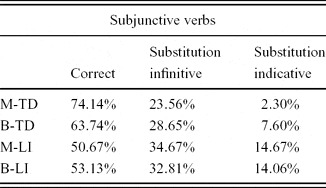
Table 5 reports the subjunctive errors by group and type of error. For subjunctives, the most common error across groups was the use of the infinitive, but the LI groups produced more indicative errors than the TD groups. The pattern did not differ across language contact groups. Derivational morphemes errors were not reported because there was not a specific error pattern.
Research question 3: Classification accuracy
The ROC curve based on only the monolingual data had area under the curve of .91 (SE = .06) which indicates that a child with TD randomly drawn from the sample would score higher than a child with LI randomly drawn from the sample 91% of the time; an area under the curve of .90 to 1 indicates excellent test accuracy (Sackett, Haynes, Guyatt & Tugwell, Reference Sackett, Haynes, Guyatt and Tugwell1991). A cut score of 68.75% or lower was determined to produce the highest rates of sensitivity (1.00) and specificity (.72) for monolinguals. When this cut score was applied to the bilinguals’ total scores, it produced an excellent rate of sensitivity (1.00) but an inadequate rate of specificity (.40). The ROC curve based only on the bilingual data had an area under the curve of .94 (SE = .04). A cut score of 52.50% or lower was determined to produce the highest rates of sensitivity (.86) and specificity (.78) for bilinguals. When applied to the monolinguals’ total scores it produced an excellent rate of sensitivity (.94) but a poor rate of specificity (.55).
Discussion
The first research question of the current study examined whether the Spanish morphosyntactic skills of SE bilingual children with LI differed from those with TD in overall morphological accuracy and in each specific morpheme that was examined: clitics, articles, subjunctive mood, and derivational morphemes. The current study found that SE bilingual children with LI scored significantly lower than their typical bilingual peers on cloze tasks that targeted Spanish articles, clitics, subjunctives, and derivational morphemes. These results support previous studies with monolingual and bilingual populations that found that these morphosyntactic skills in general and the specific aspects evaluated are vulnerable to error in SE bilinguals with LI (e.g., Gutiérrez-Clellen, Reference Gutiérrez-Clellen2002; Gutiérrez-Clellen et al., Reference Gutiérrez-Clellen, Restrepo and Simon-Cereijido2006; Jacobson & Schwartz, Reference Jacobson and Schwartz2002; Morgan et al., Reference Morgan, Restrepo and Auza2009; Restrepo & Gutiérrez-Clellen, Reference Restrepo and Gutiérrez-Clellen2001, Reference Restrepo and Gutiérrez-Clellen2012). Specific morphosyntactic marker performance is discussed below.
The second purpose of the study was to examine whether monolingual children differed from their bilingual peers across ability groups (TD vs. LI) and context (monolingual vs. bilingual). Specifically, it addressed the impact of language contact in a subtractive bilingual context on the morphosyntactic performance of SE bilingual children when compared to monolingual peers living in a monolingual context. Previous research has indicated that when compared to monolingual peers, bilinguals can appear delayed or to have similar language ability levels to those of monolinguals with LI (Crago & Paradis, Reference Crago, Paradis, Levy and Schaeffer2003; Paradis, Reference Paradis2010; Paradis & Crago, Reference Paradis and Crago2000, Reference Paradis, Crago, Prévost and Paradis2004; Paradis et al., Reference Paradis, Crago and Genesee2005/2006; Paradis et al., Reference Paradis, Crago, Genesee and Rice2003); however, results from the current study may suggest a more nuanced interpretation. Distributions of the total scores on the Spanish morphology measure for each group show that the bilingual groups are shifted below the monolingual groups but overlap considerably nonetheless (see Figure 1). Further, the bilinguals with TD fall in between the monolinguals with TD and monolinguals with LI, which indicates that the upper half of the distribution of bilinguals with TD score more like their monolingual peers with TD and that the lower half score more like their monolingual peers with LI. After controlling for SES, a comparison of means of the total scores indicated significant differences across ability groups but within context (B-TD > B-LI and M-TD > M-LI). No differences within ability groups across contexts (B-TD = M-TD and B-LI = M-LI) were observed; however, a significant difference was observed across ability groups and across contexts (M-TD > B-LI and in total score B-TD > M-LI, although specific morphemes indicated B-TD = M-LI). Thus, based on group mean comparisons, the results are consistent with previous research, which suggests that as a group, bilinguals have comparable morphosyntactic skills to monolinguals despite living in a language contact context (Gutiérrez-Clellen et al., Reference Gutiérrez-Clellen, Restrepo and Simon-Cereijido2006). However, equivalences and differences at the group mean level do not always translate to good classification accuracy at the individual level (more on this below).
The third research question of the study examined whether there are differences in classification accuracy for bilingual children when using cutoff scores that are derived from monolingual-only data or bilingual-only data. It is evident from the distributions of the total scores that there is a large overlap between bilinguals with TD and monolinguals with LI. Despite their group mean scores being significantly different, such an overlap can create problems of over-identification of LI in SE bilinguals with TD if they are compared to monolinguals and not bilinguals. A ROC curve analysis of only the monolingual data indicated that a cut score of 68.75% maximized the sensitivity (1.00) and specificity (.72) for the monolingual participants. When the same cut score was applied to the bilingual participants, it resulted in perfect sensitivity (1.00) but very poor and inadequate specificity (.40). A specificity of .40 would indicate that 60% of bilinguals with TD would be misclassified as LI. In contrast, a ROC curve analysis of only the bilingual data indicated that a cut score of 52.50% maximized the sensitivity (.86) and specificity (.78) for bilinguals. When this cut score was applied to the monolinguals, it only slightly reduced the sensitivity (.94), but it had a substantial negative impact on the specificity (.55). The smallish sample sizes in this study prohibit us from considering these results on classification accuracy in an absolute sense and by individual morpheme or combination of morphemes, but the effect of using inappropriate comparison groups is nonetheless the same. In either case, the classification accuracy was reduced, mostly in terms of specificity, when using the cutoff score of another group. Thus, these results suggest that it is important to consider the appropriateness of language comparison groups and representative normative samples when examining language performance in bilingual populations. In addition, the results suggest that a measure of Spanish grammatical morphology has the potential for good clinical utility when assessing SE bilingual children for LI when performance is compared to typical peers from a similar language contact context.
The diagnostic accuracy of the study results suggest the need to obtain converging evidence of LI in bilingual children beyond observing a grammatical deficit, such as the use of dynamic assessment (Kapantzoglou, Restrepo & Thompson, Reference Kapantzoglou, Restrepo and Thompson2012; Peña, Reference Peña, Iglesias and Lidz2001), sentence repetition (Morgan et al., Reference Morgan, Restrepo and Auza2009), or parent report (Restrepo, Reference Restrepo1998). Nevertheless, a recent meta-analysis on the diagnostic accuracy of tests used to identify LI in SE bilinguals indicated that while no single diagnostic test was sufficient for the identification of LI in SE bilinguals, Spanish grammar tests were reported to have the best classification accuracy of the tests that were examined (Dollaghan & Horner, Reference Dollaghan and Horner2011).
Comparing the language performance of bilinguals to monolinguals for classification purposes may not be a good option considering that the B-TD group did not differ significantly from either the M-TD or M-LI groups when we examined individual morphemes. These results suggest that the bilingual children demonstrate protracted morphological development when compared to monolingual children, although significant differences are not always apparent as in the current study across ability and language context groups (B-TD = M-LI). These results are consistent with those of Guiberson et al. (Reference Guiberson, Barret, Jancosek and Itano2006) who found that Spanish-speaking preschool children with longer exposure to English demonstrated an increased number of grammatical errors over time when compared to a group with less exposure to English. Similarly, Jacobson (Reference Jacobson2012) found that bilingual children with TD and LI increased in the use of clitics as they got older, indicating that although there is protracted clitic development, exposure to their L1 at home continued to lead to increased accuracy, albeit at a slower rate than in monolingual populations.
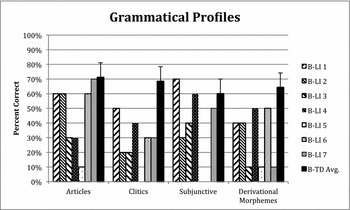
Even when examining bilingual populations, it may be the case that those children who live and are educated in subtractive bilingual contexts, where there is limited support for their L1, may differ greatly from those who live and are educated in additive bilingual contexts, where there is support for the L1. In some instances, Spanish morphological skills have been documented to diminish over time in SE bilingual children living in language contact with English (Anderson, Reference Anderson1999a, Reference Andersonb, Reference Anderson2012). Therefore, factors such as home language use, age of L2 exposure, age of acquisition of L2, and maternal high school completion rates may also impact the stability of the morphological skills in SE bilingual children (Anderson, Reference Anderson1999a, Reference Anderson2012; Guiberson et al., Reference Guiberson, Barret, Jancosek and Itano2006; Montrul & Potowski, Reference Montrul and Potowski2007; Silva-Corvalán, Reference Silva-Corvalán, Montrul and Ordoñez2003). Additionally, the strengths and weaknesses of bilingual children with LI will vary from child to child; for example, Figure 2 illustrates how some of the SE bilingual children with LI scored higher than the SE bilingual with TD average.
Percent correct by subtest for each SE bilingual child with LI and the SE bilingual typical mean with average standard error.

Outcomes and limitations
Articles
Examination of children's performance in article production indicated that both groups of children with LI demonstrated difficulty in this area when compared to their peers with TD, which corroborates the results of previous studies (Anderson & Marquez, Reference Anderson and Marquez2009; Anderson & Souto, Reference Anderson and Souto2005; Bosch & Serra, Reference Bosch and Serra1997; Eng & Connor, Reference Eng and O'Connor2000; Morgan et al., Reference Morgan, Restrepo and Auza2009; Restrepo & Gutiérrez-Clellen, Reference Restrepo and Gutiérrez-Clellen2001). Error type differences across groups indicated that all of the groups produced more omissions than substitution errors, which is a similar result to those studies that have examined articles with elicitation tasks (Anderson & Souto, Reference Anderson and Souto2005; Bedore & Leonard, Reference Bedore and Leonard2001); however, substitutions have also been reported as the dominant error type (Restrepo & Gutiérrez-Clellen, Reference Restrepo and Gutiérrez-Clellen2001; Simon-Cereijido & Gutiérrez-Clellen, Reference Simon-Cereijido and Gutiérrez-Clellen2007). Examination across studies indicates that cloze tasks may lead to a greater number of omissions than language samples (Restrepo & Gutiérrez-Clellen, Reference Restrepo and Gutiérrez-Clellen2012). One possible reason for this is that language samples often rely on visual stimuli (i.e., picture book, picture) and such stimuli may not present many target forms. Another reason is that when using language sampling, children can choose targets that are easier for them to produce, which could lead to more errors of substitution than omission. In contrast, elicited tasks often have one specific target, which leaves the child with fewer options to choose from and therefore could lead to more omissions than substitutions. In the current study, both monolinguals and bilinguals rarely produced any substitutions. In fact, the occurrences of substitutions are so low that it would be imprudent to make any interpretation. These results, however, do corroborate Anderson and Souto (Reference Anderson and Souto2005), who also observed very few occurrences of substitution errors with articles in monolingual children.
Performance on different article types indicated that plural forms were the most difficult, which contrasts with the results of Restrepo and Gutiérrez-Clellen (Reference Restrepo and Gutiérrez-Clellen2001) and Eng and Connor (Reference Eng and O'Connor2000), but are consistent with those from Bedore and Leonard (Reference Bedore and Leonard2005). Differences in elicitation tasks may also account for some of the variability. In the current study, we elicited the different article forms using a cloze task that controlled for the function, gender, definiteness, and number of the articles, whereas other studies used language samples that did not control for such features. From a developmental perspective, age differences across the studies could account for the error differences, since the concept of plurality is more complex and would be more prone to error in younger children; however, in the current study, we observed difficulty with plurals in children from kindergarten to first grade and other studies also observed difficulty with plural articles in preschool children (e.g., Bedore & Leonard, Reference Bedore and Leonard2001, Reference Bedore and Leonard2005).
Clitics
Performance in clitic production demonstrated that both groups of children with LI performed significantly below their peers with TD. These results are consistent with previous studies with bilingual children with LI (Jacobson, Reference Jacobson2012; Jacobson & Schwartz, Reference Jacobson and Schwartz2002; Simon-Cereijido & Gutiérrez-Clellen, Reference Simon-Cereijido and Gutiérrez-Clellen2007; Restrepo & Kruth, Reference Restrepo and Kruth2000) and previous studies with monolingual children with LI (Morgan et al., Reference Morgan, Restrepo and Auza2009). The possibility that clitic pronouns may be a clinical marker, such as in French (Paradis et al., Reference Paradis, Crago and Genesee2005/2006) and Italian (Bortolini, Caselli, Deevy & Leonard, Reference Bortolini, Caselli, Deevy and Leonard2002) is not supported by the data from monolingual (Morgan et al., Reference Morgan, Restrepo and Auza2009) or bilingual Spanish-speaking children (Simon-Cereijido & Gutiérrez-Clellen, Reference Simon-Cereijido and Gutiérrez-Clellen2007) given that at least one child with LI scored within the normal range in the Morgan et al. (Reference Morgan, Restrepo and Auza2009) study. Simon-Cereijido and Gutiérrez-Clellen (Reference Simon-Cereijido and Gutiérrez-Clellen2007) also found that a measure of clitic pronouns had poor sensitivity in Spanish-speaking children with LI. Nevertheless, performance with clitics seems to indicate that this skill is vulnerable to error in bilingual children who demonstrate protracted development or are experiencing incomplete acquisition (e.g., Pérez-Leroux, Pirvulescu & Roberge, Reference Pérez-Leroux, Pirvulescu and Roberge2009; Silva-Corvalán, Reference Silva-Corvalán, Seliger and Vago1991).
Examination of clitic production revealed that on the one hand, both groups of children with LI demonstrated difficulty in this area when compared to their language context peers with TD, which corroborates with previous studies on Spanish clitic usage in children with LI and with TD (Bedore & Leonard, Reference Bedore and Leonard2005; Bosch & Serra, Reference Bosch and Serra1997; Gutiérrez-Clellen et al., Reference Gutiérrez-Clellen, Restrepo and Simon-Cereijido2006; Jacobson, Reference Jacobson2012; Jacobson & Schwartz, Reference Jacobson and Schwartz2002). On the other hand, comparing populations and error types, both groups with LI produced more omissions than substitutions. In contrast, M-TD groups produced more omission than substitution errors, while the B-TD groups produced the same number of omission and substitution errors. Within the substitution error types, SE bilinguals had similar rates of gender and number substitution errors. The M-TD group produced very few substitution errors and the M-LI group produced slightly more number than gender substitution errors, whereas the B-LI produced more gender than number substitutions, although the differences between error types seems quite small. Overall, the greater occurrence of substitutions in the bilingual group may be indicative of something that is specific to SE bilinguals; future studies may want to investigate this phenomenon more closely.
Examination of the specific clitic forms in the current study indicated that for all children plural clitics were the most difficult; however, M-TD group demonstrated some difficulty with only masculine plurals (64% accuracy). In contrast, the B-TD group used plural clitics with about 50% accuracy, and the two groups with LI seemed to have great difficulty with plural clitics (18% to 25% accuracy). Therefore, the results of the current study observe a larger deficit with plurals for bilingual children with LI than with TD. One explanation for this could be the “near miss” phenomenon (Bedore & Leonard, Reference Bedore and Leonard2001), where near misses with Spanish plural clitics and articles would be evidenced by a greater number of substitutions with singular forms (el, la, lo, la) in the place of plural forms (los, las, los, las). Upon further examination of the data in the current study, children with LI combined made only a small percentage of number substitutions for articles and clitics (14% of total error responses and 3.5% of total responses, respectively); of those, there was nearly equal representation of number substitutions for singular and plural forms. Thus, the near miss phenomenon does not seem to explain the apparent difficulty with plural articles and clitics in the current study.
Subjunctives
Performance in the use of subjunctive forms was highly variable with standard deviations ranging from 19% to nearly 30%. In Spanish the subjunctive develops later than the other verb tenses and moods (López Ornat et al., Reference López Ornat, Fernández, Gallo and Mariscal1994), which when coupled with the potential for incomplete acquisition may explain the low subjunctive scores observed in the bilingual groups. Silva-Corvalán (Reference Silva-Corvalán, Montrul and Ordoñez2003) observed comparable results in SE bilingual children who were of similar age and experiencing incomplete acquisition of Spanish.
The subjunctive is difficult to examine in preschool and young school age children because it is a skill that is not yet fully developed due to the cognitive, syntactic, and semantic demands needed to learn the subjunctive mood (López Ornat et al., Reference López Ornat, Fernández, Gallo and Mariscal1994; Pérez-Leroux, Reference Pérez-Leroux and Nelson2001; Sánchez-Naranjo & Pérez-Leroux, Reference Sánchez-Naranjo and Pérez-Leroux2010). The current study elicited the subjunctive using relative clauses where the desiderative or directive predicate required a subjunctive complement; these types of subjunctive clauses were targeted because evidence suggests that they are among the first to be acquired (Blake, Reference Blake1983; López Ornat et al., Reference López Ornat, Fernández, Gallo and Mariscal1994). As predicted, the children with LI committed significantly more subjunctive errors than the children with TD; however, there was no observed difference within ability group (TD or LI) between bilinguals and monolinguals. The majority of errors produced in the current study may have been more related to the elicitation than mood selection. This is due to the fact that the most common error type was an infinitive verb, which is a correct response if the child did not begin his/her response with que (that). Consider the following:

Putting the infinitive responses aside, the children with LI did make more indicative mood substitutions (14% of errors) than the children with TD (2%–7% of errors); therefore, future studies may want to create elicitations where the infinitive forms are not a correct option.
Derivational morphemes
Performance on the derivational morphemes task indicated that both groups of children with LI had difficulty with these skills. In particular, the -ero derivational morpheme, which can be used to change a noun to an occupational term (i.e., mesa – mesero), was observed by Morgan et al. (Reference Morgan, Restrepo and Auza2009) to differentiate between monolinguals with TD and those with LI; a similar result for SE bilinguals with LI was observed in the current study. As this task required participants to apply a morphological-derivational rule to create an occupational term (Esta señora plancha y es una [target response:] planchadora “This lady irons [the clothes] and she is a(n) [target response:] iron lady”), our finding suggests that the problems participants with LI presented with may go beyond inflectional morphology (see Windsor & Hwang, Reference Windsor and Hwang1999, for English school-age children) and impact semantic aspects also documented in this population. Roseberry and Connell (Reference Roseberry and Connell1991) also observed preschool bilingual children demonstrating difficulty learning derivational morphemes, although this may be a skill where the potential differences between children with LI and with TD are better observed at later ages.
Limitations
The major limitation of this study is the small sample size. Though the research supports the hypothesis that comparing the morphosyntacic skills of bilinguals to monolinguals will lead to over-identification of LI in bilnguals, strong claims in this regard cannot be made until more extensive research is conducted.
Related to the small sample size is the lack of younger typically developing children who are matched on language level with the children with LI. Comparisons could have been between these two groups in terms of error types and rates. However, the lack of language matches does not limit the study in terms of investigating classification accuracy as children who are being evaluated are typically compared to same age peers.
Differences in socioeconomic status may also be a source of limitation as they may account for the elevated scores of the monolinguals over the bilinguals. We controlled for these differences statistically, but ideally it is better to match populations rather than have statistical controls. Despite these differences, we have no reason to believe that SES will impact grammatical aspects to such an extent when the dialects are similar.
Conclusion
In this study, SE bilingual children with LI and with TD who lived in the U.S. and attended English-only schools were compared on four grammatical features of Spanish to monolingual Spanish-speaking children with LI and with TD living in a monolingual context in Mexico. Results indicated that a grammatical deficit is a characteristic of both monolingual Spanish-speaking and SE bilingual children with LI, but no specific marker is exclusively difficult. Particular difficulties were observed in all grammatical features studied: articles, clitics, subjunctives, and derivational morphemes.
Error analyses indicated similar patterns across groups with a few exceptions. Omission errors occurred more frequently than substitution errors in almost all cases. In the case of substitutions, bilinguals committed many gender agreement errors, whereas monolinguals made more number errors. Children with LI made proportionally more indicative errors in the subjunctive; although, the common error pattern across groups was to use more infinitives, which may be due more to the elicitation task than the use of the subjunctive. Plural forms seem to be problematic for articles and clitics across both groups with LI and for SE bilinguals with TD. Difficulty with plurals may indicate that these forms add a level of complexity in language production. Overall, the results of the current study indicate that the above morphological skills could be used to identify LI in bilingual Spanish–English children. Most importantly, the results emphasize the importance of using appropriate reference groups when assessing bilinguals for LI. The use of monolingual comparisons could lead to over-identification of LI in SE bilinguals with TD; however, more extensive research in the areas of protracted language development, and incomplete acquisition is needed to support this hypothesis.