Introduction
The regional stress regime of the Antarctic Peninsula has remained little known due primarily to scarcity of outcropping rock, and a lack of commercial drilling or recorded seismicity. Tectonic stress studies in this area are key to developing a better understanding of the net effects of plate-boundary and glacio-tectonic forces. Some authors have proposed that tectonic evolution of this Antarctic Plate sector is profoundly influenced by the growth and decay cycles of Antarctic ice sheets through postglacial rebound and uplift/subsidence associated with glacial erosion and surface mass distribution. Others have long maintained that the mass of present Antarctic ice sheets, superimposed on a compressive tectonic stress regime, promotes fault stability and aseismicity by decreasing net differential stress (Johnston Reference Johnston1987, Hampel & Hetzel Reference Hampel and Hetzel2006). Other authors have related the stress regime during the Cenozoic–present solely to the movement of the various plates that bound the Antarctic Peninsula and tectonic processes developed along and within them. In the northern Antarctic Peninsula the main tectonic processes are: i) strike-slip motion and subduction or slab rollback in the South Shetlands Trench since Jurassic times (Barker Reference Barker1982, Maldonado et al. Reference Maldonado, Larter and Aldaya1994, Lawver et al. Reference Lawver, Sloan, Barker, Ghidella, VonHerzen, Keller, Klinkhamer and Chin1996), ii) rifting in the Bransfield Basin since Pliocene times (Lawver et al. Reference Lawver, Sloan, Barker, Ghidella, VonHerzen, Keller, Klinkhamer and Chin1996, González-Casado et al. Reference González-Casado, López-Martínez and Durán1999, Reference Gónzalez-Casado, Giner and López-Martínez2000, Maestro et al. Reference Maestro, Somoza, Rey, Martínez-Frías and López-Martínez2007), iii) transcurrent movement and subduction along South Scotia Ridge since upper Miocene times (Galindo-Zaldívar et al. Reference Galindo-Zaldívar, Jabaloy, Maldonado and Sanz de Galdeano1996, Acosta & Uchupi Reference Acosta and Uchupi1996, Rodríguez-Fernández et al. Reference Rodríguez-Fernández, Balanya, Galindo-Zaldívar and Maldonado1997, Eagles & Livermore Reference Eagles and Livermore2002, Giner-Robles et al. Reference Giner-Robles, Gonzalez-Casado, Gumiel, Martin-Velazquez and Garcia-Cuevas2003, Bohoyo Reference Bohoyo2004, Eagles et al. Reference Eagles, Livermore and Morris2006, Bohoyo et al. Reference Bohoyo, Galindo-Zaldívar, Jabaloy, Maldonado, Rodríguez-Fernández, Schreider, Suriñach, Cunningham and Mann2007), and iv) seafloor-spreading connected to the opening of Weddell Sea (Livermore & Woollett Reference Livermore and Woollett1993, Ghidella et al. Reference Ghidella, Yáñez and LaBrecque2002, Kovacs et al. Reference Kovacs, Morris, Brozena and Tikku2002).
Seymour (Marambio) Island, the subject area of this study, is located at the western margin of the Weddell Sea, in the James Ross Basin (Del Valle et al. Reference DelValle, Elliot and Macdonald1992). It is bounded to the east by a shelf-break towards the oceanic crust of the Weddell Sea, and to the west, through steep faults, by the Antarctic Peninsula. The main objectives for studying the brittle mesostructures in the Cenozoic–Quaternary rocks of Seymour Island are: i) characterization of the Cenozoic–Recent tectonic stress field in Seymour Island, ii) comparison with Cenozoic–Recent stress indicators in neighbouring areas of the West Antarctica, and iii) determination of possible stress sources responsible for the orientation of Cenozoic minor horizontal stress.
Geological setting
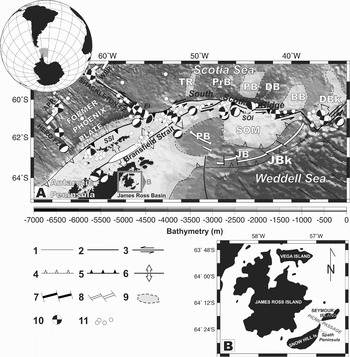
Seymour Island, a small ice-free island 100 km south-east of the northern tip of the Antarctic Peninsula in the north-western Weddell Sea (Fig. 1), is located in James Ross Basin, the northern sub-basin of the larger Larsen Basin (Macdonald et al. Reference Macdonald, Barker, Garrett, Ineson, Pirrie, Storey, Whitham, Kinghorn and Marshall1988) which developed behind an active magmatic arc. Its genesis, from upper Cretaceous to Eocene, is closely linked to the south-eastward progressive subduction of Phoenix Plate below the Antarctic Plate along the South Shetland Trench (Larter & Barker Reference Larter and Barker1991, Maldonado et al. Reference Maldonado, Larter and Aldaya1994). Larsen Basin has been interpreted as a back-arc basin with respect to the magmatic arc located in the Antarctic Peninsula area (Macdonald et al. Reference Macdonald, Barker, Garrett, Ineson, Pirrie, Storey, Whitham, Kinghorn and Marshall1988) that acted as the passive extending margin of the Weddell Sea (Pirrie Reference Pirrie1994). The South Shetland Trench is the last remnant of the active Pacific margin of the Antarctic Peninsula, which was active during the Mesozoic and Cenozoic (Barker Reference Barker1982). The Phoenix Plate became part of the Antarctic Plate when seafloor spreading stopped in Drake Passage 4 Ma ago, an event interpreted to have shut down subduction at the South Shetland Trench thrust (Barker Reference Barker1982). Nevertheless, analyses of earthquake focal mechanisms (Pelayo & Wiens Reference Pelayo and Wiens1989) and migrated multichannel seismic reflection profiles across the South Shetland Trench (Maldonado et al. Reference Maldonado, Larter and Aldaya1994) provide evidence supporting active subduction along the northern margin of the South Shetland Block at present. Evidence of magmatism connected with subduction of the Former Phoenix Plate (Barker Reference Barker1982) can be seen in plutonic and volcanic rocks exposed along the northern Antarctic Peninsula and western offshore islands. Dating of these rocks demonstrates a north-westward migration of magmatic activity concentrated along the South Shetland Islands from Palaeogene to the present day (Barker et al. Reference Barker, Dalziel, Storey and Tingey1991, Willan & Kelley Reference Willan and Kelley1999).
a. Regional tectonic framework and bathymetric contour map of northern Antarctic Peninsula regions modified from Galindo-Zaldívar et al. Reference Galindo-Zaldívar, Gamboa, Maldonado, Nakao and Bochu2006a. Bathymetric map derived from satellite and ship track data (Smith & Sandwell Reference Smith and Sandwell1997). Earthquake focal mechanisms of the northern Antarctic Peninsula from Harvard Seismology Centroid Moment Tensor Catalog (Dziewonski et al. Reference Dziewonski, Chou and Woodhouse1981). Original symbols in focal mechanism are maintained (white = compression, black = extension). Earthquake epicentres from NEIC (www.neic.cr.usgs.gov/). James Ross and Seymour islands are marked by box. Legend: 1 = Inactive transform fault, 2 = Transform fault, 3 = Transcurrent fault and sense, 4 = Inactive subduction zone, 5 = Subduction zone, 6 = Extensional zone, 7 = Axis of spreading ridge, 8 = Inactive spreading ridge, 9 = Submerged continental crust, 10 = Focal mechanism, 11 = Earthquake epicentre. APR = Antarctic-Phoenix Ridge, BB = Bruce Bank, DB = Dove Basin, DBk = Discovery Bank, EI = Elephant Island, FZ = Fracture Zone, JB = Jane Basin, JBk = Jane Bank, PB = Pirie Bank, PB = Powell Basin, PrB = Protector Basin, SOI = South Orkney Islands, SOM = South Orkney Microcontinent, SSI = South Shetland Islands, TR = Terror Rise, WSR = West Scotia Ridge. b. Main geographical features around Seymour Island.

The evolution of the James Ross Basin has been complicated by strike-slip or oblique extension along its north-eastern margin linked to the separation of the Antarctic Peninsula from South America. Evidence for this relative movement, continental stretching and seafloor spreading, is consistent with a period of east–west plate divergence in the Scotia Sea begining in the early–late Oligocene (Barker et al. Reference Barker, Dalziel, Storey and Tingey1991). However, other authors have dated the start of rifting processes as occurring during the Ypresian stage of the Eocene (53–47 Ma) (Livermore & Woollett Reference Livermore and Woollett1993, Livermore et al. Reference Livermore, Nankivell, Eagles and Morris2005). Extensional processes along this margin may have controlled the development of Powell, Protector and Dove sedimentary basins (Acosta & Uchupi Reference Acosta and Uchupi1996, Rodríguez-Fernández et al. Reference Rodríguez-Fernández, Balanya, Galindo-Zaldívar and Maldonado1997, Galindo-Zaldívar et al. Reference Galindo-Zaldívar, Jabaloy, Maldonado and Sanz de Galdeano1996, Reference Galindo-Zaldívar, Gamboa, Maldonado, Nakao and Bochu2006a, Reference Galindo-Zaldívar, Bohoyo, Maldonado, Schreider, Suriñach and Vázquez2006b, Eagles & Livermore Reference Eagles and Livermore2002, Eagles et al. Reference Eagles, Livermore and Morris2006). The Powell Basin is a small oceanic basin located within the Antarctic Plate (Fig. 1). Gravimetric anomalies identified on satellite-derived free-air gravity maps reveal a NW–SE trending symmetry axis, which can be interpreted as a spreading axis (Rodríguez-Fernández et al. Reference Rodríguez-Fernández, Balanya, Galindo-Zaldívar and Maldonado1997). The maximum age of oceanic spreading in Powell Basin, estimated at 29 Ma, is based on the depth of oceanic basin crust, after correcting for sediment loading (King & Barker Reference King and Barker1988). Heat-flow measurements made by Lawver et al. (Reference Lawver, Williams and Sloan1994) provided an older age, late Eocene to early Oligocene (32–38 Ma), for basin formation. Consistent ages are obtained from boreholes drilled in the southern margin of the South Orkney microcontinent (Site 966, Barker et al. Reference Barker and Kennett1988). Likewise, Eocene alkaline basalts, dredged from the southern margin of Powell Basin, probably represent initial stages of basin opening (Barber et al. Reference Barber, Barker, Pankhurst, Thomson, Crame and Thomson1991). Coren et al. (Reference Coren, Ceccone, Lodolo, Zanolla, Zitellini, Bonazzi and Centonze1997) determined the age of the northern sector oceanic crust in Powell Basin, to be from 27–18 Ma, from identification of marine magnetic anomalies. Eagles & Livermore's (2002) assignment of a possible age of 40–29.7 Ma to the rifting process in the Powell Basin falls within a period of early extension in the Drake Passage region, postulated on the basis of the movement of South America relative to Antarctica (Livermore & Woollet 1993). Spreading determined by Eagles & Livermore (Reference Eagles and Livermore2002) coincides with the first confidently identifiable seafloor spreading in Drake Passage at chron C8 to C10 time (26.5–30 Ma). The cessation of spreading in the Powell Basin occurred just prior to chron C6 (21.8 Ma), at a time when South America–Antarctica plate movement underwent rapid changes from WNW–ESE to W–E (King & Barker Reference King and Barker1988, Barker & Lawver Reference Barker and Lawver1988).
The Protector and Dove basins are located on the southern boundary of the Scotia Plate (Fig. 1). Spreading of Protector Basins, related to a north-propagating rift active during a period of about 3.6 Ma between chrons C5Acn and C5Dn (14–17.6 Ma), is indicated by interpretation of magnetic anomalies. The presence of a NNE–SSW elongated ridge in central Dove Basin suggests that its opening, produced by ocean spreading, took place in an ESE–WNW direction. Magnetic anomalies identified therein range in age from C5B–C5E (15–18.7 Ma). Opening of these basins indicates regional E–W stretching related to eastward development of the Scotia Arc that continues up to the present (Galindo-Zaldívar et al. Reference Galindo-Zaldívar, Gamboa, Maldonado, Nakao and Bochu2006a, Reference Galindo-Zaldívar, Bohoyo, Maldonado, Schreider, Suriñach and Vázquez2006b, 2006c). However, Eagles et al. (Reference Eagles, Livermore and Morris2006), on the evidence of basement depth, suggest spreading ages scattered between 40–20 Ma for both basins (late Eocene to Oligocene) and, from scarce magnetic anomaly profiles, an oldest oceanic crust of 48 Ma (chron C21). They drew a scenario of basins opening prior to Drake and Scotia Sea development.
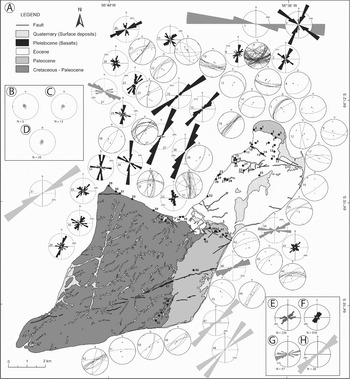
The exposed sedimentary sequence of Seymour Island, more than 2 km thick, represents the uppermost part of the of the James Ross Basin infill (Del Valle et al. Reference DelValle, Elliot and Macdonald1992) (Fig. 2a). The oldest units are the Maastrichtian Haslum Crag Member (upper level of Snow Hill Island Formation, defined by Pirrie et al. Reference Pirrie, Crame, Lomas and Riding1997), López de Bertodano Formation and the Danian Sobral Formation (Rinaldi et al. Reference Rinaldi, Massabie, Morelli, Rosenmann and Del Valle1978). These stratigraphic units are included in the Marambio Group (Rinaldi et al. Reference Rinaldi, Massabie, Morelli, Rosenmann and Del Valle1978), shallow-marine siliciclastic strata, part of a NNE–SSW homoclinal sequence dipping south-east at about 10° (Fig. 2b). The K/T boundary, exposed in the Lopez de Bertodano Formation (Elliot et al. Reference Elliot, Askin, Kyte and Zinsmeister1994), is in a glauconite rich interval that crops out along-strike for 5 km in the south-east of the island. The youngest beds, which outcrop on the northern part of the island, grouped in the late Palaeocene Cross Valley Formation and early Eocene–(possibly) early Oligocene La Meseta Formation (Elliot & Trautman Reference Elliot, Trautman and Craddock1982, Marenssi et al. Reference Marenssi, Santillana, Rinaldi and Casadío1998), were placed together in the Seymour Island Group (Elliot & Trautman Reference Elliot, Trautman and Craddock1982). Both formations represent infilling of incised valleys deeply cut into underlying units (Sadler Reference Sadler, Feldman and Woodburne1988) originated within an area bounded by growth faults (Porebski Reference Porebski2000). Valley fill deposit dip axially basinward 2–4°SE (Fig. 2c & d). A thin, even veneer of glaci-marine deposits (4 m thick) covering La Meseta sedimentary rocks on the plateau of permanently ice-free Seymour Island has been referred to informally as the Weddell Sea Formation (Zinsmeister & De Vries Reference Zinsmeister and De Vries1983). This formation was most probably deposited during the first glaciation that affected the area after the Pliocene transgression 2–3 Ma ago (Gazdzicki & Webb Reference Gazdzicki and Webb1996), however, in recent work Ivany et al. (Reference Ivany, VanSimaey, Domack and Samson2006) presented evidence of an earliest Oligocene age for at least the basal part of the Weddell Sea Formation. At Filo Negro ridge, in the south of the island, basaltic rocks trending WSW–ENE and traced for 5 km in length, have been dated as Pleistocene (1.34 + 0.07 Ma by Massaferro et al. unpublished).
a. Simplified geological sketch map of Seymour Island (modified from Feldmann & Woodburne Reference Feldmann and Woodburne1988) and location of study sites. Stereoplots include fault planes, bedding poles (black square) and stress axes (σ1: white circle, σ2: white square, and σ3: white triangle). Rose diagrams of orientation of joints (black roses), tension gashes (dark gray roses) and basaltic dikes (light gray roses) on the outcrop scale (outer circle represents 10%). Number of data, Table I. b. Density stereoplots representing the bedding pole obtained from recompilation data of Cretaceous units, c. Palaeocene units, and d. Eocene units. Equal area projection, lower hemisphere. Contour interval 8%. e. Rose diagrams indicating the orientation frequency for all measured normal and reverse faults, f. joints, g. tension gashes, and h. basaltic dikes. N = the number of data, and rose diagram outer circle represents 10%.

Palaeostress analysis of brittle mesostructures
Palaeostress analysis was performed on brittle mesostructures, mainly fault planes and tension joints, measured at 52 sites in Upper Cretaceous–Oligocene detrital rocks (Fig. 2a). Around 240 faults (33 sites), about 1000 extension fractures (19 sites), tension gashes (4 sites) and basalt dikes (3 sites) were measured and analysed. Small offset normal faults (approximately 200) dominate on the scale of exposure, although 12 reverse faults were recognized. In both cases, slip on the majority of fault planes varies from centimetres to few metres. Most joint planes are vertical, whereas normal and reverse faults dip between 30–80°. Overall, fractures on the scale of outcrop show NNE–SSW to NE–SW orientation maxima. Directional analysis of normal and reverse faults also reveals two relative maxima striking NE–SW and E–W (Fig. 2e). Joint data show a relative maximum striking NW–SE, apart from the principal direction (Fig. 2f). Tension gash separation between blocks range from 5–20 cm, calcite crystal filled. Tension gashes at sites 37 and 39 (see Fig. 2a) form two ENE–WSW and WNW–ESE trending conjugate sets. Individual veins with en echelon fracture arrays WNW–ESE lie perpendicular to the direction of maximum extension (Fig. 2g). Basaltic dikes form NE–SW trending, decametric to kilometric long crests with a thickness of 0.5–2 m (Fig. 2h).
Most of the measured joints correspond to extensional fractures formed normal to the direction of σ3 (Hancock & Engelder Reference Hancock and Engelder1989). Non-systematic cross-joints linked to principal sets are roughly parallel to minimum horizontal stress.
Palaeostress analysis of faults has been hampered by a lack of slickenlines and chatter marks on fault surfaces in sufficient number for conventional stress-inversion analysis. A new method of stress inversion based solely on observations of fault plane orientation and slip sense, proposed by Lisle et al. (Reference Lisle, Orife and Arlegui2001) and Orife et al. (Reference Orife, Arlegui and Lisle2002), permits stress interpretation in unlithified clastic deposits where striations are usually absent. Lisle et al. (Reference Lisle, Orife and Arlegui2001) described a method of stress inversion that can be carried out where slip lineations are lacking, but where the sense of the fault dip-slip component is known. This new method characterizes the stress tensor from orientation data for a collection of faults, each with known dip-slip sense (normal or reverse). Based on stress quadric properties, it determines the relationship between dip-slip sense, fault plane orientation and stress tensor. This relationship forms the basis of a grid-search method of stress inversion, in which a large number of stress tensors differing in orientation and shape are systematically considered. Those tensors that successfully explain the sense of offset in the observed faults are considered potential solutions to the palaeostress problem. Orife et al. (Reference Orife, Arlegui and Lisle2002) developed a computer implementation of this method, DIPSLIP, that determines not only stress-axis orientation but also the stress ratio, φ = (σ2–σ3)/(σ1–σ3). Results from this method are less than optimum when applied to faults generated by a polyphase paleostress. For this reason it is necessary to subdivide the fault population into cogenetic subsystems (e.g. reverse and normal faults, respectively), previous to analysis, to find the stress tensor that best explains the recorded sense of measured faults.
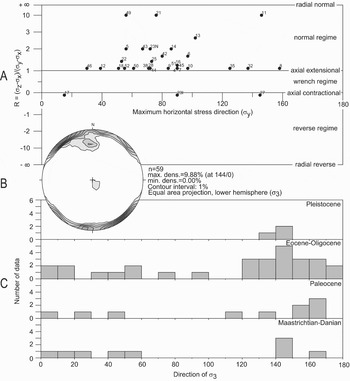
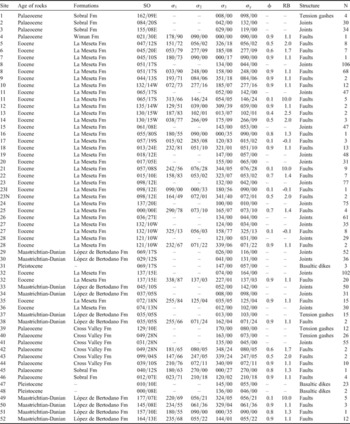
Results of our palaeostress analysis are summarized in Table I. Stress tensors are given with orientation of σ1, σ2 and σ3 axes and the modal value of φ (Wallace Reference Wallace1951). In addition, Rb = (σz–σx)/(σy–σx) (Bott Reference Bott1959) was calculated to determine the stress regime in each site. Principal stress axes orientation is graphed on the y-R diagram (Simón Reference Simón1986) to show orientation of maximum horizontal stress axes and their associated stress regime (Fig. 3a). Two main σ3 orientation modes trend NE–SW and NW–SE are obtained (Fig. 3b). Analysis of joints, tension gashes and basalt dikes may indicate the orientation of σ3 but not the associated tectonic regime. Distribution of σ1 and σ3 orientations inferred from brittle mesostructures in each site is shown in Fig. 2a. On the scale of outcrop, the relative chronology of extensional and compressional structures is not clear. Likewise, clear chronological relationships between NE–SW and NW–SE σ3 orientations cannot be established, but the NE–SW σ3 seems to have acted until Eocene–Oligocene, based on the age of the sedimentary sequence the structures are found (although the number of observations is not statistically significant, Fig. 3c).
a. y-R diagram of stress tensors obtained in this work. Number of the sites where data were taken indicated as for Fig. 2. To the right, stress regimes corresponding to the various values of the stress ellipsoid shape ratio are indicated. Maximum inclined axis has been considered as vertical for representation in y-R diagram. b. Density stereoplots representing extension (σ3) axes obtained from analysis of brittle mesostructures. Equal area projection, lower hemisphere. c. Relationship between extensional directions obtained from brittle mesostructures and age.

Summary of stress tensors and stress orientations obtained from brittle mesostructure population analysis. Sites are located in Fig. 2; age of rocks; Formation name; SO bedding orientation in site, strike/dip; σ1, σ2 and σ3' values of principal stress axes; σy' maximum horizontal stress; φ stress ratio = (σ2 –σ3)/(σ1–σ3) (Wallace Reference Wallace1951); Rb stress ratio = (σz–σx)/(σy–σx) (Bott Reference Bott1959); Structures; and N, number of data measured in each site.

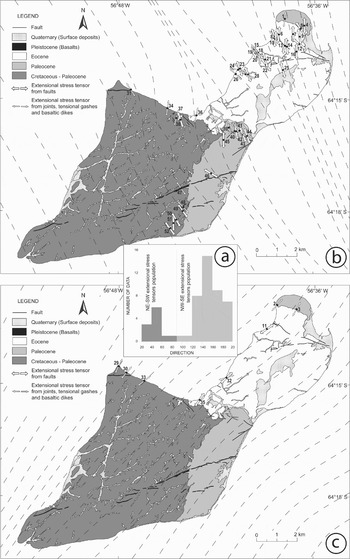
The results obtained from the interpolation program LISSAGE (Lee & Angelier Reference Lee and Angelier1994) permitted the σ3 trajectory in Seymour Island to be mapped from the Cenozoic until recent times (Fig. 4). Two NW–SE and NE–SW minor horizontal stress trajectory directions mapped separately explain the stress directions obtained from our fault population analysis.
a. Histogram of the orientation distribution of extensional stress tensors obtained from analysis of brittle mesostructures on Seymour Island. b. NW–SE extensional stress trajectories. c. NE–SW extensional stress trajectories.

A NW–SE extensional stress field fits with the geodynamic evolution proposed for the Bransfield Trough (Barker & Austin Reference Barker and Austin1994, Lawver et al. Reference Lawver, Sloan, Barker, Ghidella, VonHerzen, Keller, Klinkhamer and Chin1996, Galindo-Zaldívar et al. Reference Galindo-Zaldívar, Jabaloy, Maldonado and Sanz de Galdeano1996, González-Casado et al. Reference Gónzalez-Casado, Giner and López-Martínez2000); in the South Shetland Block (González-Casado et al. Reference González-Casado, López-Martínez and Durán1999, Galindo-Zaldívar et al. Reference Galindo-Zaldívar, Gamboa, Maldonado, Nakao and Bochu2006a, Maestro et al. Reference Maestro, Somoza, Rey, Martínez-Frías and López-Martínez2007); in the South Scotia Ridge (Pelayo & Wiens Reference Pelayo and Wiens1989, Galindo-Zaldívar et al. Reference Galindo-Zaldívar, Jabaloy, Maldonado and Sanz de Galdeano1996, Reference Galindo-Zaldívar, Gamboa, Maldonado, Nakao and Bochu2006a, Thomas et al. Reference Thomas, Livermore and Pollitz2003, Giner-Robles et al. Reference Giner-Robles, Gonzalez-Casado, Gumiel, Martin-Velazquez and Garcia-Cuevas2003, Eagles et al. Reference Eagles, Livermore and Morris2006); and in the north-western sector of Weddell Sea (González-Ferrán Reference González-Ferrán, Oliver, James and Jago1983, Bohoyo et al. Reference Bohoyo, Galindo-Zaldívar, Maldonado, Schreider and Suriñach2002). A NE–SW extensional stress field is also consistent with models proposed by González-Casado et al. (Reference González-Casado, López-Martínez and Durán1999) and Maestro et al. (Reference Maestro, Somoza, Rey, Martínez-Frías and López-Martínez2007) for Deception and Livingston islands and by Rodríguez-Fernández et al. (Reference Rodríguez-Fernández, Balanya, Galindo-Zaldívar and Maldonado1997) for Powell Basin.
Data comparison and discussion
The detection of two main σ3 orientations, in addition to other minima (like NNE–SSW, Fig. 3b), in the northern Antarctic Peninsula region during the Cenozoic has given rise to several different interpretations (e.g. Barker Reference Barker1982, King & Barker Reference King and Barker1988, Galindo-Zaldívar et al. Reference Galindo-Zaldívar, Jabaloy, Maldonado and Sanz de Galdeano1996, Rodriguez-Fernández et al. 1997, González-Casado et al. Reference Gónzalez-Casado, Giner and López-Martínez2000, Maestro et al. 2006). Similarly, disagreements in relationship between local tectonic stresses and the broad-scale Scotia Plate present-day stress field are observed in this sector (Giner-Robles et al. Reference Giner-Robles, Gonzalez-Casado, Gumiel, Martin-Velazquez and Garcia-Cuevas2003). The overall extension regime of the northern Antarctic Peninsula area is complex due to changes in the orientation of the Scotia–Antarctic plate boundary, that produced extensional and compressional local stress regimes along it (Bohoyo et al. Reference Bohoyo, Galindo-Zaldívar, Jabaloy, Maldonado, Rodríguez-Fernández, Schreider, Suriñach, Cunningham and Mann2007). To explain the tectonic stress states described here in an intraplate deformation context we compared them with the Cenozoic and present-day stress fields established in neighbouring areas of the Antarctic Peninsula.
Cenozoic stress field
Palaeostress evolution of the northern Antarctic Peninsula during the Cenozoic is attributed to an extensional regime with minor compressional episodes (Maestro et al. 2007). There are two competing models: a) opening of James Ross and Bransfield basins with NW–SE σ3 direction related to subduction of the former Phoenix Plate and consequent rollback of the South Shetland Trench (Barker Reference Barker1982, González-Ferrán Reference González-Ferrán, Oliver, James and Jago1983, Maldonado et al. Reference Maldonado, Larter and Aldaya1994, Lawver et al. Reference Lawver, Sloan, Barker, Ghidella, VonHerzen, Keller, Klinkhamer and Chin1996), b) dextral movement of the Antarctic relative to the proto South Scotia plates during late Eocene to early Miocene causing oblique NE–SW extension along the northern Antarctic Peninsula continental margin. This movement compartmentalized the Antarctic Peninsula and probably caused the South Orkney microcontinent to drift away toward north-east of the Antarctic Peninsula forming the WNW–ESE oriented Powell Basin (Galindo-Zaldívar et al. Reference Galindo-Zaldívar, Jabaloy, Maldonado and Sanz de Galdeano1996, Rodríguez-Fernández et al. Reference Rodríguez-Fernández, Balanya, Galindo-Zaldívar and Maldonado1997, Eagles & Livermore Reference Eagles and Livermore2002).
The extensional regime with a NE–SW direction that developed the Powell Basin also affected to the western margin of the Antarctic Peninsula. The Eocene deposits of Seymour Island fill a WNW–ESE oriented incised-shelf valley (Porebski Reference Porebski2000) developed mainly by local subsidence along fault-controlled valley margins perpendiculars to the Powell Basin opening direction. Angular unconfomities indicate that warping of valley margin fill occurred at the earliest during lower Eocene to possibly lower Oligocene times (Porebski Reference Porebski2000). Likewise, on Snow Hill Island a subparallel group of minor WNW–ESE striking extensional faults dissect the Spath Peninsula, affecting Campanian–Danian deposits. The stratigraphic offset between Snow Hill and Seymour islands could be the reflection of a fault of the same trend within Picnic Passage (Pirrie et al. Reference Pirrie, Crame, Lomas and Riding1997). Finally, on southern James Ross Island, faults have been observed with downthrow to the north-east, along with fractures cemented by coarse sparry calcite oriented NW–SE, affecting late Campanian deposits (Pirrie et al. Reference Pirrie, Crame, Lomas and Riding1997). In both, Snow Hill and James Ross islands, these faults could be related to a NE–SW oriented extensional stress field.
Recent and present day stress field
Extrapolation of present-day stress orientation data from earthquake focal mechanisms located in South Shetland Trench and on South Scotia Ridge from the World Stress Map (www.world-stress-map.org), US Geological Survey National Earthquake Information Center (NEIC) and Harvard Seismology Centroid Moment Tensor Catalog (Dziewonski et al. Reference Dziewonski, Chou and Woodhouse1981) from 1973 to the present, suggest NE–SW compression (Fig. 1) related to left-lateral strike slip movement between the Scotia Plate and South American and Antarctic plates and perpendicular SE–NW subhorizontal extension (Pelayo & Wiens Reference Pelayo and Wiens1989, Galindo-Zaldívar et al. Reference Galindo-Zaldívar, Jabaloy, Maldonado and Sanz de Galdeano1996, González-Casado et al. Reference Gónzalez-Casado, Giner and López-Martínez2000, Robertson et al. Reference Robertson, Wiens, Shore, Vera and Dorman2003, Giner-Robles et al. Reference Giner-Robles, Gonzalez-Casado, Gumiel, Martin-Velazquez and Garcia-Cuevas2003, Maestro et al. Reference Maestro, Somoza, Rey, Martínez-Frías and López-Martínez2007).
The Bransfield Strait region is characterized at present by NW–SE subhorizontal extension, with a steep σ1 inclination towards the SW. The stress field along the South Scotia Ridge is also very similar to the one deduced for Bransfield Strait, but multichannel seismic profiles and earthquake focal mechanisms analysis shows mainly alternating kinematically partitioned zones of pure strike-slip or extensional strain, consistent with formation of pull-apart basins (Acosta & Uchupi Reference Acosta and Uchupi1996) and the transtensional character of this boundary (Galindo-Zaldivar et al. 1996, Thomas et al. Reference Thomas, Livermore and Pollitz2003, Giner-Robles et al. Reference Giner-Robles, Gonzalez-Casado, Gumiel, Martin-Velazquez and Garcia-Cuevas2003, Bohoyo et al. Reference Bohoyo, Galindo-Zaldívar, Jabaloy, Maldonado, Rodríguez-Fernández, Schreider, Suriñach, Cunningham and Mann2007). On the other hand, the linking area between the South Shetland Islands and South Scotia Ridge is tectonically complex. Earthquakes located in the southern part of this zone are associated with reverse and oblique-reverse faults with an E–W σ1 orientation near the north-eastern end of the South Shetland Block (Giner-Robles et al. Reference Giner-Robles, Gonzalez-Casado, Gumiel, Martin-Velazquez and Garcia-Cuevas2003). This orientation has been interpreted as the result of extension produced in Bransfield basin, which would cause a local compressive stress field in the northern part of the area subject to extension (González-Casado et al. Reference Gónzalez-Casado, Giner and López-Martínez2000). Toward the north of this area, two seismic events have been studied, located along the Shackleton Fracture Zone, with a σ1 trending NE–SW, related to convergent deformation (Maldonado et al. Reference Maldonado, Balanyá, Barnolas, Galindo-Zaldívar, Hernández, Jabaloy, Livermore, Martínez, Rodríguez-Fernández, Sanz deGaldeano, Somoza, Suriñach and Viseras2000).
Geodetic studies have determined recent tectonic displacement rates in the South Shetland Block and the Antarctic Peninsula. Movement of the South Shetland Block has been calculated at about 17 mm yr-1 NNE; displacement of the Antarctic Peninsula at about 15 mm yr-1 NE (Dietrich et al. Reference Dietrich, Rülke, Ihde, Lindner, Miller, Niemeier, Schenke and Seeber2004). Moreover, crustal movements or spreading rates in Bransfield Trough are estimated to be 5–20 mm yr-1 NW–SE (Dietrich et al. Reference Dietrich, Dach, Engelhardt, Heck, Kutterer, Lindner, Mayer, Menge, Mikolaiski, Niemeier, Pohl, Salbach, Schenke, Schöne, Seeber, Soltau and Dietrich1996). These crustal movement directions are compatible with the stress field orientation determined on the basis of fault population and earthquake focal mechanism analysis carried out in the north-west Antarctic Peninsula cited above.
Geodynamic model
The geodynamic framework for explaining the extensional stresses recorded from Cenozoic rocks of Seymour Island is complex because two subperpendicular σ3 directions are superimposed. The general regime of the Scotia Arc region, as a whole, is transcurrent with compressional and extensional sectors, as in the study area (Pelayo & Wiens Reference Pelayo and Wiens1989, Galindo-Zaldívar et al. Reference Galindo-Zaldívar, Jabaloy, Maldonado and Sanz de Galdeano1996, Maldonado et al. Reference Maldonado, Balanyá, Barnolas, Galindo-Zaldívar, Hernández, Jabaloy, Livermore, Martínez, Rodríguez-Fernández, Sanz deGaldeano, Somoza, Suriñach and Viseras2000, Lee et al. Reference Lee, Jin, Kim and Nam2000, Giner-Robles et al. Reference Giner-Robles, Gonzalez-Casado, Gumiel, Martin-Velazquez and Garcia-Cuevas2003, Bohoyo et al. Reference Bohoyo, Galindo-Zaldívar, Jabaloy, Maldonado, Rodríguez-Fernández, Schreider, Suriñach, Cunningham and Mann2007). Major NW–SE rifting processes during the Late Cretaceous to Quaternary developed extensional basins in the Antarctic Peninsula area:
i) James Ross Basin, in eastern Antarctic Peninsula, has been interpreted as a back-arc basin associated with the NE–SW oriented magmatic arc in the Antarctic Peninsula area (Macdonald et al. Reference Macdonald, Barker, Garrett, Ineson, Pirrie, Storey, Whitham, Kinghorn and Marshall1988). This, possibly passive, margin, originated simultaneously with the opening of the Weddell Sea during the early stages of Gondwana dispersal, and is related to a large extent to subduction of oceanic lithosphere below continental masses along the Pacific side of Gondwana (Parra et al. Reference Parra, GonzálezFerrán and Bannister1984, Garrett & Storey Reference Garrett, Storey, Coward, Dewey and Hancock1987). James Ross Basin fill, a 6–7 km thick, mega-regressive clastic sequence of Barremian–Eocene age (Macdonald et al. Reference Macdonald, Barker, Garrett, Ineson, Pirrie, Storey, Whitham, Kinghorn and Marshall1988), is derived from the active proximal magmatic arc to the west. Volcanism has been intermittent from Jurassic to Palaeocene or Eocene times (Hathway Reference Hathway2000), and
ii) NE trending, elongate Bransfield Basin, at the north-western tip of the Antarctic Peninsula, lies between its Pacific margin and South Shetland Block. A back-arc basin, it was formed at 4–1.3 Ma (Roach Reference Roach1978) as a result of the rollback effect associated with the sinking of the former Phoenix plate under the Antarctic Plate (Jeffers et al. Reference Jeffers, Anderson, Lawver, Thomson, Crame and Thomson1991, Barker & Austin Reference Barker and Austin1994, Maestro et al. Reference Maestro, Somoza, Rey, Martínez-Frías and López-Martínez2007). Seismic reflection studies suggest the presence of: igneous basement, interpreted as thinned continental crust intruded by plutonic dikes and volcanic rocks (Ashcroft Reference Ashcroft1972, Guterch et al. Reference Guterch, Grad, Janik, Perchuc, Thomson, Crame and Thomson1991); sedimentary basement composed of tectonized sedimentary material, probably corresponding to 1) the Miers Bluff Formation (early Triassic, Willan et al. Reference Willan, Pankhurst and Hervé1994) in the South Shetland Islands margin (Hobbs Reference Hobbs1968), and to 2) the Trinity Peninsula Group (Carboniferous–Triassic) in the Antarctic Peninsula margin (Hyden & Tanner Reference Hyden and Tanner1981); and Pliocene–Quaternary sedimentary cover of two main sequences separated by a prominent regional unconformity (Gamboa & Maldonado Reference Gambôa, Maldonado and John1990).
The evolution of these two basins, Bransfield and James Ross basins, is closely related. During the Mesozoic and most of the Cenozoic the Antarctic Peninsula was an active margin (Barker & Lawver Reference Barker and Lawver1988). The opening of the James Ross Basin is related to subduction of former Phoenix Plate oceanic crust under the Antarctic Plate. If we take into account the studies related to subduction styles depending only on the orientation of sinking slab (Doglioni Reference Doglioni1995) we could determined that the former Phoenix Plate is sinking toward the east at a low angle beneath the Antarctic Plate. Usually these type of subduction processes are not conducive to development of a back-arc basin, however if the hanging-wall plate is overriding at different velocities it is possible that a so called “back-arc basin” may develop (Doglioni Reference Doglioni1995). The relative motion of the Weddell Sea and East Antarctica toward the NNW and the Antarctic Peninsula toward the north-west, during upper Cretaceous to Eocene, caused differential velocities between the hanging-wall plates, enabling faster motion of the Antarctic Peninsula north-westward relative to the Weddell Sea and East Antarctica resulting in extension in the overriding plate. This explains the absence of evidence of elevated heat flow (Ineson Reference Ineson1989) typical of most back-arc basins. At about 4 Ma, when the Phoenix Plate became part of the Antarctic Plate (Barker Reference Barker1982), spreading at Phoenix ridge had stopped or, if it continued, it did so only very slowly. Although spreading had stopped, subduction continued, probably driven in the main by the weight of the subducted slab (Jeffers et al. Reference Jeffers, Anderson, Lawver, Thomson, Crame and Thomson1991, Barker & Austin Reference Barker and Austin1994, Maestro et al. Reference Maestro, Somoza, Rey, Martínez-Frías and López-Martínez2007). According to Larter & Barker (Reference Larter and Barker1991) the rollback effect associated with this sinking plate induced NW–SE extensional stresses in the overlying plate bringing about the opening of Bransfield Basin and the separation of the South Shetland Block. The extensional horizontal stress of the predicted intraplate stress field trends NW–SE, which explains the majority of palaeostress data obtained in this work.
On the other hand, deformation of the north-eastern end of the Antarctic Peninsula is due to fragmentation of continental crust blocks from tectonic activity along the left-lateral transcurrent movement boundary of Antarctic and Scotia plates (Galindo-Zaldívar et al. Reference Galindo-Zaldívar, Jabaloy, Maldonado and Sanz de Galdeano1996). The South Orkney microcontinent, located at the north-eastern end of the Antarctic Peninsula, the largest fragment of continental crust in the South Scotia Ridge (King & Barker Reference King and Barker1988), is considered to be an Antarctic Peninsula fragment. Its north-eastwards drift, probably in the late Eocene–Oligocene, led to the NE–SW extension of the South Orkney microcontinent and Powell Basin opening (King & Barker Reference King and Barker1988, King et al. Reference King, Leitchenkov, Galindo-Zaldívar and Maldonado1994, Rodríguez-Fernández et al. Reference Rodríguez-Fernández, Balanya, Galindo-Zaldívar and Maldonado1997, Eagles & Livermore Reference Eagles and Livermore2002). This NE–SW extensional stress regime, recorded in James Ross Basin, is consistent with Eocene development of the incised shelf-valley systems there (Porebski Reference Porebski2000).
The reverse faults, identified only in three site within Eocene outcrops, are characterized by centrimetric slip and they have been used to determine three stress tensors with E–W, NW–SE and NNE–SSW. The scarcity of compressional structures have not made it possible to establish a link between them and the geodynamic evolution of this area. The compressional stress states established in Seymour Island could be related to an increase, from active margins (South Shetland Trench and South Scotia Ridge) to intraplate regions, of relative stress magnitudes or due to uplift isostatic processes associated with Antarctic ice sheet retreat during the Quaternary.
Conclusions
Analysis of brittle mesostructures in upper Cretaceous–Quaternary sediments enables characterization of the Cenozoic–Recent tectonic stress field on Seymour Island. Most stress tensors correspond to extensional ellipsoids, although several compressional tensors were found. Two main modes of scattered σ3 orientation trend NE–SW and NW–SE have been determined.
This widespread extensional regime can be related to major late Cretaceous–Quaternary rifting in the Antarctic Peninsula area, which developed the James Ross and Bransfield extensional back-arc basins. Stress states with NW–SE trending σ3 are compatible with the dominant pattern established for recent tectonic evolution in the northern Antarctic Peninsula and the South Scotia Ridge, a result of both subduction (and rollback) of the former Phoenix Plate and left-lateral movement of the southern Scotia Plate boundary with the South Shetland Trench. However, inconsistency of stress states (with NE–SW orientation of σ3) with the current stress field direction in this area suggests that stress sources other than broad-scale forces control the prevailing stress field. Drifting of South America and the northern Antarctic Peninsula along the left-lateral transcurrent faults caused fragmentation of the Antarctic Peninsula during the Eocene–Oligocene. Close to the study area, these processes induced a NE–SW extensional stress direction that developed Powell Basin by eastward movement of the South Orkney microcontinent relative to the Antarctic Peninsula. This extensional stage was widespread in the north-western part of the Weddell Sea.
Finally, the compressional stress states established in Seymour Island could be related to the increase, from active margins to intraplate regions, of relative stress magnitudes or due to glacio-isostatic uplift processes during the Quaternary.
Acknowledgements
We thank Alan P.M. Vaughan, Jesús Galindo-Zaldivar and Mike Curtis for providing corrections and constructive comments that significantly improved the manuscript. We would like to acknowledge the Instituto Antártico Argentino and Fuerza Aérea Argentina for field support. This work has been partially supported by the Instituto Geológico y Minero de España (Geological Survey of Spain) and the project CGL2005-03256/ANT of the Spanish Ministry of Education and Science.