Introduction
In the modern world, transparent conductors (TCs) are extremely common. They are generally found as thin films that have low electrical resistance but are optically transparent and are critically important in many modern electronic devices. In the home or office, they are found in flat panel displays such as in TVs, laptops or digital cameras, as smart windows, heat shields in some oven windows, and as invisible security circuitry on glass windows. They defrost windows in planes, trains, and automobiles and are used in self-dimming rearview mirrors in cars. They are also used in portable electronic devices (phones, tablet computers) that affect our daily lives. Many people hope that as electrodes in solar cells, they will help generate clean, renewable energy.
Modern TC technology is dominated by doped metal oxides, of which the most important is tin-doped indium oxide (ITO).Reference Batzill and Diebold1–Reference Hecht, Hu and Irvin3 This material has been studied for 80 yearsReference Hecht, Hu and Irvin3 and has been largely optimized for a range of properties. For example, while metal oxide TCs can display transmittances as high as 95% and sheet resistances as low as 3 Ω/sq, they also have a range of other useful properties, such as work functions that vary between 4.2 and 5.3 eV, depending on the material, thermal stability, and chemical and mechanical durability.Reference Gordon2 In fact, metal oxides are model materials for transparent electrodes. However, even model systems may fall victim to issues related to limited supply and ever growing demand.
Partly due to the rapid growth in portable electronics, the demand for ITO is currently growing at 20% per annum. Due to a combination of this demand and the already limited supply, the cost of indium and hence ITO has risen dramatically in recent years (see Reference Reference Hecht, Hu and Irvin3 and references therein). Furthermore, metal oxides have another weakness: brittleness.Reference Cairns and Crawford4–Reference Leterrier, Medico, Demarco, Manson, Betz, Escola, Olsson and Atamny7 It is thought that a significant fraction of future displays will be plastic-based and inherently flexible. As metal oxides tend to fracture at strains of ∼2%, they are completely unsuitable for use in such flexible electronics. Other problems with metal oxides include their high refractive index and the high cost of producing large area metal oxide coated glass.
Thus, it is clear that new transparent conducting materials are required. These must have a number of specific properties: they must retain their electrical conductivity after repeated flexing; it must be possible to deposit them over large areas using low-temperature processing; they must have deposition and material costs comparable to ITO; and, most importantly, they must match ITO in terms of optoelectrical properties. For example, it must be possible to form these materials into films with T > 90%. This is not challenging, as any material can be made extremely transparent just by making it sufficiently thin. The most difficult goal is finding a material that has high enough electrical conductivity such that, even when formed in a very thin film, it displays sheet resistance low enough to be useful.
How low is low enough? ITO fulfills a wide range of roles, all of which require high transparency. However, each role has a particular resistance requirement, with the entire set spanning a wide range. For example, conducting films for static dissipation can function with a sheet resistance of >1 kΩ/sq;Reference Gordon2 touch screens generally require a few hundred Ω/sq;Reference Hecht, Hu and Irvin3 electrodes require a few tens of Ω/sq;Reference den Boer and Smith8 while, to minimize resistive losses, solar cell electrodes require sheet resistances of <10 Ω/sq.Reference Rowell and McGehee9 We make the assumption that it will not be difficult to find materials that fulfill the less stringent, high sheet resistance applications. For example, a range of nanostructured materials have achieved transmittance above 90% coupled with sheet resistance above 1 kΩ/sq. However, achieving transmittance above 90% coupled with sheet resistance below 200 Ω/sq has proven much more difficult. Thus, in this article, we focus on the search for high-performance, solution-processed TCs that are usually, and somewhat arbitrarily, defined as those with a transmittance of T ≥ 90% and a sheet resistance of R s ≤ 100 Ω/sq.Reference Scardaci, Coull, Lyons, Rickard and Coleman10
In the race to develop materials that fulfill these criteria, many researchers have focused on networks of conducting nanomaterials such as carbon nanotubes (CNTs),Reference Schrage and Kaskel11–Reference Doherty, De, Lyons, Shmeliov, Nirmalraj, Scardaci, Joimel, Blau, Boland and Coleman35 metal nanowires,Reference De, Higgins, Lyons, Doherty, Nirmalraj, Blau, Boland and Coleman36–Reference Hu, Kim, Lee, Peumans and Cui42 and disordered arrays of exfoliated graphene flakes.Reference Becerril, Mao, Liu, Stoltenberg, Bao and Chen43–Reference Green and Hersam63 Such networks are particularly useful, as they can be deposited at low temperatures from solution using industry-friendly techniques such as spraying.Reference Geng, Kim, So, Lee, Chang and Lee14, Reference Madaria, Kumar and Zhou39, Reference Blake, Brimicombe, Nair, Booth, Jiang, Schedin, Ponomarenko, Morozov, Gleeson, Hill, Geim and Novoselov44, Reference Geng, Lee, Kim, Han, Park and Lee64, Reference Scardaci, Coull and Coleman65 Taking nanotube networks as an example, because adjacent tubes interact only weakly, intertube junctions can move locally under strain. As intertube charge transport is independent of junction position, the electrical properties tend to be independent of strain, resulting in great electrical stability under flexing.Reference De, Lyons, Sorrel, Doherty, King, Blau, Nirmalraj, Boland, Scardaci, Joimel and Coleman13, Reference Doherty, De, Lyons, Shmeliov, Nirmalraj, Scardaci, Joimel, Blau, Boland and Coleman35, Reference De, Higgins, Lyons, Doherty, Nirmalraj, Blau, Boland and Coleman36, Reference De, King, Lotya, O’Neill, Doherty, Hernandez, Duesberg and Coleman46 In addition, extremely sparse networks can be produced, resulting in very high transmittances.Reference Scardaci, Coull and Coleman65 Indeed, such nanostructured networks look ideal as future ITO replacement materials. However, there is one outstanding problem; very few previous studies have demonstrated nanostructured networks that are thin enough to display T ≥ 90% and R s ≤ 100 Ω/sq.Reference Lee, Connor, Cui and Peumans37, Reference Madaria, Kumar and Zhou39, Reference Wu, Hu, Rowell, Kong, Cha, McDonough, Zhu, Yang, McGehee and Cui41
Thus, it is critical to assess the progress in the field. In this work, we will compare the published performance of transparent conductors produced from networks of single-walled carbon nanotubes (SWNTs),Reference Schrage and Kaskel11–Reference Doherty, De, Lyons, Shmeliov, Nirmalraj, Scardaci, Joimel, Blau, Boland and Coleman35 graphene flakes,Reference Becerril, Mao, Liu, Stoltenberg, Bao and Chen43–Reference Green and Hersam63 and metallic nanowiresReference Scardaci, Coull, Lyons, Rickard and Coleman10, Reference De, Higgins, Lyons, Doherty, Nirmalraj, Blau, Boland and Coleman36–Reference Hu, Kim, Lee, Peumans and Cui42 (see supporting information for detailed tabulated data). Keeping in mind the requirement for low-temperature, large-area deposition, we will focus on solution-processed networks. We will demonstrate which materials are most promising and show that to demonstrate high performance, it is important to have both the correct materials and the correct network properties.
Bulk versus percolative behavior
Researchers have been studying nanostructured materials for transparent electrodes for over six years.Reference Hu, Hecht and Gruner15, Reference Wu, Chen, Du, Logan, Sippel, Nikolou, Kamaras, Reynolds, Tanner, Hebard and Rinzler16, Reference Saran, Parikh, Suh, Munoz, Kolla and Manohar66 The technology is now mature enough to compare and contrast the various materials under study. It is often helpful to use figures of merit (FoM) to express the performance of a given film type and facilitate comparison with other data sets. The most useful FoMs are those that are based on the physics of the system under study. For example, FoMs for TCs should link the film transmittance, T, to its sheet resistance, R s. This is done by combining physical expressions for transmittance and sheet resistance of thin films, both as a function of thickness, t. For example, the transmittance can be expressed asReference Dressel and Gruner67

where Z 0 is the impedance of free space (377 Ω), and σop is the optical conductivity (related to the absorption coefficient α as σop ≈ α/Z 0).Reference Dan, Irvin and Pasquali12 By combining this expression with the definition of sheet resistance (for a bulk-like film):

(σdc,B is the bulk dc conductivity of the film) to eliminate t, one obtains a relationship between T and R s:

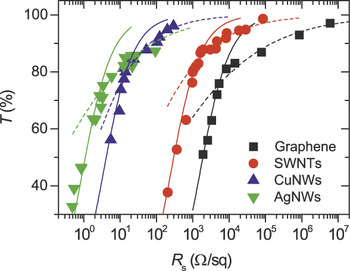
Note that this expression is appropriate for a bulk-like material (i.e., one whose dc conductivity is invariant with sample thickness). The conductivity ratio σdc,B/σop is often used as a FOM for transparent conductors as high values of σdc,B/σop lead to films with high T and low R s. In fact, a material with a given value of σdc,B/σop can be formed into films with a range of T and R s values depending on the thickness. Thus in practice, researchers generally prepare films with a range of thicknesses, measure R s and T for each thickness, and then fit the (T, R s) data to Equation 3 to extract σdc,B/σop. Examples of this procedure are shown in Figure 1. Here, transmittance is plotted as a function of sheet resistance for thin films of graphene,Reference Tien, Huang, Yang, Wang and Ma55 SWNTs,Reference Southard, Sangwan, Cheng, Williams and Fuhrer34 Cu nanowires,Reference Wu, Hu, Rowell, Kong, Cha, McDonough, Zhu, Yang, McGehee and Cui41 and Ag nanowires.Reference De, Higgins, Lyons, Doherty, Nirmalraj, Blau, Boland and Coleman36 In each case, the bottom left portion of the data (corresponding to thicker films) is fit to Equation 1 (solid lines), giving values of σdc,B/σop of 0.25, 1.5, 110, and 415, respectively. Usually these numbers are assumed to encode all the relevant information about the optoelectrical properties of these films. In order to achieve the target of T ≥ 90% and R s ≤ 100 Ω/sq, Equation 3 can be used to show that σdc,B/σop ≥ 35 is required. This is the first criterion for a high-performance transparent conductor.
Typical graph of transmittance (generally measured at ∼550 nm) plotted versus sheet resistance for thin films of nanostructured materials. Note that each curve can be divided into two regimes, the bulk regime (the solid line is a fit to Equation 3) and the percolation regime (the dashed line is a fit to Equation 5).Reference Southard, Sangwan, Cheng, Williams and Fuhrer34, Reference Wu, Hu, Rowell, Kong, Cha, McDonough, Zhu, Yang, McGehee and Cui41, Reference Tien, Huang, Yang, Wang and Ma55, Reference Green and Hersam63

However, looking carefully at the fits in Figure 1, it is clear that the data tend to deviate severely from the fits for thinner (more transparent) films. This deviation has been observed beforeReference De, Lyons, Sorrel, Doherty, King, Blau, Nirmalraj, Boland, Scardaci, Joimel and Coleman13, Reference Geng, Kim, So, Lee, Chang and Lee14, Reference Doherty, De, Lyons, Shmeliov, Nirmalraj, Scardaci, Joimel, Blau, Boland and Coleman35, Reference De, Higgins, Lyons, Doherty, Nirmalraj, Blau, Boland and Coleman36, Reference De, King, Lotya, O’Neill, Doherty, Hernandez, Duesberg and Coleman46, Reference De, King, Lyons, Khan and Coleman68 and tends to occur for films with T between 50% and 92% (see later in text). This is important because applications requiring TCs usually require T ≥ 90%. Thus, σdc,B/σop fails to describe the relationship between T and R s in the technologically relevant regime. This means that in many cases, σdc,B/σop, or indeed any FoMs based on bulk properties, are not entirely appropriate, particularly when high transparency is required. Recently, it has been shown that the deviation from bulk-like behavior as described in Equation 1, can be explained by percolation effects.Reference De, King, Lyons, Khan and Coleman68 Such effects become important for very sparse networks of nanoconductors. When the number of nanoconductors per unit is very low, a continuous conducting path from one side of the sample to the other will generally not exist. As more nanoconductors are added, at some point (the percolation threshold) the first conducting path will be formed. As more material is added, more conductive paths are formed, and the conductivity of the network increases rapidly. Eventually it reached a “bulk-like” value above which it remains constant. Percolation theory describes how the dc conductivity of sparse networks depends on network thickness and predicts a non-linear, power law dependence:Reference Stauffer and Aharony69

where t is the estimated thickness of the network, tc is the thickness associated with the percolation threshold, and n is the percolation exponent. This leads to a new relationship between T and R s, which applies to thin, transparent networks:Reference De, King, Lyons, Khan and Coleman68

where Π is the percolative FoM:

Here, t min is the thickness below which the dc conductivity becomes thickness dependent (i.e., Equation 5 applies below t min but Equation 3 applies above t min). Analysis of these equations shows that large values of Π but low values of n are desirable to achieve low R s coupled with high T.Reference De, King, Lyons, Khan and Coleman68 Furthermore, networks of nanostructures show values of t min, which scale closely with the nanostructures’ smallest dimension, D: t min ≈ 2.33D.Reference De, King, Lyons, Khan and Coleman68 The high T portion of data in Figure 1 were fitted using Equation 5. In all cases, good fits allow the calculation of both n and Π. It is clear from this analysis that knowledge of n and Π is critical to understanding the behavior of thin networks of nanostructured materials (i.e., those in the technologically relevant regime). However, while n is a fundamental property of the network, looking at Equation 6, we note that Π is a composite parameter that is related to σdc,B/σop. This means that while σdc,B/σop does not directly control T and R s in the high T regime, it is certainly of indirect importance. In this article, we describe both σdc,B/σop and the percolation parameters, n and Π, for a range of previously reported nanostructured TCs.
Analysis of literature data
The aim of this article is to assess the relative merits and to understand the limitations of the nanomaterials commonly used to prepare TCs. To this end, we extracted data for (R s, T) from a range of studies describing transparent conducting properties of thin films of graphene, SWNTs, and metallic nanowires (tabulated data are included in the supporting information). The graphene data included films of solution-cast reduced graphene oxide and surfactant exfoliated graphene but no vapor grown graphene. In the majority of cases, the data contained both bulk and percolation regimes. Each regime was fitted to the relevant equation (3 or 5) and values for σdc,B/σop, n and Π were extracted. We note that we have not analyzed every paper in the literature; however, we hope that the range of papers studied and cited herein roughly captures the current state of the field.
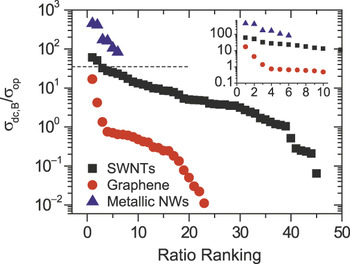
We begin by looking at the extracted values of σdc,B/σop. For each material, the conductivity ratio was ranked from highest (i.e., number 1) to lowest (i.e., number 45 for nanotubes). The position in this ranking list is known as the ratio ranking. The conductivity ratio values are plotted as a function of ratio ranking in Figure 2. In the case of solution-processed graphene, there is significant variation with σdc,B/σop ranging from 0.01 to ∼15. The two highest ranked results were for networks of silver nanoparticle decorated graphene sheets, so these are not, strictly speaking, graphene films. Of these samples, the most promising film had T ∼ 80% and R s ∼ 250 Ω/sq. We note that the highest graphene-only film displayed σdc,B/σop ∼ 1.3. The relatively poor performance of graphene networks is due to a combinationReference De and Coleman45 of low dc conductivity due to resistive inter-flake junctionsReference Nirmalraj, Lutz, Kumar, Duesberg and Boland70 and the high optical conductivity of graphene.Reference Nair, Blake, Grigorenko, Novoselov, Booth, Stauber, Peres and Geim71 In the case of nanotubes, the spread is significantly less, with σdc,B/σop values ranging from ∼0.1 to ∼60. The best sample was for nanotubes deposited from superacids whose most promising film displayed T ≈ 91% and R s ≈ 60 Ω/sq.Reference Hecht, Heintz, Lee, Hu, Moore, Cucksey and Risser72 Looking at the 10 best values (Figure 2 inset), it is clear that the spread is very tight, with the top 10 varying in σdc,B/σop from 12 to 60. This reflects the relative maturity of nanotube-based transparent conductor research and may suggest that this technology is approaching physical limits, possibly set by the high inter-nanotube junction resistance.Reference Nirmalraj, Lyons, De, Coleman and Boland73 Turning to the data for metallic nanowire networks, while there are relatively few papers on these materials, the σdc,B/σop values are very impressive, ranging from 106 to 453. We note that the sample with the highest σdc,B/σop was a spray cast silver nanowire network, whose best film displayed T ≈ 85% and R s ≈ 33 Ω/sq.Reference Madaria, Kumar and Zhou39 However, we note that a sample with lower σdc,B/σop (but no percolative regime, see later in text) included one film with even more impressive properties: T ≈ 89% and R s ≈ 20 Ω/sq.Reference Madaria, Kumar, Ishikawa and Zhou38 The high values observed here are due to a combination of low inter-wire junction resistanceReference De, Higgins, Lyons, Doherty, Nirmalraj, Blau, Boland and Coleman36, Reference Lee, Connor, Cui and Peumans37 and low optical conductivity of these networks.Reference De, Higgins, Lyons, Doherty, Nirmalraj, Blau, Boland and Coleman36
Bulk dc to optical conductivity ratio plotted in order of ratio ranking for solution-processed thin films prepared from metallic nanowires, single-walled carbon nanotubes, and graphene. The horizontal dashed line shows the value of σdc,B/σop = 35 required to reach the minimum industry standards of T = 90% and R s = 100 Ω/sq. The inset shows the best performing samples for each material type.

This analysis clearly shows that only networks created from SWNTs produced using non-trivial processing (i.e., superacid-based processing) or metallic nanowires have surpassed the first requirement for a high-performance TC (σdc,B/σop ≥ 35). As superacid dispersions will not readily lend themselves to industrial processing, we suggest that only metallic nanowire networks are suitable candidates for solution-processed high-performance TCs. It is worth noting that σdc,B/σop is largely a material property; it is primarily controlled by the optical and electrical properties of the nanoconductors and the potential profile of the junction between them (and thus the junction resistance). This suggests that metallic nanowires qualify as candidates for high-performance TCs, while SWNTs and graphene networks currently do not, due to their intrinsic material properties. This is important, as such intrinsic properties will not be easy to modify. On the face of it, this suggests the metallic nanowire networks to be the obvious choice. However, we note that as the properties of high transparency films of metallic nanowires may be controlled by percolation, σdc,B/σop may not accurately describe their properties. Thus, it is important to know whether technologically relevant films (i.e., T > 90%) lie in the bulk or percolative regime.
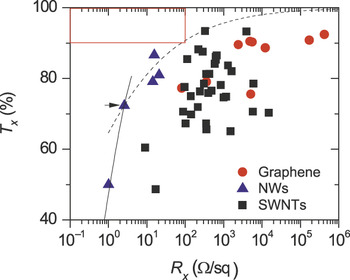
To test this, we first needed to know where the crossover from bulk to percolative behavior occurred. From the published data we extracted the transmittance, Tx, and sheet resistance, Rx, at the crossover between the bulk and percolative regimes. These data are plotted in Figure 3. From this it is clear that for all materials, the crossover occurred at transmittances between 50% and 92%. In almost all cases, Tx was below 90%, meaning that any film displaying T = 90% almost always falls in the percolative regime. In addition, with the exception of the metallic nanowire data, almost all of the Rx data were >100 Ω/sq, showing that T = 90% and R s < 100 Ω/sq cannot be achieved for the vast majority of samples.
The crossover between bulk and percolative behavior. The boundary between the bulk and percolative regimes can be characterized by the transmittance, Tx, and sheet resistance, Rx, at the crossover. These are plotted in this figure for all three materials. The meaning of this crossover is illustrated for the point marked by the arrow. To the left of each data point, T is related to Rs for that material by the bulk expression (Equation 3), as shown by the solid line. However, to the right of each point, the T(R s) data are described by the percolative expression (Equation 5), as shown by the dashed line. The red box encloses the region required by industry for electrodes for high-performance displays or solar cells.

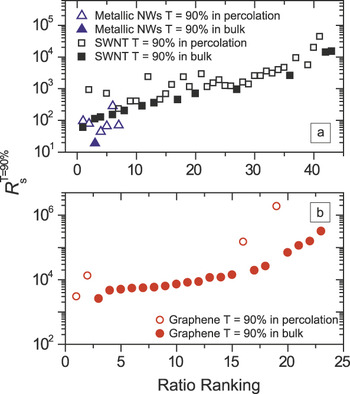
In addition, we used the published data to estimate the resistance for a film with T = 90%,  , for each data set (in some cases by extrapolation). We also noted whether the 90% film occurred in the bulk or percolative region of the (R s, T) graph. These data are plotted in Figure 4 as a function of the conductivity ratio ranking given in Figure 2. In each case, the data points where T = 90% film occurred in the bulk regime and are marked by a solid data point, while the percolation data are open circles. A number of things are of interest. First, for the various types of nanowire, the T = 90% film occurred in the percolative regime seven times out of eight. The one nanowire type that displayed no percolation regime also displayed the best individual film, reaching T ≈ 89% and R s = 20 Ω/sq, despite having a relatively low value of σdc,B/σop = 173.Reference Madaria, Kumar, Ishikawa and Zhou38 For the SWNT data, the T = 90% film occurred in the percolative regime 66% of the time, while for graphene films, the rate was only 16%. This can be explained by noting that the percolative regime applies for films with a thickness t < t min, where t min ≈ 2.33D. Here, D is the thickness of the smallest dimension of the nano-material (i.e., the diameter of the nanowire or nanotube bundle or the thickness of the graphene flake). As this dimension is generally large for nanowires (D > 50 nm), even relatively thick nanowire films can be percolative. However the thickness of a graphene flake is very small (∼nm), which means only very thin films should be percolating. SWNTs fall between these two extremes. In addition, we note that when the T = 90% film is in the bulk regime,
 scales smoothly with the ranking, as expected from Equation 3. However, for films where the T = 90% film is in the percolating regime,
 shows much more scatter (because it also depends on t min and n) and critically is always larger than would be expected for the equivalent bulk film. This illustrates the fact that percolation is very common and, when present, limits film performance.
The sheet resistance expected for a film with T = 90%,  , plotted as a function of the rankings for σdc,B/σop (see Figure 2). In each plot, the solid data represent films where T = 90% would fall in the bulk regime, while the open symbols represent films where T = 90% would fall in the percolation regime. Note that the presence of percolation always increases
 above what would otherwise be expected. To avoid clutter, we have divided the data between nanowires and nanotubes (a) and graphene (b).

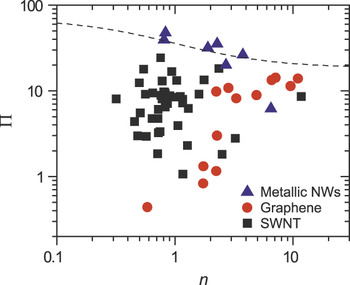
Given how often percolation is the limiting factor in nanostructured TCs, it is worth looking in more detail at Π and n, which were obtained by fitting published (R s, T) data as described previously. In Figure 5, we plot Π as a function of n, for networks of graphene, SWNTs, and metallic nanowires. The data for SWNTs are widely spread, perhaps suggesting considerable variability between nanotube types and processing methods. In contrast, the metallic nanowire and graphene data follow elongated patterns sloping downward and upward, respectively. These patterns are consistent with Equations 5 and 6 and occur for values of σdc,B/σop that are relatively high or low, respectively (typically the case for metallic nanowires or graphene networks). More importantly, by inserting T = 90% and R s = 100 Ω/sq and rearranging Equation 5, we can plot a curve that separates films with T > 90% and R s < 100 Ω/sq from those with T < 90% and R s > 100 Ω/sq. This is shown as the dashed line (i.e., for a film to display T > 90% and R s < 100 Ω/sq, its [n, Π] data must sit above this line). It is clear from these data that only the metallic nanowires surpass minimum industry standards for films where percolation controls the film properties. This is a very interesting result. It means that not only are metallic nanowires the only nanoconductors to fulfill the material requirements (i.e., σdc,B/σop ≥ 35), but they are also the only nanoconductors to form sparse networks that are capable of achieving T ≥ 90% and R s ≤ 100 Ω/sq. This is further evidence that metallic nanowires are the most promising nanoconductors for solution-processed TCs.
Percolation fit constants; the percolation figure of merit, Π, plotted as a function of the percolation exponent, n, for films of metallic nanowires, single-walled carbon nanotubes, and graphene. To achieve T > 90% and R s < 100 Ω/sq, the data must fall above the dashed line on this graph (plotted using Equations 5 and 6).

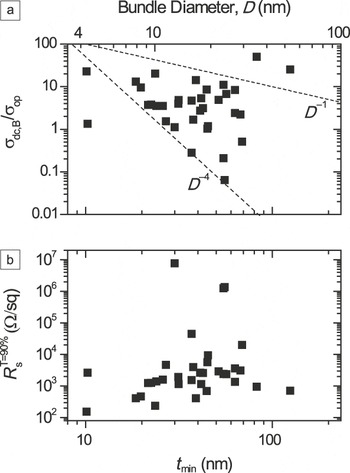
A number of papers have speculated on the dependence of the dc conductivity of networks of nanotubes on the nanotube bundle diameter. It is generally agreed that smaller diameter bundles result in more conducting paths, and therefore higher dc conductivity.Reference Hecht, Hu and Gruner74, Reference Lyons, De, Blighe, Nicolosi, Pereira, Ferreira and Coleman75 Two articles in particular have predicted power law diameter dependences: σdc,B ∝ D −n, where n has been suggested as either 2 (Reference Reference Hecht, Hu and Gruner74) or 3 (Reference Reference Lyons, De, Blighe, Nicolosi, Pereira, Ferreira and Coleman75). These are important predictions, as they suggest that films with higher σdc,B, and hence higher σdc,B/σop, could be achieved by using smaller nanotube bundles (i.e., better exfoliated tubes). However, such power law dependence has not been conclusively demonstrated.Reference Shin, Shim, Song, Kim and Hana76 The published data collected during the preparation of this review allowed the examination of this question. As shown in Figure 3, data have been collected on the transmittance at the crossover from bulk to percolative behavior, Tx. This transmittance can be related to the thickness of the network at crossover, t min via Equation 1, so long as the optical conductivity, σop, is known. While σop is not known particularly well for networks of metallic nanowires and is very scattered for graphene networks,Reference De and Coleman45 it has been measured by a number of groups to be between 15,000 and 22,000 S/m for nanotube networks.Reference Doherty, De, Lyons, Shmeliov, Nirmalraj, Scardaci, Joimel, Blau, Boland and Coleman35, Reference Geng, Lee, Kim, Han, Park and Lee64, Reference Ruzicka, Degiorgi, Gaal, Thien-Nga, Bacsa, Salvetat and Forro77, Reference Ugawa, Hwang, Gommans, Tashiro, Rinzler and Tanner78 Taking σop = 18,500 S/m, this allows us to use Equation 1 to estimate t min for a range of SWNT networks, obtaining values between 11 and 130 nm. This is of interest, as t min should approximately scale with nanotube diameter, D, as t min ≈ 2.33D. This allows us to use t min as a proxy for bundle diameter. In this way, we can examine the diameter dependence of σdc,B via that of σdc,B/σop, which we now know. Shown in Figure 6a is σdc,B/σop plotted as a function of t min for a range of SWNT networks (on the top axis is the estimated bundle diameter). Although the data are scattered (due to varying nanotube types, network morphologies), it is reasonably clear that smaller values of t min, and so smaller bundle diameter, lead to larger σdc,B/σop. In addition, it can also be seen that the data are reasonably consistent with a power law of the form σdc,B / σop ∝ D −n with 1 < n < 4. These data are consistent with both power laws previously proposed.
(a) The conductivity ratio, σdc,B/σop, and (b) the sheet resistance expected for a film with T = 90%,  , plotted as a function of t min. Here, t min is the film thickness where the transfer from bulk to percolation occurs. This was found by estimating the transmittance where the transition occurs, Tx, and using Equation 1 to convert to t min (σop = 1.85 × 10⁴ S/m in all cases). On the top axis is the estimated bundle diameter, D, calculated using t min ≈ 2.33D. In (a), the dashed lines illustrate D –4 and D –1 dependence. Note that only single-walled carbon nanotube films were considered.

However, it is important to remember that the technologically relevant parameter is not σdc,B/σop, but  . In most cases,
 is not controlled solely by σdc,B/σop but also depends on t min, σop, and n (Equations 5 and 6). Thus we test the dependence of
 on diameter in Figure 6b. From this graph, it is clear that smaller values of t min (and so smaller D) lead to lower values of
 for SWNT networks, clearly illustrating the importance of good exfoliation. Previously, we have speculated that similar rules should apply to metallic nanowire networks. However, we note that the difference here is that we simply do not know enough about the optical conductivity of such networks. For example, if the optical conductivity increases with decreasing wire diameter, this effect may cancel out much of the advantage of using low diameter nanowires.
Concluding remarks
We have reviewed current state-of-the-art transparent conducting (TC) thin films of nanoscale conductors prepared by solution processing. We have analyzed the published data for transmittance as a function of sheet resistance for networks of graphene, nanotubes, and metallic nanowires. In the majority of cases, there was a transition from bulk-like behavior to percolation behavior as the film thickness was reduced. In most cases, the technologically relevant films with T ≥ 90% lie in the percolative regime. By fitting to known models, we extracted both bulk and percolative figures of merit for all samples. We found that only networks of metallic nanowires possess high enough figures of merit to qualify as high performance TCs (i.e., T ≥ 90% and R s ≤ 100 Ω/sq). Finally, we have shown that at least for nanotube networks, the film performance scales with bundle diameter.
Networks of metallic nanowires are now very promising candidates for ITO replacement. A number of authors have reported metallic nanowire films with T ≥ 90% and R s ≤ 100 Ω/sq.Reference Lee, Connor, Cui and Peumans37, Reference Madaria, Kumar, Ishikawa and Zhou38, Reference Wu, Hu, Rowell, Kong, Cha, McDonough, Zhu, Yang, McGehee and Cui41 In addition, these films can now be produced by industrially compatible methods, such as spray coating.Reference Madaria, Kumar and Zhou39 However, a number of hurdles remain. Adhesion of solution processed Ag nanowire films to substrates has been poor,Reference De, Higgins, Lyons, Doherty, Nirmalraj, Blau, Boland and Coleman36 an issue that must be resolved before industrialization. In addition, scattering of light due to the relatively large diameter of typical nanowires (50–100 nm) results in hazeReference Hu, Kim, Lee, Peumans and Cui42 which, while good for solar cells, will be detrimental to the performance of displays. In addition, commercially available Ag nanowires tend to be coated with an organic stabilizer. This is displaced locally from the junction region during network formation, giving excellent electrical contact at junctions while the remaining organic coating protects the nanowire surface from tarnishing (i.e., oxidizing). However, the temporal stability of these coatings is unknown, and if it degrades over time, the network conductivity is likely to suffer. Finally, although some work has begun,Reference Rathmell, Bergin, Hua, Li and Wiley40, Reference Wu, Hu, Rowell, Kong, Cha, McDonough, Zhu, Yang, McGehee and Cui41 it will be necessary to demonstrate temporally stable, high-performance networks of nanowires from cheap metals such as copper. Thus, if these hurdles can be addressed, the path forward is clear; formation of networks from low diameter nanowires may result in better optoelectrical propertiesReference Lyons, De, Blighe, Nicolosi, Pereira, Ferreira and Coleman75 and should reduce haze. If the wires can be produced from copper with an appropriate, long-lasting, surface stabilizer, the next generation of high-performance TCs may be based on metallic nanowires.
Acknowledgments
We acknowledge the Science Foundation Ireland funded collaboration (SFI grant 03/CE3/M406s1) between Trinity College Dublin and Hewlett Packard, which has allowed this work to take place.