I. INTRODUCTION
Monitoring the evolution of properties of materials subjected to irradiation is a crucial aspect of nuclear safety. Irradiation can induce significant microstructural changes that have been associated with dramatic changes in properties such as fracture toughness, strength, ductility, propensity to stress corrosion cracking, or corrosion resistance. Reference Zinkle and Busby1 Predictive models would in theory be used to ensure the appropriate selection of materials and inform on the lifetime of components by capturing the relationships between irradiation conditions imposed by specific reactor designs and resulting microstructure and property changes. Fracture toughness tests and characterization of materials retrieved from active or decommissioned plants as well as surveillance programs have indeed generated large amounts of information and knowledge regarding the behaviors of irradiated materials, and steels in particular, and informed on possible extended lifetime operation (e.g., Ref. Reference Nanstad, Stoller, Miller, Sokolov and Mallison2). However, characterization of microstructures to a level of accuracy required for predictive models remains a challenge, in part due to the large number of variables (alloy composition, impurity levels, processing, irradiation conditions, etc.) that complicate the interpretation of the experimental data. The very small scale of the microstructural features formed in irradiated materials also stretches the limits of most characterization techniques. Despite these challenges, high-resolution characterization techniques, which include transmission electron microscopy (TEM), small angle neutron scattering (SANS), and atom probe tomography (APT), the latter being the focus of this article, have provided unique insights into the evolution of microstructures under irradiation, either in the context of failure analysis from materials retrieved from nuclear plants or in the context of laboratory scale studies, where high-energy protons or ions are often used as surrogates for neutrons.
The microstructural features induced by irradiation include, but are not limited to, solute clusters, second phases, chemistry of defect sinks, dislocation loops, and voids. Their presence in microstructures may be probed indirectly. For instance, voids affect material density, and the formation of clusters, phases, or dislocations can increase hardness. Alternatively, direct imaging of irradiated microstructures has traditionally been performed using TEM. However, the achievable chemical detectability and spatial resolution may be challenged by the nanometer scale dimensions of solute clusters, low levels of solute segregation, or segregation of impurities such as C. In addition, for very complex microstructures, the analysis and interpretation of TEM images taken from thin foils containing high number densities of solute clusters, nanoscale precipitates, and small dislocation loops can become nontrivial. SANS, which also is often used to characterize irradiated microstructures (e.g., Ref. Reference Sokolov, Littrell and Nanstad3), requires some prior knowledge and assumptions regarding the features being analyzed to interpret the data. Instead, APT fills the gap left by the other experimental techniques with its ability to directly image atoms and therefore local chemistry in three dimensions. APT combines time-of-flight mass spectrometry and position-sensitive detection to analyze ionized atoms that are field-evaporated from needle-shaped specimens. Each detected ion is positioned within a volume, which can be constructed and scaled based on, for instance, an inferred or measured specimen geometry, known crystallographic orientation and plane spacing, a simple projection law between the specimen and the detector, Reference Cerezo, Warren and Smith4 or on some known geometrical characteristic of the microstructure (precipitate shape, size, grain boundary position, etc.). Examples of different reconstruction approaches can be found in Ref. Reference Vurpillot, Gault, Geiser and Larson5. Depending on the instrumentation used, between 30 and 90% of the atoms are detected, chemically identified, and positioned with an accuracy which depends on the analyzed material, the local crystallographic orientation with the specimen, the selected microstructure, the relative position of the features within the microstructure and within the specimen, evaporation conditions, sample geometry, and the selected reconstruction algorithm. It can therefore vary between a few angstroms to a few nanometers within the same dataset. More details on the principles of the APT technique can be found in the existing review articles and books (e.g., Refs. Reference Kelly and Miller6 and Reference Gault, Moody, Cairney and Ringer7). For neutron-irradiated materials with significant background radiation, the use of focused ion beam (FIB) milling to reduce the volumes of material required to prepare and perform APT analyses has significantly facilitated the adoption of APT as a major characterization technique for irradiated materials.
This article focuses on three types of microstructural features found in irradiated materials: solute clusters, solute segregation to grain boundaries, and voids. First, the ability of APT to resolve solute clusters has motivated its use in the characterization of irradiated steels currently used in reactors and in the development of oxide dispersion strengthened (ODS) steels. The selected examples highlight strengths and limitations of the APT technique in addressing the quantification of solute clusters. Because radiation-induced segregation plays a significant role among all radiation degradation phenomena, a summary of possible approaches to perform quantitative analyses of solute and impurity segregation to grain boundaries is then presented. These measurements benefit from the chemical sensitivity of APT that is theoretically constant across the periodic table and is better than that typically achievable with analytical TEM methods for common impurity elements, while other techniques with better chemical sensitivity, such as SIMS, lack the spatial resolution. In addition, quantification does not require the use of standards, and the recently developed methods for analyzing crystallographic information present in the APT dataset. To finish, visualization and analysis of voids using APT are briefly reviewed.
II. INSIGHTS INTO SOLUTE CLUSTERING
APT has been instrumental in the analysis of solute clustering that would not be directly imaged and quantified by other characterization techniques. However, quantifying the size, number density, and chemistry of solute clusters is not necessarily a straightforward task. Rather, the analysis of solute clustering is an ongoing research topic that involves understanding inherent technique artifacts, developing correction methods and data analysis procedures, and quantifying uncertainties and errors. Commonly observed artifacts include trajectory aberrations, Reference Miller and Hetherington8 evaporation of several ions on the same voltage or laser pulse that may not be detected, Reference De Geuser, Gault, Bostel and Vurpillot9,Reference Da Costa, Wang, Duguay, Bostel, Blavette and Deconihout10 and preferential evaporation or retention of certain solute elements over others leading to biased detection and erroneous compositions. Reference Miller and Smith11 The particular artifact of trajectory aberrations traditionally refers to the presence of defects or different phases with different evaporation fields at the specimen surface. The variations in evaporation field over the surface lead to local variations in the surface curvature. Since ion trajectories are controlled by the field distribution over the surface, a nonuniform surface curvature yields nonuniform projection Reference Miller and Hetherington8 and in worse cases crossing of ion trajectories. It is therefore obvious that data reconstructions assuming a spherical specimen end shape may contain significant positioning artifacts. Reference Miller and Hetherington8,Reference Marquis, Geiser, Prosa and Larson12 Additional examples of artifacts will be discussed throughout the article.
The different data analysis methods that have been applied to the analysis of solute clustering have been reviewed elsewhere. Reference Marquis and Hyde13 However, the main approach to quantifying solute clustering is based on the concept of a maximum separation distance, d max; two or more atoms are part of the same cluster if they are all positioned within a sphere of radius d max. Reference Vaumousse, Cerezo and Warren14,Reference Stephenson, Moody, Liddicoat and Ringer15 Additional parameters, such as inclusion and erosion distances Reference Vaumousse, Cerezo and Warren14 or order parameter, Reference Stephenson, Moody, Liddicoat and Ringer15 can be selected to refine cluster definitions and define cluster compositions. We note that the results of this analysis method are highly sensitive to the selection of the input parameters, which, unfortunately, the published literature does not always make clear. Limitations of the method and variability of the measured cluster sizes, number densities, and composition on the chosen values are rarely discussed. Reference Cerezo and Davin16 Other exceptions include Styman et al. Reference Styman, Hyde, Wilford and Smith17 and Williams et al. Reference Williams, Haley, Marquis, Smith and Moody18 for their analyses of solute clusters in reactor pressure vessel (RPV) and ODS steels.
The motivation in using APT to quantify size and number density of various solute clusters found in irradiated RPV steels came from the need to assess their hardening effects and therefore to develop empirical relationships between microstructure and hardening that could be extrapolated to relationships between irradiation condition and embrittlement without having to go through an expensive campaign of materials testing. The presence of small clusters of Ni, Mn, and Cu in irradiated steel welds was shown directly for the first time using atom probe field ion microscopy (APFIM), an older version of the APT technique. Reference Burke and Brenner19 Since, APT has been used to quantify irradiation-induced solute clusters in various steels retrieved from nuclear reactors. Overall, it was determined that the presence of Cu is particularly deleterious through the formation of CuMnNi clusters. APT has uniquely revealed the formation of solute clusters, with a strong effect of dose and impurity content on their formation, size, and number density (e.g., Ref. Reference Miller, Nanstad, Sokolov and Russell20). APT also played a key role in the selection of annealing treatments of plant steels used to recover the hardening effect generated by the formation of small clusters. Reference Auger, Pareige, Welzel and Van Duysen21 In low Cu steels, Odette also predicted the appearance of other types of clusters, specifically NiMnSi clusters or “late blooming phases”, forming at high fluences and leading to significant embrittlement. Reference Odette22 Experimental evidence from APT analyses exists for such NiMnSi clusters formed in irradiated steels Reference Miller, Powers, Nanstad and Efsing23 or in thermally annealed steels Reference Styman, Hyde, Wilford, Morley and Smith24 and Wells et al. Reference Wells, Yamamoto, Milot, Cole, Wu and Odette25 recently showed that a high volume fraction of Mn–Ni–Si phase form in Cu-free and Cu-bearing steels irradiated at high fluence. Reference Wells, Yamamoto, Milot, Cole, Wu and Odette25 In their analysis of the small clusters, Wells et al. Reference Wells, Yamamoto, Milot, Cole, Wu and Odette25 highlighted the importance of considering local composition (as opposed to the alloy composition) when analyzing precipitate data.
As a side note, significant discussions within the APT and SANS communities were generated over the question of the possible presence of Fe in the Cu clusters. SANS data analyzed using experimental magnetization data at room temperature showed that almost pure Cu precipitates are formed Reference Odette, Liu and Wirth26 contrasting with early APT work reporting Fe concentrations in Cu clusters in the range of 27–52%. Reference Miller, Wirth and Odette27 Odette et al. Reference Odette, Liu and Wirth26 suggested that some of the detected Fe atoms originate from trajectory aberrations and Morley et al. Reference Morley, Sha, Hirosawa, Cerezo and Smith28 showed that the detected concentrations of Fe within Cu precipitates could reduce to <5% when taking into account these artifacts. Trajectory aberrations leading to a spatial overlap between matrix and cluster ions and a potential dilution of cluster compositions are not specific to the analysis of Cu clusters in Fe. Similar observations are described below for the detection of Fe inside oxide nanoclusters in ODS steels. The same question can be extended to the observed Fe content in nanoscale Cr-rich α′ precipitates formed in neutron irradiated Fe–Cr based steels and analyzed by APT (e.g., Refs. Reference Novy, Pareige and Pareige29 and Reference Bachhav, Robert Odette and Marquis30).
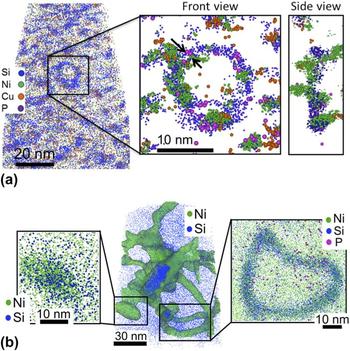
Similar to RPV steels, irradiated 304 steels exhibit a number of irradiation-induced features, which include the formation of Cu clusters, Ni/Si clusters, Ni3Si, and G-phase precipitates. In proton-irradiated 304 in particular, the very high number density of features formed and their spatial interactions make the microstructure extremely complex. Yet, APT has been instrumental in resolving the spatial arrangement of the different features (dislocations with solute segregation, clusters along dislocations, or clusters in the matrix). We note that the maximum separation method was originally developed for the analysis of clusters with high concentrations of solutes forming in dilute matrices. Its application to the analysis of proton-irradiated 304 microstructures, where different types of clusters involve the same solute species, the interface between clusters and matrix is broad, and the compositional difference between matrix and clusters is not large, may lead to inaccurate interpretations. To address this issue, Chen et al. Reference Chen, Chou and Marquis31 developed a procedure for optimizing the selection of cluster parameters in an effort to provide a systematic and quantitative analysis of the microstructures. As an illustration, the method can resolve Ni-rich clusters along a Ni and Si segregated dislocation loop in a proton implanted 304 steel [Fig. 1(a)]. APT also provides a quick approach to compare different irradiation methods. For instance, significantly different microstructures are observed in 304 steels neutron-irradiated at low dose rates where larger and fewer Ni and Si segregated dislocation loops and larger Ni3Si precipitates are observed, as illustrated in Fig. 1(b). The local composition analysis also revealed that the clusters are Mn-depleted under proton irradiation but Mn-enriched under neutron irradiation.
(a) Slice taken from a reconstructed APT volume revealing Cu, Ni, and Si clustering and Ni, Si, and P segregation to dislocation loops in a 304 proton implanted to 10 dpa at 360 °C (from Ref. Reference Chen, Chou and Marquis31). (b) Reconstructed APT volume from a 304 steel neutron irradiated at 450 °C to 28 dpa revealing large Ni and Si segregated dislocation loops as well as large Ni3Si precipitates (data courtesy of Y. Dong, University of Michigan).

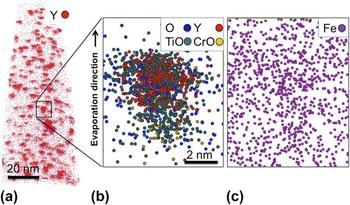
The search for radiation tolerant materials has focused significant effort on the development of ODS steels, which contain high densities of nanometer scale yttrium-rich oxide particles or nanoclusters. It is thought that the nanocluster interfaces might act as sinks for point defects, thereby mitigating void swelling. Reference Odette, Alinger and Wirth32 Optimization of the radiation resistance of ODS steels would require some knowledge of the oxide particles forming during processing as well as an understanding of their behavior under irradiation. Larson et al. Reference Larson, Maziasz, Kim and Miyahara33 performed the first APT analyses, followed by Miller et al. Reference Miller, Wirth and Odette27,Reference Miller, Kenik, Russell, Heatherly, Hoelzer and Maziasz34,Reference Miller, Russell and Hoelzer35 on a Fe–14Cr containing W, Ti, and Y. A number of studies followed with APT analyses of different ODS steels (e.g., Refs. Reference Brocq, Radiguet, Le Breton, Cuvilly, Pareige and Legendre36–Reference Williams, Smith and Marquis39). Most of the debate regarding these APT analyses has revolved around the question of the measured composition of the nanoclusters. It appears that differing interpretations often originated from discrepancies and uncertainties in the methods used to analyze the data, which were not necessarily described in the published literature. While the expected stoichiometry is measured for the larger particles (>10 nm), Reference Williams, Smith and Marquis39 the reported cluster compositions often are significantly oxygen and yttrium deficient for the smaller particles. The measured compositions also suggest significant amounts of Fe within the nanoclusters, which for the most part, if not entirely, may be the result of trajectory aberrations. Indeed, the dark contrast at the particle locations observed by field ion microscopy Reference Marquis40 and the high density of matrix ions reconstructed at the particle locations Reference Wells, Cunningham and Odette41 are consistent with the oxide particles having a lower evaporation field than that of the Fe-rich matrix [Fig. 2(c)]. This difference of evaporation field would in turn lead to trajectory aberrations. Other observed artifacts relate to oxygen migration, either on the evaporating surface of the specimens leading to an apparent spread of the oxygen atoms around the nanoclusters, or in depth due to field-induced migration followed by molecular evaporation with atoms still present on the surface [Fig. 2(b)]. This particular effect has been observed during field evaporation of different oxide/metal systems and can result in a false oxide layer reconstructed at the oxide/metal interface. Reference Larson, Marquis, Rice, Prosa, Geiser, Yang and Parkin42 Bypassing the question of the origin of the Fe observed within the clusters, Williams et al. Reference Williams, Marquis, Cerezo and Smith43 proposed to subtract the Fe content and the corresponding amount of solute elements in proportion to the matrix composition – a method that would allow quantitative comparison of the oxide clusters between different alloys, processing routes, or irradiation conditions. Understanding the raw data and detector limitations is also important to quantify measurement errors and interpret the observed compositions. Reference Williams, Haley, Marquis, Smith and Moody18 The inhomogeneous spatial distributions of nanoclusters very often found in ODS alloys present an additional challenge for APT analyses only able to capture volumes smaller than the length scale of the spatial inhomogeneity. This is addressed by complementing the analyses with TEM observations. Despite these challenges, APT has offered unique information regarding the structure, composition, and irradiation behavior of ODS steels. A core–shell structure was unambiguously observed around oxide particles in ODS steels of different compositions, Reference Marquis40 in agreement with prior TEM observations. Reference Klimenkov, Lindau and Moslang44 The irradiation behavior of ODS steels has also been the object of great interest and a number of APT studies. Somewhat contradictory findings have been reported in the literature, e.g., dissolution of the nanoclusters Reference Certain, Kuchibhatla, Shutthanandan, Hoelzer and Allen45 versus particle coarsening, Reference Lescoat, Ribis, Chen, Marquis, Bordas, Trocellier, Serruys, Gentils, Kaïtasov, de Carlan and Legris46 which may be resolved by considering the temperature at which irradiations were performed and therefore the balance between mixing and reprecipitation. Reference Certain, Kuchibhatla, Shutthanandan, Hoelzer and Allen45
(a) APT reconstruction showing the distribution of oxide nanoclusters identified by the high density of Y and YO ions. (b) A 7 nm thick slice through one nanocluster illustrates the observed spatial distribution of the different identified ions. (c) The Fe spatial distribution is shown in a 3 nm thick slice where a slightly higher density of Fe is observed at the location of the nanocluster (data courtesy of Y. Chen, University of Michigan).

Finally, APT is not only used to characterize multicomponent industrial steels but can also be used to answer basic scientific questions regarding the irradiation behavior of alloys. A recent example illustrating this approach focuses on the quantification of α′ precipitation in a series of model Fe–Cr alloys. The use of neutron irradiation at different temperatures and doses combined with thermal annealing is currently being used to validate the theoretically predicted Fe–Cr phase diagram, Reference Bachhav, Robert Odette and Marquis30 and to quantify precipitation and diffusion kinetics, and the effect of irradiation on the chemistry of grain boundaries. As an illustration, the different microstructures obtained in the series of alloys for the same irradiation condition are shown in Fig. 3. Size, number density, and chemistry of α′ precipitates were quantified using the methods described above. Reference Bachhav, Robert Odette and Marquis30
Thin slices extracted from larger APT reconstructions that were obtained from a series of Fe–Cr alloys containing from 3 to 18 at.% Cr and neutron irradiated at 280 °C to 1.8 dpa. The presence of α′ clusters is observed for Cr concentration above 9 at.% indicating that the solubility limit for Cr in Fe is below this concentration. Size, number density, and concentration measurements are reported in Ref. Reference Bachhav, Robert Odette and Marquis30.

To summarize, provided that potential artifacts related to the APT technique are understood and taken into account, APT provides a quantitative approach to measuring sizes, number densities, and compositions of nanometer scale solute clusters formed in irradiated alloys. It is important that APT analyses be compared to TEM observations or SANS measurements for consistency. While unique in providing 3D chemical mapping, APT is limited in the amount of local structural information; therefore, interpretation of APT data can significantly benefit from TEM observations. The selected examples illustrate how analysis and filtering methods can be developed to analyze complex distributions of features within a microstructure providing quantitative information that may ultimately be used for mechanical property and materials behavior predictions. The development of such robust methods able to distinguish and separate these different features remains an open research topic. In-depth raw data analyses, future detector improvement, and correlative work using complementary techniques such as TEM and electron energy loss spectrometry (EELS) Reference London, Lozano-Perez, Santra, Amirthapandian, Panigrahi, Sundar and Grovenor47 will clarify some of the open questions and ambiguities regarding potential loss of detected ions during APT analysis, solute cluster or oxide nanocluster compositions, and ultimately their behaviors under irradiation.
III. SOLUTE SEGREGATION
Radiation-induced segregation (RIS) of solute atoms at grain boundaries is a concern when it affects materials properties such as susceptibility to stress corrosion cracking. However, changes in the chemistry of grain boundaries observed after irradiation may originate from different mechanisms. Irradiation can induce faster diffusion by the presence of high densities of point defects, and nonequilibrium distributions of solutes leading to segregation at grain boundaries or dislocations, which would otherwise not be observed under thermal equilibrium conditions. Unambiguously, determining the controlling mechanism may be difficult in some cases. In addition, the formation of carbides or nitride phases at grain boundaries can, in some instances, also affect the chemistry of neighboring grain boundaries and lead to Cr depletion and consequently stress corrosion susceptibility and corrosion, a phenomenon also known as sensitization. Reference Lin, Palumbo, Erb and Aust48 In analyzing grain boundary segregation, one has to therefore question (1) the representative character of the analysis – is the chosen grain boundary relevant for the property considered and would it change if a different boundary was analyzed; (2) the variability and reproducibility of the analysis – is the measurement dependent on the location along the grain boundary and on the methods by which it was collected and analyzed; and (3) whether the observation is a manifestation of an irradiation-related phenomenon or a consequence of the surrounding microstructure.
Since grain boundary energy is a function of grain boundary orientation, segregation under thermal equilibrium is also expected to be a function of grain boundary orientation. Reference Lejček49 For irradiated steels, the grain boundary response depends on its sink strength or the ability to absorb point defects, which has been shown to be a function of the grain boundary structure and therefore orientation. Reference Watanabe, Takamatsu, Sakaguchi and Takahashi50 Therefore when quantifying solute segregation, the distinction between prior austenite grain boundaries and lath boundaries in ferritic martensitic steels or between large angle grain boundaries or twin boundaries in austenitic steels is often performed. Grain boundaries may be selected and specimens prepared based on prior scanning electron microscopy (SEM) imaging or electron backscattered diffraction (EBSD) analysis of the surface (e.g., Refs. Reference Hu, Smith and Marquis51–Reference Mandal, Pradeep, Zaefferer and Raabe53). Grain boundary information can also be obtained by imaging the APT specimens by TEM prior to APT analysis. Reference Herbig, Raabe, Li, Choi, Zaefferer and Goto54 More recent tools developed to extract crystallographic information from APT datasets can, in some cases, also reveal grain orientation and therefore information on grain boundary misorientation without having to rely on SEM, EBSD, or TEM analysis (e.g., Refs. Reference Moody, Tang, Gault, Ringer and Cairney55 and Reference Araullo-Peters, Gault, Shrestha, Yao, Moody, Ringer and Cairney56).
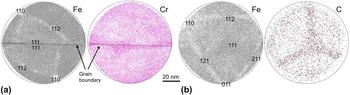
Segregation measurements are often obtained from one-dimensional concentration profiles calculated along small volumes positioned orthogonal to the boundary plane. Recent methods have also been developed to consider the entire boundary surface captured within the dataset. Reference Felfer, Ceguerra, Ringer and Cairney57 Because of the resolution anisotropy inherent to APT data, the observed segregation profiles for a boundary orthogonal to the specimen axis are expected to be sharper than if the boundary is positioned parallel to the tip axis. The height of the segregation peak may therefore not be of much relevance as it depends on the orientation of the grain boundary plane within the APT specimen. Reference Bachhav, Chen, Marquis and Geiser58 Instead most studies report excess values that can be calculated from area under the segregation or depletion peak in a concentration profile (e.g., Ref. Reference Krakauer and Seidman59). For such an interfacial segregation analysis that also relies on a measurement of the matrix concentration, any crystallographic artifacts resulting in local variations of solute concentrations should be considered carefully. The preferential retention and preferential evaporation of specific species between voltage or laser pulses (DC evaporation) have been discussed in a number of studies (e.g., Ref. Reference Miller and Smith11). Surface migration of solute atoms or impurities, such as Si, C, P, or N in steels, also results in a crystallographic dependence of the measured composition, as discussed in Ref. Reference Gault, Danoix, Hoummada, Mangelinck and Leitner60 and illustrated in Fig. 4(b). Beyond these preliminary steps required to analyze the APT data, many examples of measurements of grain boundary chemistry in irradiated materials using APT can be found in the literature (e.g., Refs. Reference Toyama, Nozawa, Van Renterghem, Matsukawa, Hatakeyama, Nagai, Al Mazouzi and Van Dyck61–Reference Miller, Pareige and Burke64).
(a) Thin slices showing representative cumulative desorption maps of Fe and Cr with clear crystallographic directions. A Σ3 grain boundary revealed by the locally higher Cr density runs through the analysis. (b) Cumulative desorption maps of Fe and C for a different specimen illustrating the crystallographic dependence of C evaporation (data courtesy of M. Bachhav, University of Michigan).

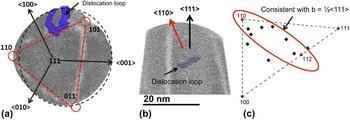
Dislocations can, in most cases, be observed only if solute segregation is present. Several examples of solute segregation to dislocations can be found in the literature (e.g., Refs. Reference Chen, Chou and Marquis31, Reference Miller65, and Reference Williams, Hyde, Smith and Marquis66). One might note, however, that the APT specimens during analysis are subjected to large mechanical stresses and possibly non-negligible temperature rises when using laser pulsing that may lead to migration of some defects. While solute segregation tends to pin dislocations, it would be recommended to perform complementary analyses (e.g., TEM imaging of APT specimens before and after APT analysis or of thin foils) to verify the integrity of the features of interest during field evaporation. Nonetheless, in many cases, careful data analysis has led to the quantification of dislocation segregation and line density. Figure 1 also illustrates the possible analysis of heterogeneous nucleation of solute clusters along dislocation loops. The analysis of the crystallographic orientation of the samples using desorption patterns offers additional information on the nature of the dislocations. For instance, Bachhav et al. Reference Bachhav, Odette and Marquis52 determined the habit planes of dislocation loops in a neutron irradiated Fe–Cr alloy, which is an indirect observation of the dislocation Burger's vectors (Fig. 5). This approach is complementary to the more common Burger's vector analysis from TEM foils. Another successful approach was provided by Bhattacharya et al. Reference Bhattacharya, Meslin, Henry, Pareige, Décamps, Genevois, Brimbal and Barbu67 who analyzed the distribution of Cr atoms within dislocation loops formed in Fe–Cr alloys by using TEM for orientation and chemical analysis complemented by APT imaging for the 3D information of the Cr distribution within the loop.
Dislocation analysis in a neutron irradiated Fe–6Cr alloy using the crystallographic information available from the desorption map (top view) to inform on the normal direction to the dislocation habit plane (side view). From the habit plane orientation, all dislocation loops analyzed are consistent with ½<111> type loops (data courtesy of M. Bachhav and L. Yao, University of Michigan).

IV. ANALYSIS OF VOIDS
Small voids or bubbles have previously been imaged by field ion microscopy (FIM) and APT. The observed patterns by FIM vary from local distortions of the surface atomic structure Reference Brenner and Seidman68 to high intensity star-like patterns, Reference Godfrey, Lewis, Smith and Smith69,Reference Miller, Longstreth-Spoor and Kelton70 as illustrated in Fig. 6(a) reproduced from Ref. Reference Godfrey, Lewis, Smith and Smith69. The observed image and high intensity associated with the presence of voids were qualitatively explained by modeling of the field distribution over the evaporating surface containing a small cavity at the surface of the specimen Reference Birdseye, Smith and Smith71 and explained by trajectory aberrations of the field-desorbed ions at the void edges. Reference Miller, Longstreth-Spoor and Kelton70,Reference Edmondson, Parish, Zhang, Hallen and Miller72 High density patterns have also been observed in APT datasets obtained from neutron irradiated steels for which TEM has shown the presence of nanometer size voids. An example is shown in Fig. 6(c) where the star-shaped density patterns of all major matrix elements (Fe, Cr, and Ni) resemble that observed in the FIM image shown in Fig. 6(a). Again the apparent high density is attributed to ion trajectory aberrations induced by the dramatic change in curvature at the edge of the void. Recently published APT data indicate that voids or bubbles may also be reconstructed as cavities, Reference Edmondson, Parish, Zhang, Hallen and Miller72 as illustrated in Fig. 6(b) reproduced from Ref. Reference Miller, Longstreth-Spoor and Kelton70. Further analyses will clarify the origin of these different patterns.
(a) FIM image showing a star-like pattern for voids formed in a W filament (reproduced from Ref. Reference Godfrey, Lewis, Smith and Smith69). (b) Slice through a reconstructed APT volume showing voids in an ODS steel (reproduced from Ref. Reference Miller, Longstreth-Spoor and Kelton70). (c) Cumulative desorption maps of Fe, Cr, and Ni showing the presence of a void by the star-shaped high ion density region that can be clearly distinguished from the other microstructural features (data courtesy of Y. Dong, University of Michigan).

V. CONCLUSIONS
This article highlighted possibilities, current limitations, and common methods for analyzing irradiated microstructures. It is believed that future efforts in standardization, detailed and complete reports of experimental protocols in peer-reviewed publications, and further quantification of errors and uncertainties will contribute to ensure that APT data are considered reliable and reproducible. In addition, continued developments in data analysis and the use of APT with complementary techniques such as discussed in Ref. Reference Hyde, Burke, Smith, Styman, Swan and Wilford73 for the combined use of APT and SANS, or use within larger multiscale approaches (e.g., Ref. Reference Robertson, Schuh, Vetrano, Browning, Field, Jensen, Miller, Baker, Dunand, Dunin-Borkowski, Kabius, Kelly, Lozano-Perez, Misra, Rohrer, Rollett, Taheri, Thompson, Uchic, Wang and Was74), will uniquely contribute to a deeper understanding of materials behavior under irradiation.
ACKNOWLEDGMENT
The author would like to acknowledge financial support from the DOE Office of Nuclear Energy's Nuclear Energy University Programs at the University of Michigan.