INTRODUCTION
The general strategy an individual employs to act with and react to environmental stimuli describes his or her personality and is thought to be innate and consistent over time (Grandin Reference Grandin1993; Grignard et al. Reference Grignard, Boivin, Boissy and Le Neindre2001) and in different situations (Forkman et al. Reference Forkman, Boissy, Meunier-Salaün, Canali and Jones2007). Individual differences in behaviour between animals can not only be caused by sex, age, reproductive status and environment; hence, they reveal the personality of an individual (Manteca & Deag Reference Manteca and Deag1993; Locurto Reference Locurto2007). In cattle, personality traits influence the ease of handling (Matthews et al. Reference Matthews, Carragher, Slater, Špinka, Illmann, Maletìnská and Štìtková1997; Burrow Reference Burrow1998), live weight gains in feedlots (Voisinet et al. Reference Voisinet, Grandin, Tatum, O'Connor and Struthers1997a; Fell et al. Reference Fell, Colditz, Walker and Watson1999) and on pasture (Fordyce et al. Reference Fordyce, Goddard, Tyler, Williams and Toleman1985, Reference Fordyce, Dodt and Wythes1988a), carcass damage (Fordyce et al. Reference Fordyce, Wythes, Shorthose, Underwood and Shepherd1988b) and meat quality (Voisinet et al. Reference Voisinet, Grandin, O'Connor, Tatum and Deesing1997b; Fordyce et al. Reference Fordyce, Wythes, Shorthose, Underwood and Shepherd1988b). Since the welfare of an animal depends on its ability to cope with its environment (Broom Reference Broom1988), personality is an important factor in animal welfare and in breeding. Some official breeders have already added certain personality traits to their breeding goals (e.g. Fleischrind Stölln GmbH 2007; Traditional Herefords 2008).
According to Manteca & Deag (Reference Manteca and Deag1993) there are three ways of assessing personality-relevant behaviours: (i) standard behavioural observation; (ii) observers’ rating with the help of predefined categories; and (iii) behavioural tests. In many of these tests, human interaction with the tested animals is inevitable or part of the tests themselves (for descriptions of common methods of personality trait and temperament measurements, see, e.g. Manteca & Deag Reference Manteca and Deag1993; Burrow Reference Burrow1997; Lanier et al. Reference Lanier, Grandin, Green, Avery and McGee2000; Waiblinger et al. Reference Waiblinger, Boivin, Pedersen, Tosi, Janczak, Visser and Jones2006; Forkman et al. Reference Forkman, Boissy, Meunier-Salaün, Canali and Jones2007). Some methods are therefore at least partly subjective and judgemental, especially when categories are used. According to the mood-biased judgement hypothesis, human judgements will be positive during a good mood and negative during a bad mood (Mayer Reference Mayer and Sharkey1986). Thus, when measuring personality traits, the results of judgemental methods are always influenced by the mood of the observer during the rating and by what the observer thinks is a positive or a negative judgement of the animals. Thus, inter- and even intra-observer reliability are difficult to obtain (Welfare Quality®2009); however, an objective, reliable and observer- and mood-independent method of measuring personality traits is required, especially for practical purposes such as when animals are selected for breeding.
The measurement or rating of the motivation of an animal to elude an unpleasant or frightening situation either while restrained or while moving freely is common for many behavioural tests, such as the crush-test or the human-approach-test. The behaviour shown in these situations is either fear-related escape behaviour or an expression of the animal's dislike of the situation. It describes an important part of personality (Kilgour et al. Reference Kilgour, Melville and Greenwood2006; Benhajali et al. Reference Benhajali, Boivin, Sapa, Pellegrini, Boulesteix, Lajudie and Phocas2010) and with regard to restraint situations, it is characterized by three main features: the number of escape attempts per time unit, the maximal force and the force per time unit. However, the often-used crush-test measures the behaviour indirectly by having observers judge the strength, frequency and duration of escape attempts and rating the animals according to a predefined category scale (Grandin Reference Grandin1993; Kilgour et al. Reference Kilgour, Melville and Greenwood2006; Benhajali et al. Reference Benhajali, Boivin, Sapa, Pellegrini, Boulesteix, Lajudie and Phocas2010; Gibbons et al. Reference Gibbons, Lawrence and Haskell2011). Other tests developed, such as the docility test, can be time-consuming and rather complicated to execute (Le Neindre et al. Reference Le Neindre, Trillat, Sapa, Ménissier, Bonnet and Chupin1995; Boivin et al. Reference Boivin, Gilard and Egal2009), and human interaction with the animals (Boissy & Bouissou Reference Boissy and Bouissou1988) and observer-dependent rating are fundamental parts of the tests (Grandin Reference Grandin1993).
In the current study, an appliance is introduced that allows objective measurement of the escape behaviour and reluctance in young cattle restrained by being tethered on a halter, independently of the impact and rating of a more or less subjective observer or handler.
MATERIALS AND METHODS
Animals and housing
Animals in an existing breeding experiment were used to test this new measuring appliance. Twenty-four calves (12 male, 12 female) of the F2 generation of a cross-breeding of Holstein–Friesian and Charolais were tested at 90 days (±3 days) of age. All calves were bred via embryo transfer into unrelated Holstein Friesian heifers as recipient mothers and born and tested between 2004 and 2010.
The calves were kept in various small groups of up to nine animals of similar age separate from their recipient mothers from day one. Pens were 6 × 7 m and were covered with deep litter. Each pen contained two hay racks, one milk feeder, one concentrate feeder and one drinking trough for water supply. Until 90 days of age, the calves were not subject to any other experiment, and handling did not exceed routine handling by the animal keepers except in the case of animals requiring treatment for sickness.
After weaning, the animals were weighed at an age of 111 days (±3 days). The weight at the day of the experiment was calculated with the help of the average daily weight gain from birth to weaning and the exact age at the experiment. On average the calves weighed 115 kg (range: 89–144 kg, s.d. ±13 kg) at the day of the experiment.
Measuring appliance and experimental outlay
To measure escape behaviour and reluctance in calves, the animals’ expended power was recorded during a restraint situation (further called pulling-test) with the force transducer Megatron KT1400 (Megatron Elektronik AG & Co., Putzbrunn, Germany; Fig. 1). Its measuring principle is a DMS Wheatstone bridge. With a signal of 0–5 V, it is calibrated from 0 to 1 kN, and it is useful for applications with traction force because of its S-beam shape. An M8 internal screw thread is used for force application.
(a) Force transducer Megatron KT1400 with the cable leading to the tested animal and the computer-interface connection; (b) a calf restrained during the pulling-test, put on a halter and tied with the cable to the force transducer hidden behind the wooden shield to the right.

The force transducer was connected with an analogue/digital interface (NI PCI-6503, National Instruments Germany GmbH, Munich, Germany) to a PC (Fig. 1a) and was built onto a metal bar of the home pen of the animals so that the cable elongated the force direction of the transducer (see pulling calf in Fig. 1b), which was essential to avoid resultant force.
During the pulling-test the tested calf stayed in one-half of its home pen, while the pen mates were confined to the other half of the pen using metal bars to avoid falsifying the measurement. Visual, acoustic and olfactory contact between the test calf and its pen mates therefore persisted, in the hope of minimizing the effects and influences of isolation. The test calves were captured, put on a halter and tied to the cable leading to the force transducer (Fig. 1b). The software recording the tractive force developed for the current study was then initiated and all human handlers left the barn. After a 30 min recording period, a handler entered the barn, released the test calf and reunited it with its pen mates, which were allowed back into the experimental part of the pen.
All procedures involving animal handling and treatment were approved by the Committee for Animal Use and Care of the Ministry of Agriculture, the Environment and Consumer Protection of the federal state Mecklenburg-Vorpommern, Germany.
Recording and parameters of tractive force
Data measured by the force transducer were digitized with a sampling rate of 20 Hz and were transferred to a computer. A software program using LabView 6.1 (National Instruments GmbH Germany, Munich, Germany) was developed to save the tractive force-time diagram and to calculate the parameters from this diagram. The software included two applications: a recording program, which saved the force-time diagram with a time stamp during the complete recording period (Fig. 2), and an analysing program, which analysed the force-time diagrams in the lab. With the recording program one could freely choose sampling rate and the start time and duration of the recording period. The analysing program made it possible to choose interval length for analysis.
Screenshot of a force-time diagram from the recording program in the barn.
In the experiment, the 30-min recording period was divided into six 5-min intervals, and for each interval, the following parameters were calculated:
– Total force: an integral of the tractive force diagram in kNs consisting of:
• Tractive force: an integral of positive values of the derivation of the tractive force diagram (meaning only the upward tractive phases) in kNs (force multiplied by time that a calf pulls upwards on the cable).
• Holding force: an integral of zero values of the derivation of the tractive force diagram (meaning only the holding tractive phases) in kNs (force multiplied by time that a calf pulls on the cable with stable effort; i.e. ‘hanging’ in the cable without moving).
• Dwindling force: an integral of negative values of the derivation of the tractive force diagram (meaning only the downward tractive phases) in kNs (force multiplied by time that a calf pulls on the cable with downward effort; i.e. stops pulling on the cable).
– Number of pulls: a local maxima of the tractive force diagram above a threshold level of 60 N (empirical value).
– Maximal tractive force: the highest amplitude of the tractive force diagram (global maximum) in N.
To eliminate high-frequency perturbations, the recorded diagram was smoothed with a moving average (n = 10).
The procedures ‘integral’ and ‘derivation’ used to calculate the parameters were part of the program library of LabView. The numerical integration was performed with the trapezoidal rule, which calculates the integral with consecutive applications of the basic formula. The basic formula to calculate the partial sum with the trapezoidal rule is:
 $${\rm partial}\,{\rm sum} = \displaystyle{1 \over 2}(x_i + x_{i + 1} ) \times {\rm d}t$$
for i = 0, 1, 2, 3, 4, … , whole-number part of (N–1), where N is the number of points of the whole plot and x is the initial array.
The result was the sum of these consecutive partial calculations:
 $${\rm result} = \int_{t_0} ^{t_1} {\,f\,(t){\rm d}t = \sum\limits_j {{\rm partial}\,{\rm sum}}} $$
where j is the range depending on the number of measuring points.
The discrete differentiation was carried out with a second-order differentiation method. The differentiation f(t) of the function F(t) is defined as follows:
 $$f\,(t) = \displaystyle{{\rm d} \over {{\rm d}t}}F(t)$$
Y is given as sampled start sequence dX/dt. When using the second-order method, Y is calculated with the following equation:
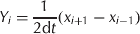 $$Y_i = \displaystyle{1 \over {2{\rm d}t}}(x_{i + 1} - x_{i - 1} )$$
for i = 0, 1, 2, … , n–1, where n is the number of values in x(t), x −1 is the first value in the start constraint and x n is the first value of the final constraint.
The local and global maxima of the tractive force-time diagram were calculated with the subprogram ‘peak detection’ from the program library of LabView, which works with an algorithm fitting a quadratic polynomial to moving data blocks. The width of the quadratic polynomial determines the number of measuring points; in these analyses, a width of 5 was convenient (empirical value).
Statistical analysis
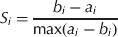
The parameters tractive force, maximal tractive force and number of pulls were used in the current exemplary analysis. The other two parameters were left aside to improve clarity in the results; therefore a parameter vector with a dimension of 18 (three parameters at six 5-min intervals) was used. Since the measured parameters of the vectors were multivariate, multivariate analyses with the statistics program R version 2.12.1 (R Development Core Team 2008) were conducted. The aim was to classify the different reactions of the tested animals on the basis of the parameter vectors without a priori knowledge. The k-means-algorithm (‘kcca’) was used to perform a k-centroids clustering on the data matrix (Leisch Reference Leisch2006). The algorithm forms a predetermined number of k differing clusters with similar subjects from the data volume. Since the number of clusters k is unknown per default, the algorithm was conducted iterative from k = 2 to k = 20. The k-means-algorithm is dependent on the initial conditions and can yield different results. Thus, the algorithm was conducted 20 times with randomly differing initial conditions for each number of clusters k. By using the score of the ‘silhouette’ function, the optimal number of clusters was determined. For each observation i, the silhouette score S i is defined as follows:
 $$S_i = \displaystyle{{b_i - a_i} \over {\max (a_i - b_i )}}$$
where a i is the average dissimilarity between i and all other points of the cluster to which i belongs, and b i is the minimum of all average dissimilarity of i to all observations and can be seen as the dissimilarity between i and its neighbouring cluster, i.e. the nearest one to which it does not belong.
A hierarchical cluster analysis (Euclidean distance, complete linkage) was performed with the function ‘hclust’, which uses a set of dissimilarities for the clustered objects. At first, each object is allocated to its own cluster and then the algorithm proceeds iteratively by stepwise combining of the two most similar clusters and continuing until there is only one single cluster. At each stage, metric Euclidean distances between clusters are recomputed by the Lance–Williams dissimilarity. The result of this clustering can be shown graphically in a dendrogram. The animals’ weights were tested for differences between the clusters with Welch's two-sample t-test.
RESULTS
Raw data
The escape behaviour and reluctance of the calves were described by tractive force, maximal tractive force and the number of pulls during 5-min intervals (Fig. 3). The majority of the calves showed a very similar behavioural pattern, especially with regard to the tractive force and number of pulls. The tractive force decreased from about 2 kNs at the beginning to 1 kNs at the end of the restraint situation. The number of pulls ranged from 5 to 10 for most calves and showed only a slight decrease across the 30 min. Several animals, however, showed higher values in both these parameters (Fig. 3).
Tractive force in kNs, maximal tractive force in N and number of pulls of calves tied to a force transducer for 30 min summarized in 5-min intervals.
Clustering
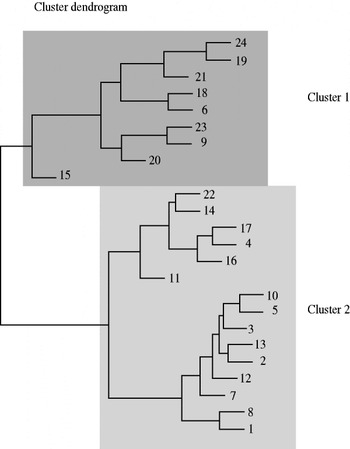
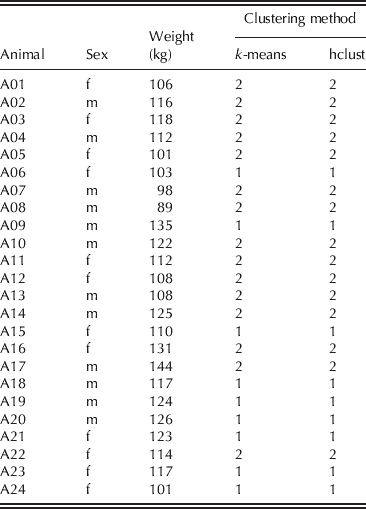
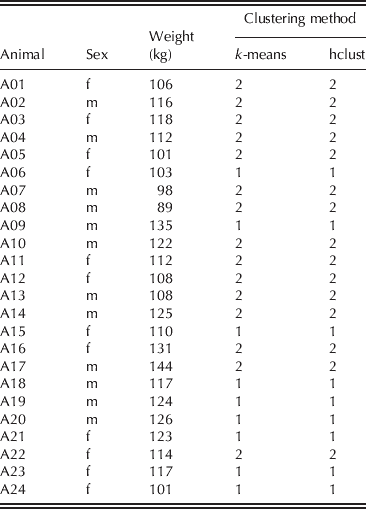
The silhouette function commended a cluster number of two when clustering with the k-means-algorithm ‘kcca’ without a priori knowledge and also when using the function ‘hclust’. The latter function enabled the data structure and clustering to be displayed graphically via a dendrogram (Fig. 4). Both clustering methods allocated the same individuals into two clusters (Table 1). The first sub-structure to be found was named cluster 1 (four male and five female calves), and the next was named cluster 2 (eight male and seven female calves). Table 1 lists each individual in the clusters, its weight and sex. In cluster 2, two sub-clusters could be determined. The animal A15 could clearly be determined as an outlier in all three parameters and A06 showed a strong increase in reaction until the 20-min interval in all parameters (Fig. 3). A20 showed a continuously high tractive force level and A11 increased its maximal tractive force until the 20-min interval (Fig. 3). The mean weight of the animals in the two clusters was 117 kg (s.d. ±11 kg, range: 101–135 kg) for cluster 1 and 114 kg (s.d. ±14 kg, range: 89–144 kg) for cluster 2, and did not significantly differ from each other (t = 0.77; P = 0.452).
Graphical display of the data structure of the 24 calves during the pulling-test shown as a cluster dendrogram.

Animal, sex and weight (kg) of the calves to cluster 1 and 2 analysed with the functions ‘kcca’ and ‘hclust’ in R; the number of an animal indicates the number in the cluster dendrogram (Fig. 4); m = male, f = female
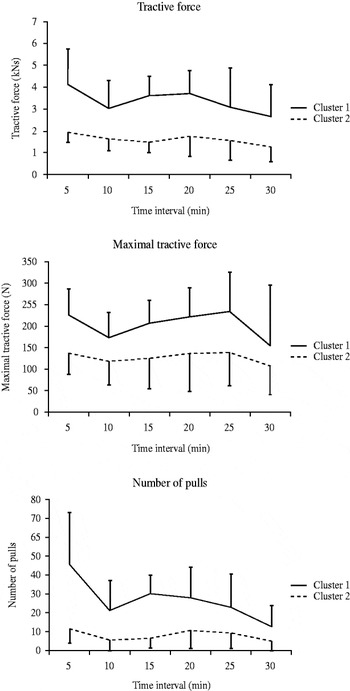
The mean values over time (± s.d.) in each cluster are shown in Fig. 5 for the three measured parameters showing a distinct differentiation. In all parameters, the curve for cluster 1 is clearly above that for cluster 2. The curves of both clusters showed similarities with the highest values in the beginning of the pulling test, a decrease over time and a slight increase in the middle of the test before decreasing even further towards the end. However, this pattern was far more distinctive in cluster 1 than in cluster 2. Furthermore, the variability in the tractive force and number of pulls was larger in cluster 1 than in cluster 2, although the latter consisted of more animals. Despite slight decreases and increases, the calves in cluster 2 displayed a relatively stable reaction level throughout the recording period.
Diagrams of the mean values over time (±s.d.) of the three measured parameters tractive force in kNs, maximal tractive force in N and number of pulls for cluster 1 and 2.

DISCUSSION
The current paper presents a technical method to record objectively the individual escape behaviour and reluctance in calves during restraint. The appliance can be used by anyone anywhere in the world, trained or untrained, educated or not, in any housing system (except for old-fashioned tied-barns) and will yield objective comparable results. Escape behaviour in a restraint situation is an important element of personality in prey animals (Boissy Reference Boissy1995; Koolhaas et al. Reference Koolhaas, De Boer, Coppens and Buwalda2010). One can expect that animals with different personality traits display differing behaviour patterns that can be classified according to their main features. Therefore, its standardized measurement has the potential to become an element of an easily applicable test in future breeding programme when phenotyping animals’ personalities (Benhajali et al. Reference Benhajali, Boivin, Sapa, Pellegrini, Boulesteix, Lajudie and Phocas2010). So far, beef producers willing to include personality to the breed value of their cattle are instructed to measure flight time when leaving a crush once and use this simple measure to describe an animal's temperament (Gaden et al. Reference Gaden, Burrow, Pettiford and Gaden2004). To our knowledge, the behaviour of cattle during a restraint or tethered situation has either been described with temperament scores (e.g. Grandin Reference Grandin1993; Lanier et al. Reference Lanier, Grandin, Green, Avery and McGee2000) or has been observed and measured behaviourally (Boissy & Bouissou Reference Boissy and Bouissou1988), but until now this behaviour has only rarely been measured physically (Veissier et al. Reference Veissier, Le Neindre and Trillat1989).
With the animals tested in the current experiment, two different behaviour patterns revealing two intensities in the reaction were found. It is likely that more behaviour patterns would be found when testing more animals, e.g. one that shows an increase towards the end of the recording period or one with a constantly high reaction level. The first decrease in the reaction of the calves of cluster 1 could reflect exhaustion but could also be due to an initial evaluation of other possibilities for escaping from the restraint, since pulling has not worked so far. When no possibility was found and the calves had rested briefly, a new increase in reaction level could be detected. Calves of cluster 2 consistently showed a low level of reaction. Coleman et al. (Reference Coleman, Tully and McMillan2005) found that rhesus macaque monkeys that showed a quick reaction to an unknown stimulus were faster in learning a task by operant conditioning than individuals showing a slower or no reaction to an unknown stimulus; thus the animals of cluster 1 in the current study might be disadvantaged in other, different, situations. However, to evaluate this statement, further research needs to be conducted.
In the current study, data from one single measurement per animal at 90 days of age are presented. The young age of the calves tested made it possible to ensure similar housing conditions for both male and female animals. However, the repeatability and hence the reliability of the assessed behaviour pattern of each calf needs to be investigated. Grandin (Reference Grandin1993) suggested three repetitions of temperament-scoring in her study on slightly older male cattle, to gain reliable results.
The reaction to the restraint is clearly not the only parameter defining the personality of cattle. Reactions toward humans may be similarly important. However, these reactions depend on the experience an individual has had with humans and are therefore not only dependent on personality traits but also highly influenced by the age of the animals, previous experience and the human himself (de Passillé et al. Reference de Passillé, Rushen, Ladewig and Petherick1996). The behavioural reaction towards a restraint situation where the animals have the possibility to accept the restraint or not, as in the docility test (Le Neindre et al. Reference Le Neindre, Trillat, Sapa, Ménissier, Bonnet and Chupin1995; Boivin et al. Reference Boivin, Gilard and Egal2009), are especially important for agricultural practice but are not entirely objective since humans are a fundamental part of the test (see intra- and inter-observer reliability in the introduction of the current paper). Moreover, their results are also dependent on previous experience of the test animal with humans (de Passillé et al. Reference de Passillé, Rushen, Ladewig and Petherick1996). Reactions to an unknown object, as in the classic novel-object-test, give further important information on an animal's personality, which are not primarily covered with the method presented in the current paper. Possible correlations between the pulling-test and other tests named above need further research.
As a result of the current investigation, it is concluded that animals with different behaviour patterns can be successfully detected on the basis of their pulling behaviour during a 30-min period of restraint. The newly developed method, including the suggested statistical procedures, can be applied easily in research and in practice. It is suitable for phenotyping in breeding programmes, because it offers a standardized objective procedure independent of human observers and handlers. However, more research on the long-term reliability of the results needs to be conducted. Other aspects of personality also need to be accounted for in addition to those measured with the pulling-test. Therefore, the pulling-test should be seen as an objective and practicable basis-test.
The authors would like to thank Dieter Sehland and Kurt Wendland for their help in constructing the appliance and for testing the animals. Furthermore, they thank the animal keepers for helping to capture the calves. The first author Katharina L. Graunke was financed by the German agriculture network PHENOMCIS, grant no. 0315536G, supported by the Federal Ministry of Education and Research, Germany.