Introduction
The workhorse of a classical computer is the transistor. Computational power scales linearly with the number of transistors on the chip. Moore’s Law predicts that device dimensions are decreasing in time, and within the next decade or so, we are going to hit a fundamental physical limit, which is the size of a single atom. If we want to continue scaling in computational power, we have to think about alternative concepts that have different scaling laws. One of these alternative concepts could be quantum computation.Reference Ladd, Jelezko, Laflamme, Nakamura, Monroe and O’Brien1
In a quantum computer, quantum mechanical principles, such as superposition and entanglement, are used. The workhorse of a quantum computer is a quantum bit, or qubit. Thanks to the principle of superposition, a qubit can be ON and OFF at the same time (unlike the conventional transistor, which can either be in an ON or OFF position), and it can also take any value in between. In a quantum computer, an ensemble of entangled (coupled) qubits is envisioned, and if the quantum state of one of these qubits is changed, then the states of all of the qubits will be simultaneously changed. Due to these quantum mechanical principles, the computational power scales exponentially with the number of qubits entangled in the system. This also means that the computational power is doubled every time an entangled qubit is added to the system. This is the promise of quantum computing and also the reason why a number of companies in the United States such as IBM, Microsoft, Intel, Google, and also in China such as Baidu, Tencent, and Alibaba are investing in quantum computing research.
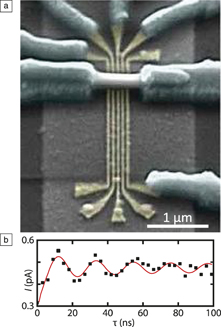
Many different principles can be used to make a qubit.Reference Ladd, Jelezko, Laflamme, Nakamura, Monroe and O’Brien1 One possibility is the spin qubit. A spin qubit can be realized in an indium antimonide (InSb) nanowire, as shown in Figure 1a,Reference Nadj-Perge, Frolov, Bakkers and Kouwenhoven2,Reference van den Berg, Nadj-Perge, Pribiag, Plissard, Bakkers, Frolov and Kouwenhoven3 where five gate electrodes are located below the nanowire. Two quantum dots can be defined in series in the wire by applying a negative potential to gates 1, 3, and 5, such that three potential barriers are formed, with two potential wells (dots) in between. In each of the dots, exactly one electron is captured by tuning the potential on gates 2 and 4. If both electrons have spin-up, then the electron in one cannot tunnel to the other quantum dot because a triplet state has to be formed, which is a higher-energy state. As a consequence, current is blocked by the Pauli exclusion principle.
(a) Scanning electron microscope image of a spin–orbit qubit based on an InSb nanowire. The five local gates are used to define two quantum dots in each of which one electron is captured. (b) Current (I) through the system as a function of the burst time (τ), showing Rabi oscillation.Reference Nadj-Perge, Frolov, Bakkers and Kouwenhoven2,Reference van den Berg, Nadj-Perge, Pribiag, Plissard, Bakkers, Frolov and Kouwenhoven3

A short voltage pulse can be given to one of the gates, in the presence of a magnetic field, such that one of these spin-up electrons is rotated. If the situation is reached where one electron has spin-down and the other one has spin-up, then the left electron can tunnel to the right quantum dot, forming a singlet state, and a current can flow through the system when a small potential difference is applied between the source to the drain electrode. With this device, the spin state of a single electron can be initiated, controlled, and read out, so this is a spin qubit. Figure 1b shows Rabi oscillations; from this graph, two important observations can be made. First, these spin rotations are fast due to the fact that this electron is hosted in InSb. This material consists of two heavy elements and therefore has strong spin–orbit interactions. InSb has a Landé g-factor (a proportionality factor that relates the observed magnetic moment of a particle to its angular momentum quantum number and the Bohr magneton) of 50,3 enabling fast spin rotations, which is advantageous for a qubit. Second, the downside is that these oscillations damp out quickly; after approximately 100 ns, the amplitude has almost completely vanished. The electron in InSb interacts with millions of nuclear spins—and indium (antimony) has a nuclear spin of nine halves (five halves) due to an odd (even) number of protons (neutrons)—therefore, this electron spin quickly loses spin orientation. This is called “decoherence.” In general, decoherence is due to the interaction of a quantum state with the local environment. Decoherence is the fundamental bottleneck for building a quantum computer.
One possible way to overcome decoherence is to use topological quantum computation, in which quantum information is stored nonlocally in so-called Majorana zero modes.Reference Stern and Lindner4 E. Majorana predicted the Majorana fermion in the 1930s as a particle that is equal to its antiparticle, and because of this definition, it has no charge and no spin.Reference Majorana5 Majoranas have been predicted to be real particles similar to neutrinos; about a decade ago, it was proposed that electronic states can be induced in solid-state materials with all of the properties of Majoranas.Reference Fu and Kane6–Reference Oreg, Refael and von Oppen8
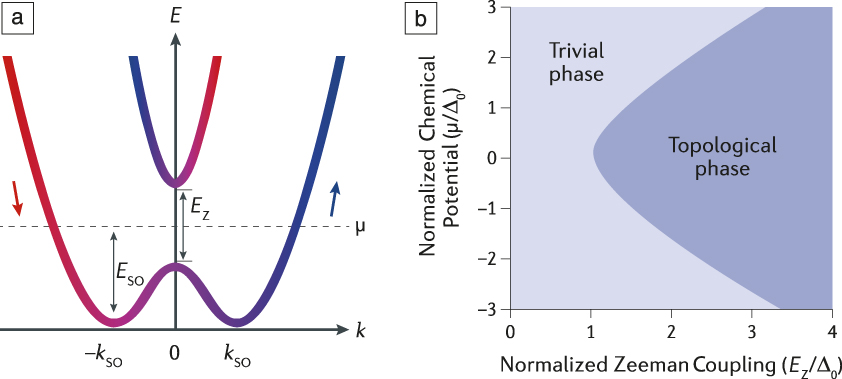
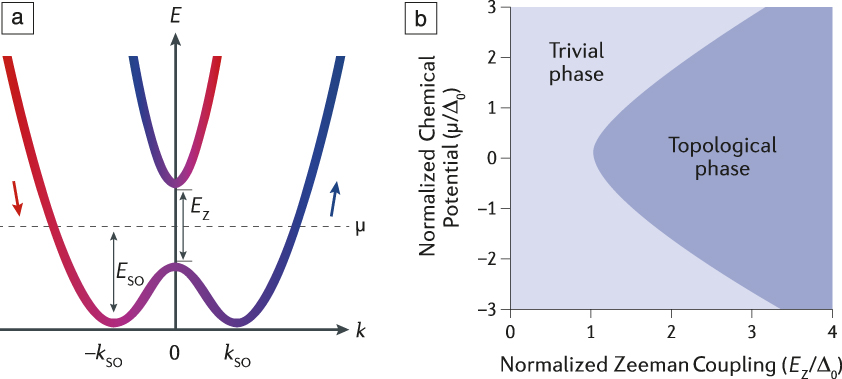
A Majorana state is an equal superposition of an electron and a hole, and it can be formed in the middle of the gap of a topological superconductor. The following ingredients are needed to induce Majorana states:Reference Lutchyn, Bakkers, Kouwenhoven, Krogstrup, Marcus and Oreg9 (1) a one-dimensional (1D) semiconductor system with strong spin–orbit interaction, resulting in displaced dispersion curves as shown in Figure 2a; (2) a magnetic field, which shifts the energy levels to open a “Zeeman gap”; if the electrochemical potential can be tuned to lie somewhere in this Zeeman gap, a topological phase is realized; and (3) superconductivity to impose electron–hole symmetry to the system. The phase diagram in Figure 2b shows that if the Zeeman energy is large enough, the electrochemical potential can be tuned such that the topological phase is reached, in which we expect to find two Majorana states, one at each end of the nanowire. The promise is that these nonlocal states are immune to local noise and would therefore have long coherence times. The Majorana modes obey non-Abelian statistics, which means that by physically exchanging the two Majorana modes, the phase of the system is changed. This exchange operation is important, first, to study the statistical properties of the Majorana modes; verification of the non-Abelian properties will prove their existence. Second, the exchange operation can be used to process quantum information in a topological qubit.
(a) Energy, E, spectrum as a function of the momentum, k, along the nanowire. Spin–orbit coupling shifts the parabolas describing the electron spectrum sideways by k so. A Zeeman gap opens at k = 0 due to an external magnetic field perpendicular to the direction of the spin–orbit coupling. Arrows indicate approximate spin orientations for different momenta; the dashed line indicates the chemical potential, μ, in the system. The colors correlate to the spin orientation (red is spin-down; blue is spin-up). (b) Topological phase diagram. By changing the chemical potential in the nanowire or the Zeeman splitting, it is possible to drive the system from a trivial (non-topological) into a topological phase. Here, ∆0 is the proximity-induced pairing potential in the wire.Reference Lutchyn, Bakkers, Kouwenhoven, Krogstrup, Marcus and Oreg9 Note: E so, spin–orbit energy; E Z, Zeeman energy.
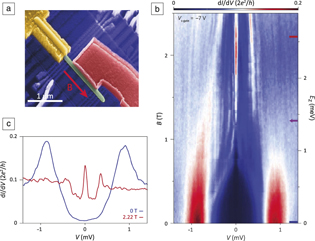
Signatures of Majorana states have been observed in a variety of material systems in recent years.Reference Mourik, Zuo, Frolov, Plissard, Bakkers and Kouwenhoven10–Reference Wang, Kong, Fan, Chen, Zhu, Liu, Cao, Sun, Du, Schneeloch, Zhong, Gu, Fu, Ding and Gao15 Figure 3a shows a device based on an InSb nanowire, which is a 1D system with strong spin–orbit interactions, coupled to a superconductor, in this case NbTiN, to study Majorana zero modes.Reference Mourik, Zuo, Frolov, Plissard, Bakkers and Kouwenhoven10 By applying a magnetic field B parallel to the long axis of the wire, Majorana states are expected at both ends of the superconductor in contact with the wire. By using tunneling spectroscopy, the density of states in the piece of the nanowire between the tunnel barrier and the superconductor can be mapped out, and the presence of a Majorana state results in resonance at zero energy. In Figure 3b, tunneling spectroscopy data from such a device are shown.Reference Gül, Zhang, Bommer, De Moor, Car, Plissard, Bakkers, Geresdi, Watanabe, Taniguchi and Kouwenhoven16 From the data at zero magnetic field, it is clear that a superconducting gap has been induced in the wire. If the magnetic field is increased, a peak at zero energy emerges, in this device at approximately 1.2 T. Importantly, this peak always stays fixed to exactly zero energy, which is an important signature of a Majorana state.
(a) Scanning electron microscope image of a Majorana device. An InSb wire (green) is coupled to a NbTiN superconductor (red). By applying a magnetic field B parallel to the long axis of the wire, it is expected that two Majorana states form at the interface between the semiconductor and superconductor. The density of states is mapped out using tunneling spectroscopy between the normal contact (yellow) and the superconductor. (b) Tunneling spectrum as a function of magnetic field. For B > 1.2 T, a resonance at zero energy is present, which is a signature of a Majorana zero mode. (c) Line trace taken from the data set presented in (b) at B = 2.22 T illustrating the height of the zero-bias peak. Data are reproduced from Reference Reference Gül, Zhang, Bommer, De Moor, Car, Plissard, Bakkers, Geresdi, Watanabe, Taniguchi and Kouwenhoven16 with permission. Note: I, tunnel current; V, tunnel potential; e, electron charge; h, Planck’s constant; V s-gate, potential on the gate below the superconductor; E Z, Zeeman energy.
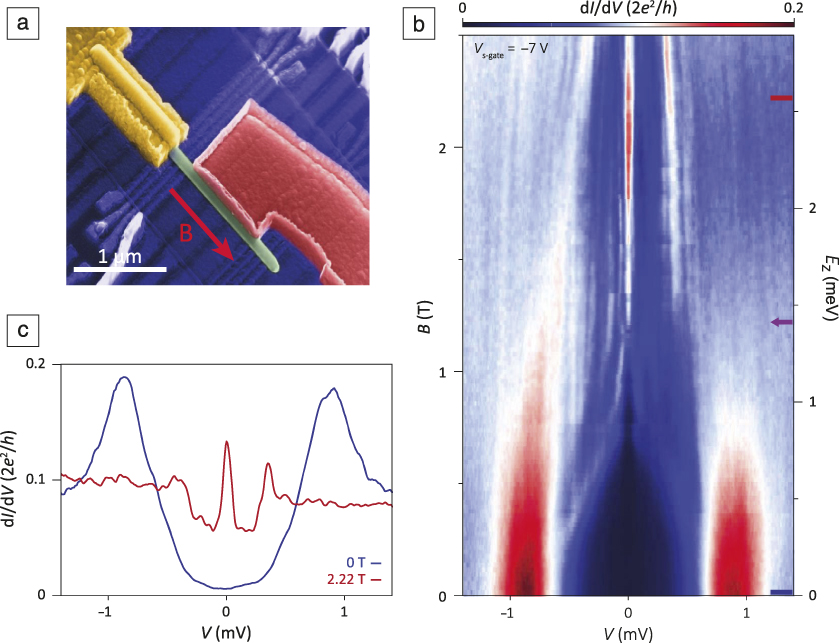
The data appear to be consistent with the concept of Majorana states, but some issues remain. The first problem is that there is a finite density of states in the superconducting gap at finite magnetic field, as is clear from the line trace (red line) in Figure 3c, taken at B = 0 T, indicated by the blue line in Figure 3b. The other problem is related to the height of the zero-bias peak. In the case of a Majorana state, the conductance through the channel should be quantized at values of 2e 2/h (conductance quantum, e = electron charge, h = the Planck’s constant).Reference Liu, Sau, Stanescu and Das Sarma17 The maximum observed peak height in this device is only 10% of that value, as illustrated by the line trace (red line) in Figure 3c, taken at B = 2.22 T , corresponding to the position in Figure 3b indicated by the short red line. Theory shows that the resonance at zero energy couples to states in the soft superconducting gap and is therefore lowered.Reference Liu, Sau and Das Sarma18 These subgap states can arise from disorder at the semiconductor–superconductor interface or vortex from the bulk superconductor (NbTiN) itself.Reference Zhang, Gül, Conesa-Boj, Nowak, Wimmer, Zuo, Mourik, De Vries, Van Veen, De Moor, Bommer, Van Woerkom, Car, Plissard, Bakkers, Quintero-Pérez, Cassidy, Koelling, Goswami, Watanabe, Taniguchi and Kouwenhoven19 The first question to be addressed is can the interface between the semiconductor and the superconductor be improved? The second question is can devices be fabricated, which will enable Majorana exchange operations?Reference Karzig, Knapp, Lutchyn, Bonderson, Hastings, Nayak, Alicea, Flensberg, Plugge, Oreg, Marcus and Freedman20 Exchanging these particles in a 1D wire is not straightforward, since these particles will annihilate if they come close together, because they are each other’s antiparticle.Reference Alicea, Oreg, Refael, von Oppen and Fisher21 Recently a loop, or nanowire network, of semiconductor material with stripes of superconductor material has been proposed.Reference Karzig, Knapp, Lutchyn, Bonderson, Hastings, Nayak, Alicea, Flensberg, Plugge, Oreg, Marcus and Freedman20
InSb nanowires
This work focuses on InSb nanowires, because the spin–orbit interactions are quite strong in this material, and the electron mobility is high. InSb has an extremely large lattice parameter and therefore it is difficult to grow InSb on an insulating, lattice-matched substrate. Therefore, an approach was developed in which nanowire networks were grown out of plane.Reference Gazibegovic, Car, Zhang, Balk, Logan, De Moor, Cassidy, Schmits, Xu, Wang, Krogstrup, Op Het Veld, Zuo, Vos, Shen, Bouman, Shojaei, Pennachio, Lee, Van Veldhoven, Koelling, Verheijen, Kouwenhoven, Palmstrøm and Bakkers22 To grow the InSb wires, an Au-catalyzed vapor–liquid–solid (VLS) growth mechanism using metal–organic vapor-phase epitaxy was employed.Reference Plissard, Slapak, Verheijen, Hocevar, Immink, Van Weperen, Nadj-Perge, Frolov, Kouwenhoven and Bakkers23 Transmission electron microscopy (TEM) showed that the wires are defect free and that they grow in a 〈111〉 direction. More precisely, the wires grow in a 〈111〉B direction, meaning that the top facet of the wire is terminated by antimony, which is important for the fabrication of the networks.
To study the basic electronic properties of the wires, field-effect devices were fabricated. A long channel length (2 μm) was used, such that electronic transport is diffusive, meaning that electrons frequently scatter. By using finite element methods, the capacitance of this device was estimated. From the transconductance, the electron mobility in these wires was determined to be approximately 20 × 103 cm2/Vs.Reference Gül, Van Woerkom, Van Weperen, Car, Plissard, Bakkers and Kouwenhoven24 If shorter channel devices (<500 nm) are used, conductance plateaus are obtained at low temperatures at values of 2e2/h,Reference Kammhuber, Cassidy, Zhang, Gül, Pei, De Moor, Nijholt, Watanabe, Taniguchi, Car, Plissard, Bakkers and Kouwenhoven25 indicating ballistic transport with an electron mean free path of a few hundred nanometers. This experiment also shows that transport can be tuned to take place through single 1D subbands, which is important for Majorana studies.
For the growth of the InSb wires, we used an InP stem, and a short pulse of arsine, which facilitates nucleation of InSb. This InP stem limits the length of the wires to 3–4 μm; during growth of the InSb nanowire, the InP evaporates. After a while, the wire breaks off and then the growth stops. The other problem is that the phosphorus and arsenic from the InP stem may be incorporated in the InSb wire. For this reason, a new approach, based on selective area growth, was developed. InSb wires without a stem can be grown from openings in a silicon nitride mask, and they can have infinite length (at least up to 60 μm). The chemical purity of the wires was explored with atom probe tomography. InSb wires grown without a stem have three to four orders of magnitude lower concentration of arsenic and phosphorus. The electron mobility in these wires has been tested, using exactly the same field-effect devices. The average mobility is now much higher, between 40 and 45 × 103 cm2/Vs due to improved chemical purity, which results in reduced alloy scattering.
Semiconductor–superconductor interface
Now let us address the first question: can the semiconductor–superconductor interface be improved? In a recent paper, it was shown that aluminum (Al), as a superconductor, can be grown as a shell on InAs wires in the same vacuum chamber.Reference Krogstrup, Ziino, Chang, Albrecht, Madsen, Johnson, Nygård, Marcus and Jespersen26 TEM showed that the interface is flat and clean. The superconducting properties of the InAs/Al wires were studied, and the ratio between the normal conductance and the conductance in the gap was about two orders of magnitude, which is a substantial improvement of the device quality, as compared to the “soft-gap” shown in Figure 3c.Reference Chang, Albrecht, Jespersen, Kuemmeth, Krogstrup, Nygård and Marcus27 In order to fabricate this device, part of the aluminum shell had to be removed to avoid a short circuit. For this material combination of InAs/Al, a selective etch was developed.
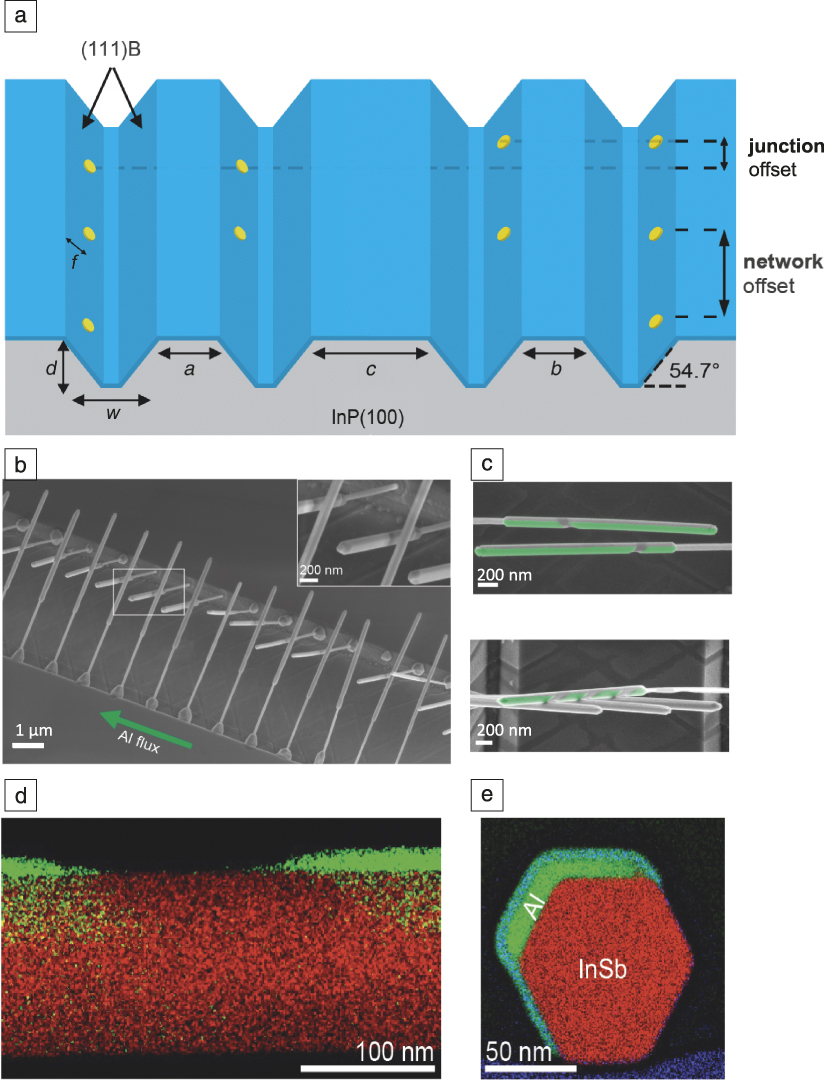
InSb is more fragile, and a selective etch to remove the aluminum has not been identified. To avoid this problem, a new approach was developed, based on shadow growth of the superconductor using in situ-grown shadow masks. To realize these advanced structures, the crystallography of the growth substrate is used. Figure 4a shows an InP(100) wafer in which trenches are defined by wet chemical etching, exposing two phosphorus-terminated (111)B facets.Reference Gazibegovic, Car, Zhang, Balk, Logan, De Moor, Cassidy, Schmits, Xu, Wang, Krogstrup, Op Het Veld, Zuo, Vos, Shen, Bouman, Shojaei, Pennachio, Lee, Van Veldhoven, Koelling, Verheijen, Kouwenhoven, Palmstrøm and Bakkers22 Electron-beam lithography was used to define gold particles on the sloped (111)B facets, and InSb wires were grown perpendicularly from these facets. All of the spacings indicated in Figure 4a can be varied by the lithography pattern. The most important parameter is the offset between the gold particles, called the “junction offset.” In the scanning electron microscope image in Figure 4b, it is clear that the wires grown in these trenches have an angle with respect to each other.
(a) Generic platform to realize in situ shadow growth of superconductors on nanowires. Trenches are etched from a (100)-oriented InP substrate so that (111)B facets are exposed; the parameters indicated as a–d can be used to tune the geometry of the structures, w is the width of the trench, and f indicates the position of the Au particle on the sloped facet. Electron-beam lithography was used to define catalysts on the (111)B facets in controlled positions. The junction offset determines the offset between wires growing from both directions. (b) Scanning electron microscope (SEM) image showing the principle of shadow growth; a flux of Al is directed along the trench direction in a molecular beam epitaxy chamber. The inset shows a magnified image of the box illustrating the small distance between the wires. (c) SEM image illustrating (upper) the shadow action of wires standing in front. (Lower) Three wires in front result in four superconducting islands on the wire in the back. (d) Transmission electron microscopy energy-dispersive x-ray (EDX) map showing that the shadowed region on the InSb wire (red) is free of Al (green). (e) Cross-sectional EDX map showing that Al is deposited on two nanowire facets and that the interface between the superconductor and the wire is sharp. The bluish layer on top of the Al is AlOx. Adapted with permission from Reference Reference Gazibegovic, Car, Zhang, Balk, Logan, De Moor, Cassidy, Schmits, Xu, Wang, Krogstrup, Op Het Veld, Zuo, Vos, Shen, Bouman, Shojaei, Pennachio, Lee, Van Veldhoven, Koelling, Verheijen, Kouwenhoven, Palmstrøm and Bakkers22. © 2017 Springer Nature.
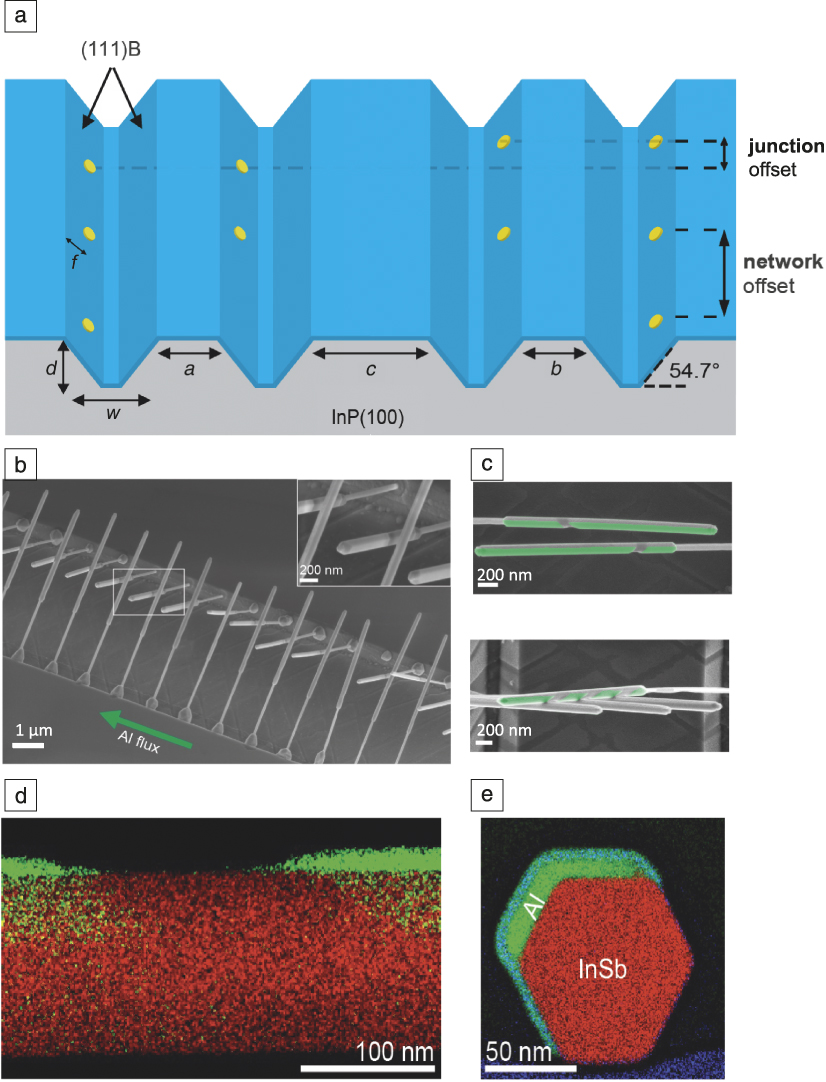
These samples were transferred to a molecular beam epitaxy chamber, for Al deposition. The Al flux is aligned parallel to the trench, such that wires standing in front provide a shadow for the wires standing behind. From Figure 4c, it is clear that the (green) aluminum film is interrupted due to shadow action of the front wire. This technique is generic and can be used to test many different semiconductor/superconductor combinations without the need to develop a selective etch for each material system.Reference Gazibegovic, Car, Zhang, Balk, Logan, De Moor, Cassidy, Schmits, Xu, Wang, Krogstrup, Op Het Veld, Zuo, Vos, Shen, Bouman, Shojaei, Pennachio, Lee, Van Veldhoven, Koelling, Verheijen, Kouwenhoven, Palmstrøm and Bakkers22 Multiple shadows are also possible when more wires are defined in front. TEM showed that the Al film is thin, uniform, and even crystalline. The energy-dispersive x-ray (EDX) analysis image in Figure 4d shows that the shadow region between the two superconducting islands (green) is clean (i.e., free of Al). From the EDX cross-sectional view in Figure 4e, the hexagonal shape of the wire can be recognized, and most importantly, the interface between the semiconductor and the superconductor is very sharp.
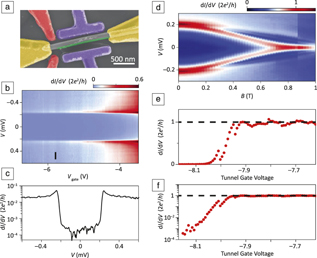
To study the electronic properties of these wires, devices containing the wires were fabricated with two normal contacts, as shown in Figure 5a. The tunneling spectrum shown in Figure 5b is clean without undesired resonances. The induced gap in the InSb wire shows steep slopes, and most importantly, the density of states in the gap is reduced significantly.Reference Gazibegovic, Car, Zhang, Balk, Logan, De Moor, Cassidy, Schmits, Xu, Wang, Krogstrup, Op Het Veld, Zuo, Vos, Shen, Bouman, Shojaei, Pennachio, Lee, Van Veldhoven, Koelling, Verheijen, Kouwenhoven, Palmstrøm and Bakkers22 The ratio between the normal conductance and the in-gap conductance is approximately two orders of magnitude, as can be seen in Figure 5c.
(a) Scanning electron microscope image of a device to study the electronic properties of the InSb/Al wires. The device includes normal (Au/Cr) contacts (yellow), tunnel barrier gates (red), gates to tune the chemical potential in the superconducting region (purple), and the superconducting island on the wire (green).Reference Zhang, Liu, Gazibegovic, Xu, Logan, Wang, Van Loo, Bommer, De Moor, Car, Op het Veld, Van Veldhoven, Koelling, Verheijen, Pendharkar, Pennachio, Shojaei, Lee, Palmstrøm, Bakkers, Das Sarma and Kouwenhoven28 (b) Tunneling spectrum (at magnetic field B = 0 T) showing the high quality of the device.Reference Gazibegovic, Car, Zhang, Balk, Logan, De Moor, Cassidy, Schmits, Xu, Wang, Krogstrup, Op Het Veld, Zuo, Vos, Shen, Bouman, Shojaei, Pennachio, Lee, Van Veldhoven, Koelling, Verheijen, Kouwenhoven, Palmstrøm and Bakkers22 (c) A line trace, of the data shown in (b) at the position indicated with the black line, showing the large ratio between the normal and the in-gap conductances.Reference Gazibegovic, Car, Zhang, Balk, Logan, De Moor, Cassidy, Schmits, Xu, Wang, Krogstrup, Op Het Veld, Zuo, Vos, Shen, Bouman, Shojaei, Pennachio, Lee, Van Veldhoven, Koelling, Verheijen, Kouwenhoven, Palmstrøm and Bakkers22 (d) Tunneling spectrum as a function of magnetic field. At around B = 0.7 T a zero-bias peak is formed.Reference Zhang, Liu, Gazibegovic, Xu, Logan, Wang, Van Loo, Bommer, De Moor, Car, Op het Veld, Van Veldhoven, Koelling, Verheijen, Pendharkar, Pennachio, Shojaei, Lee, Palmstrøm, Bakkers, Das Sarma and Kouwenhoven28 (e, f) Conductance at V = 0 mV as a function of the tunnel barrier height on a (e) linear and (f) logarithmic scale. The signal steeply increases with lowering the barrier height, and then sticks to a value of 2e 2/h.Reference Zhang, Liu, Gazibegovic, Xu, Logan, Wang, Van Loo, Bommer, De Moor, Car, Op het Veld, Van Veldhoven, Koelling, Verheijen, Pendharkar, Pennachio, Shojaei, Lee, Palmstrøm, Bakkers, Das Sarma and Kouwenhoven28 Note: I, tunnel current; V, tunnel potential; e, electron charge; h, Planck’s constant; V gate, gate potential.
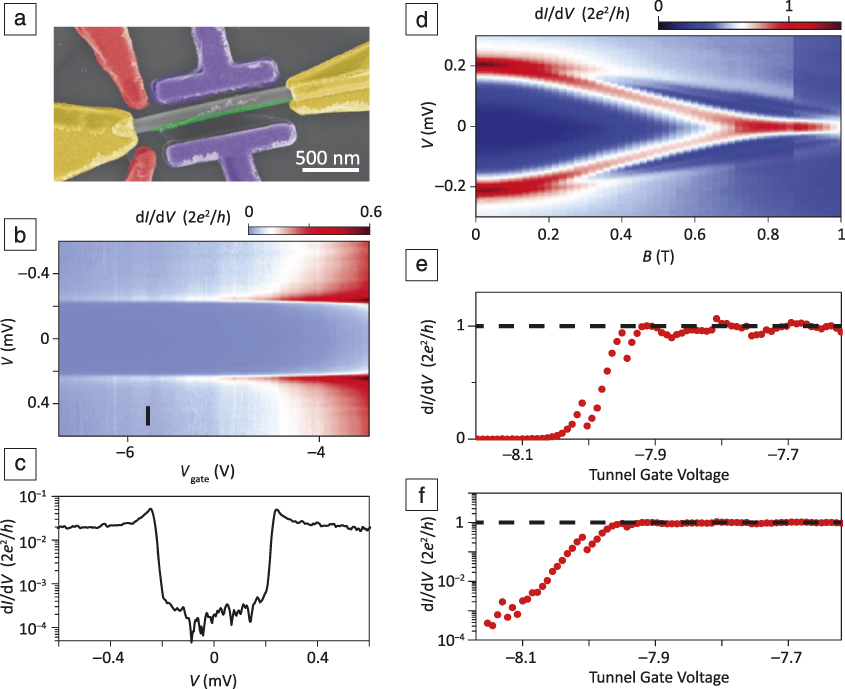
The next step is to search for Majorana states in the InSb/Al wires. Devices with local gates were fabricated to tune the tunnel barrier height (red gates in Figure 5a) and to tune the electrochemical potential in the superconducting part (purple gates in Figure 5a). In Figure 5d, a typical data set is shown as a function of magnetic field.Reference Zhang, Liu, Gazibegovic, Xu, Logan, Wang, Van Loo, Bommer, De Moor, Car, Op het Veld, Van Veldhoven, Koelling, Verheijen, Pendharkar, Pennachio, Shojaei, Lee, Palmstrøm, Bakkers, Das Sarma and Kouwenhoven28 The Andreev bound states, which form at the interface between a superconductor and a semiconductor and convert a Cooper pair in the superconductor into an electron and a hole in the semiconductor, are pushed to zero energy with increasing magnetic field, and these merge to form a zero-bias peak before the bulk superconducting gap is closed. Importantly, at B = 0.8 T the signal hits the value of exactly 2e 2/h. To study the robustness of the peak, the gate potential was tuned. The normal conductance, outside the superconducting gap, increased linearly by decreasing the tunnel barrier height (not shown).Reference Zhang, Liu, Gazibegovic, Xu, Logan, Wang, Van Loo, Bommer, De Moor, Car, Op het Veld, Van Veldhoven, Koelling, Verheijen, Pendharkar, Pennachio, Shojaei, Lee, Palmstrøm, Bakkers, Das Sarma and Kouwenhoven28 The trace at zero energy looks different with a signal that first steeply increases with decreasing barrier height, as shown in Figure 5e, and then saturates at a value of 2e 2/h for a broad potential range. The same data are shown in Figure 5f in a semilogarithmic plot to emphasize the nonlinear behavior. This is a robust quantized zero-bias peak, which we believe to be a strong piece of evidence for Majorana states.Reference Zhang, Liu, Gazibegovic, Xu, Logan, Wang, Van Loo, Bommer, De Moor, Car, Op het Veld, Van Veldhoven, Koelling, Verheijen, Pendharkar, Pennachio, Shojaei, Lee, Palmstrøm, Bakkers, Das Sarma and Kouwenhoven28
Devices to enable Majorana exchange
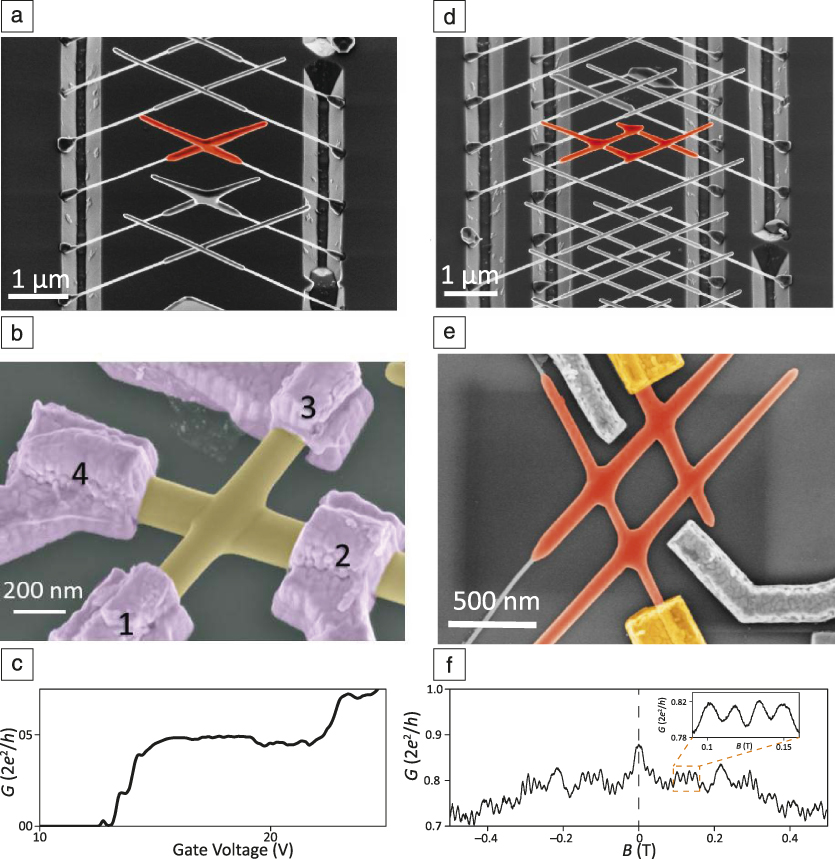
The second question regarding fabrication of devices to enable Majorana exchange operations is addressed by using the same substrate platform with trenches (Figure 4a) to grow wires from both sides.Reference Gazibegovic, Car, Zhang, Balk, Logan, De Moor, Cassidy, Schmits, Xu, Wang, Krogstrup, Op Het Veld, Zuo, Vos, Shen, Bouman, Shojaei, Pennachio, Lee, Van Veldhoven, Koelling, Verheijen, Kouwenhoven, Palmstrøm and Bakkers22 It is important to realize that InSb wires are epitaxially connected to the InP substrate, which means that all crystal orientations in these wires are identical to those in the substrate. When wires, growing from both sides as shown in Figure 6a, merge, they will, by definition, form a single crystal. The wires have a small junction offset (see Figure 4a), such that Au catalyst particles do not merge. The single-crystalline nature of the junction has been substantiated by TEM.Reference Car, Wang, Verheijen, Bakkers and Plissard29
(a) Scanning electron microscope (SEM) image of InSb nanowire crosses (orange) grown from the trenches as shown in Figure 4a.Reference Gazibegovic, Car, Zhang, Balk, Logan, De Moor, Cassidy, Schmits, Xu, Wang, Krogstrup, Op Het Veld, Zuo, Vos, Shen, Bouman, Shojaei, Pennachio, Lee, Van Veldhoven, Koelling, Verheijen, Kouwenhoven, Palmstrøm and Bakkers22 (b) SEM image of a nanowire cross device to test the electronic properties of the wire–wire junction. The contacts are numbered 1–4.Reference Fadaly, Zhang, Conesa-Boj, Car, Gül, Plissard, Op het Veld, Kölling, Kouwenhoven and Bakkers30 (c) Conductance between contacts 1 and 2 showing a conductance plateau at e 2/h (at magnetic field B = 5 T), signifying ballistic transport.Reference Fadaly, Zhang, Conesa-Boj, Car, Gül, Plissard, Op het Veld, Kölling, Kouwenhoven and Bakkers30 (d) SEM image of an InSb nanowire hashtag (orange) grown from multiple trenches.Reference Gazibegovic, Car, Zhang, Balk, Logan, De Moor, Cassidy, Schmits, Xu, Wang, Krogstrup, Op Het Veld, Zuo, Vos, Shen, Bouman, Shojaei, Pennachio, Lee, Van Veldhoven, Koelling, Verheijen, Kouwenhoven, Palmstrøm and Bakkers22 (e) SEM image of a hashtag device with two ohmic contacts (yellow) and two gate contacts (gray).Reference Gazibegovic, Car, Zhang, Balk, Logan, De Moor, Cassidy, Schmits, Xu, Wang, Krogstrup, Op Het Veld, Zuo, Vos, Shen, Bouman, Shojaei, Pennachio, Lee, Van Veldhoven, Koelling, Verheijen, Kouwenhoven, Palmstrøm and Bakkers22 (f) Conductance as a function of magnetic field. The interference fringes demonstrate phase coherent transport through the hashtag. The inset shows the amplitude of the oscillation.Reference Gazibegovic, Car, Zhang, Balk, Logan, De Moor, Cassidy, Schmits, Xu, Wang, Krogstrup, Op Het Veld, Zuo, Vos, Shen, Bouman, Shojaei, Pennachio, Lee, Van Veldhoven, Koelling, Verheijen, Kouwenhoven, Palmstrøm and Bakkers22 Note: G, conductance; e, electron charge; h, Planck’s constant.
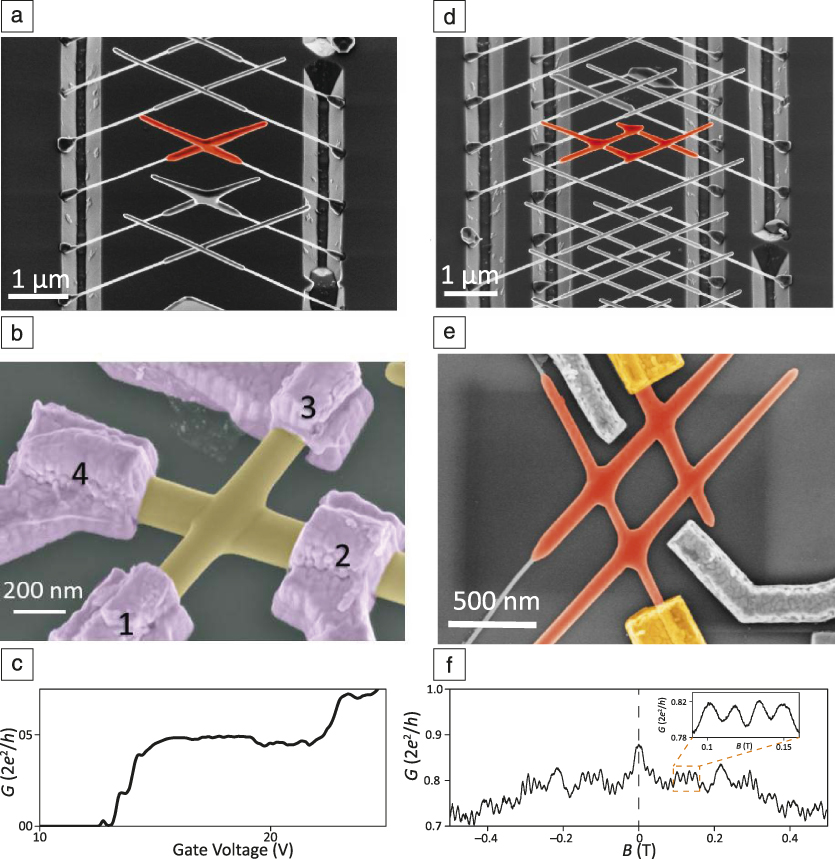
The electronic quality of the junction of these merged wires was investigated by defining four ohmic contacts to the cross and measuring transport between all the contact combinations (Figure 6b). Transport between contacts 1 and 2 was measured across the wire–wire junction; quantized conductance plateaus were observed, as shown in Figure 6c, demonstrating that transport across the junction was ballistic.Reference Fadaly, Zhang, Conesa-Boj, Car, Gül, Plissard, Op het Veld, Kölling, Kouwenhoven and Bakkers30 This means that the wire–wire contacts are of high quality. More complicated structures can be realized by merging more wires. For instance, by merging two wires from the left and two from the right, a so-called “hashtag” or semiconductor loop is formed (Figure 6d). Such loops are required for Majorana braiding experiments.Reference Karzig, Knapp, Lutchyn, Bonderson, Hastings, Nayak, Alicea, Flensberg, Plugge, Oreg, Marcus and Freedman20 To measure transport through these structures, the hashtags are transferred by a micromanipulator to a device substrate, thus contacts are defined (Figure 6e). Electrons are injected from one of the yellow ohmic contacts, and left-moving electrons can interfere with right-moving electrons if their phase is conserved. It is important to demonstrate phase-coherent transport in these devices, since the Majorana exchange operations are based on the phase in the system.Reference Karzig, Knapp, Lutchyn, Bonderson, Hastings, Nayak, Alicea, Flensberg, Plugge, Oreg, Marcus and Freedman20 In Figure 6f, the conductance is plotted as a function of the magnetic field, and interference fringes are clear, which is the first indication for phase-coherent transport. The frequency of the interference pattern is determined by taking the Fourier transform. The dimensions of the InSb hashtags were varied by changing the spacings of the trenches in the substrate (Figure 4a). The frequency scales linearly with the area of the loop, demonstrating phase-coherent transport.Reference Gazibegovic, Car, Zhang, Balk, Logan, De Moor, Cassidy, Schmits, Xu, Wang, Krogstrup, Op Het Veld, Zuo, Vos, Shen, Bouman, Shojaei, Pennachio, Lee, Van Veldhoven, Koelling, Verheijen, Kouwenhoven, Palmstrøm and Bakkers22 We now have all components ready to start with the first Majorana braiding, or exchange, experiments, which is the subject of future work.
Conclusion and outlook
An approach to fabricate out-of-plane single-crystalline nanowire networks was developed.Reference Gazibegovic, Car, Zhang, Balk, Logan, De Moor, Cassidy, Schmits, Xu, Wang, Krogstrup, Op Het Veld, Zuo, Vos, Shen, Bouman, Shojaei, Pennachio, Lee, Van Veldhoven, Koelling, Verheijen, Kouwenhoven, Palmstrøm and Bakkers22 By using the same platform, we can shadow deposit superconductors on the wire structures, resulting in unprecedented device quality.Reference Gazibegovic, Car, Zhang, Balk, Logan, De Moor, Cassidy, Schmits, Xu, Wang, Krogstrup, Op Het Veld, Zuo, Vos, Shen, Bouman, Shojaei, Pennachio, Lee, Van Veldhoven, Koelling, Verheijen, Kouwenhoven, Palmstrøm and Bakkers22,Reference Zhang, Liu, Gazibegovic, Xu, Logan, Wang, Van Loo, Bommer, De Moor, Car, Op het Veld, Van Veldhoven, Koelling, Verheijen, Pendharkar, Pennachio, Shojaei, Lee, Palmstrøm, Bakkers, Das Sarma and Kouwenhoven28 This approach is generic and can be used for different semiconductor–superconductor combinations. For the fabrication of the devices, a few lithography steps are still needed, and every fabrication step may deteriorate the wire quality. The question is whether it is possible to realize a complete quantum device in situ in high vacuum. An approach was developed to define more sophisticated shadow structures.
On the same substrate platform, for instance, nanoflakes can be formed by merging two wires. By using such flakes and deposition of different materials from different angles, complete Majorana devices can be grown in vacuum. Hashtag structures can be used for one-half of a topological qubit. For a full qubit, a 3 × 3 nanowire network is needed. To scale up the size and the yield of network devices, a selective area growth (SAG) approach was developed by a number of groups.Reference Vaitiekenas, Whiticar, Deng, Krizek, Sestoft, Palmstrøm, Marti-Sanchez, Arbiol, Krogstrup, Casparis and Marcus31,Reference Aseev, Fursina, Boekhout, Krizek, Sestoft, Borsoi, Heedt, Wang, Binci, Martí-Sánchez, Swoboda, Koops, Uccelli, Arbiol, Krogstrup, Kouwenhoven and Caroff32 The data are promising so far, but the wire quality is not yet at a level comparable to VLS-grown nanowires. Another challenge for these SAG networks is to invent smart structures for in situ shadow deposition.
Acknowledgments
Thanks to S. Gazibegović, D. Car, R. Op het Veld, G. Badaway, S. Schellingerhout, M. Rossi, and S. Plissard for the growth of the InSb structures; J. Logan, M. Pendharkar, J.S. Lee, and C. Palmstrøm for Al deposition; M. Verheijen for TEM studies; and E. Fadaly, S. Nadj-Perge, S. Frolov, Ö. Gül, L.P. Kouwenhoven, and H. Zhang for the transport measurements. This work has been supported by the European Research Council, the Dutch Organization for Scientific Research, the Foundation for Fundamental Research on Matter and Microsoft Corporation Station-Q. Solliance, a solar energy R&D initiative of ECN, TNO, Holst, TU/e, imec, and Forschungszentrum Jülich, and the Dutch province of Noord-Brabant are acknowledged for funding the TEM facility. Thanks also to the Office of Naval Research for financial support.

Erik Bakkers is a professor in the Department of Applied Physics at Eindhoven University of Technology, and in the Quantum Transport Group at Delft University, The Netherlands. He obtained his PhD degree in nanoelectrochemistry at the University of Utrecht, The Netherlands. He founded a research group at Philips Research in Eindhoven, in 2000, focused on nanowires. His current research focuses on quantum materials, to detect and manipulate Majorana states, and in hexagonal silicon, to demonstrate and exploit the predicted direct bandgap in this material. His awards include the Technical Review Award from the Massachussetts Institute of Technology, Vici Grant, European Research Council Consolidator Grant, and the Science AAAS Newcomb Cleveland Prize. Bakkers can be reached by email at e.p.a.m.bakkers@tue.nl.