INTRODUCTION
Efficient use of nitrogen (N) by wheat is needed to sustain or increase yield and quality, while reducing the negative impacts of crop and fertilizer production on the environment (Hirel et al. Reference Hirel, Le Gouis, Ney and Gallais2007; Foulkes et al. Reference Foulkes, Hawkesford, Barraclough, Holdsworth, Kerr, Kightley and Shewry2009; Sylvester-Bradley & Kindred Reference Sylvester-Bradley and Kindred2009). Increasing N uptake efficiency (NUpE) to recover more N in the above-ground crop (Crop N yield (Y)) reduces pollution with nitrous oxides, volatilized ammonia and leached nitrate (Raun & Johnson Reference Raun and Johnson1999). Recovering more N from the grain (Grain NY) as protein (crudely, N×5·7) is particularly important to maintain the bread-making potential of higher-yielding wheat crops (Loffler et al. Reference Loffler, Rauch and Busch1985; Slafer et al. Reference Slafer, Andrade and Feingold1990; Calderini et al. Reference Calderini, Torres-Leon and Slafer1995). Increasing the efficiency with which the canopy uses N to produce biomass (N utilization efficiency (NUtE)) or grain (NUtEg)) is also important to maintain or increase yields while constraining the application of N fertilizers, and hence improve the energy balance of the crop (White Reference White1981; Murphy & Helal Reference Murphy, Helal, Murphy, Bramm and Walker1996; Rosenberger et al. Reference Rosenberger, Kaul, Senn and Aufhammer2001). Moll et al. (Reference Moll, Kamprath and Jackson1982) multiplied NUpE and NUtEg to derive N-use efficiency (NUE), i.e. the grain yield of DM (Grain DMY) divided by the available (fertilizer+soil mineral) N. There is an increasing economic imperative to improve NUE as the N fertilizer: grain price ratio increases with response to rising energy costs for fixing N (Sylvester-Bradley & Kindred Reference Sylvester-Bradley and Kindred2009).
There is a clear requirement to understand and exploit genetic effects to improve NUE (Hirel et al. Reference Hirel, Le Gouis, Ney and Gallais2007). Reduced height (Rht) alleles are widely incorporated in wheat-breeding programmes to produce semi-dwarf wheat (Chapman et al. Reference Chapman, Mathews, Trethowan and Singh2007). The commonly used Rht-B1b and Rht-D1b (previously termed Rht1 and Rht2) semi-dwarfing alleles from ‘Norin 10’ reduce sensitivity to endogenous gibberellic acid (GA) (Murase et al. Reference Murase, Hirano, Sun and Hakoshima2008), and individually reduce height by about 15% (Gooding Reference Gooding, Khan and Shewry2009). In the UK, Rht-D1b has been widely used in elite lines since the 1970s; cvars Hobbit (1977) and Mardler (1978) were early examples (Austin et al. Reference Austin, Bingham, Blackwell, Evans, Ford, Morgan and Taylor1980)), although Rht-B1b has also been used more recently (e.g. cvar Robigus). More potent alleles, conferring severe dwarfism (>30% height reduction) are available at both loci: Rht-Blc (previously Rht3) from ‘Tom thumb’, and Rht-D1c (previously Rht10) from ‘Ai-bian’ (Borner et al. Reference Borner, Roder and Korzun1997). Alternatively, reductions in height can be achieved without reducing sensitivity to GA: Rht8c confers semi-dwarfism and is present in many Southern European wheats, often linked with Ppd-D1a-mediated photoperiod sensitivity and more rapid development (Worland et al. Reference Worland, Korzun, Roder, Ganal and Law1998); Rht12 is a severe-dwarfing, gamma ray-induced allele from ‘Karcagi 522’ (Korzun et al. Reference Korzun, Roder, Worland and Borner1997).
Dwarfing alleles in wheat must affect NUE because they influence Grain DMY at constant N availabilities (Flintham et al. Reference Flintham, Borner, Worland and Gale1997; Addisu et al. Reference Addisu, Snape, Simmonds and Gooding2010). In such circumstances, adding semi-dwarfing alleles to excessively tall backgrounds increases Grain DMY, principally through increasing grain populations and the proportion of above-ground crop biomass in the grain (dry matter harvest index (DMHI); Flintham et al. Reference Flintham, Borner, Worland and Gale1997). Much less is known, however, concerning the effects on NUE components – NUpE and NUtEg. Gale & Youssefian (Reference Gale, Youssefian and Russell1985) found Rht-B1b, Rht-D1b and Rht-B1c to either have no effect on Grain NY even when Grain DMY was increased, or to reduce Grain NY more than Grain DMY (as was the case for Rht-B1c). Gooding et al. (Reference Gooding, Cosser, Thompson, Davies, Froud-Williams, Isart and Llerena1997) found Rht-B1b to increase Grain NY but reported reductions in grain N concentrations (or increased NUtE of the grain), as did Gale & Youssefian (Reference Gale, Youssefian and Russell1985). When Flintham & Gale (Reference Flintham and Gale1983) found Rht-B1c to reduce grain N concentrations significantly, despite appearing to reduce Grain DMY, they speculated that this may have been due to reduced availability of crop N for remobilization; Austin et al. (Reference Austin, Ford, Edrich and Blackwell1977) had suggested previously that dwarfing may be associated with reduced NUpE, and Wojciechowski et al. (Reference Wojciechowski, Gooding, Ramsay and Gregory2009) found severe dwarfing to be associated with reduced rooting in the field. Cosser (Reference Cosser1996), however, found no effect of Rht-B1b or Rht-D1b on Crop NY.
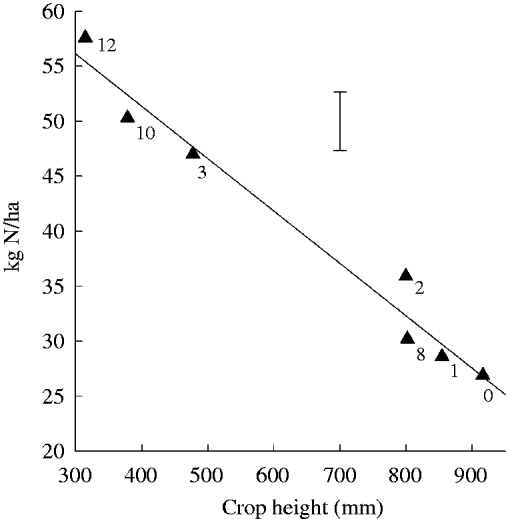
Dwarfing alleles can increase or reduce DMHI depending on the height of the background, and the degree of shortening achieved (Flintham et al. Reference Flintham, Borner, Worland and Gale1997; Gooding Reference Gooding, Khan and Shewry2009), with likely implications for NUtEg (Ortiz-Monasterio et al. Reference Ortiz-Monasterio, Sayre, Rajaram and Mcmahon1997). Fernandez et al. (Reference Fernandez, Becraft, Yin and Lubberstedt2009) argue that impaired GA synthesis or signalling in dwarfed cereals would reduce Crop DMY and this can be demonstrated in wheat (Addisu et al. Reference Addisu, Snape, Simmonds and Gooding2009), but little is known concerning effects on NUtE of the crop biomass.
It is evident that genotype effects on components of NUE interact with cropping system. Barraclough et al. (Reference Barraclough, Howarth, Jones, Lopez-Bellido, Parmar, Shepherd and Hawkesford2010) found no correlation between a cultivar's ranking for Crop NY when no fertilizer N was supplied, compared to when 200 kg N/ha was applied around the start of stem extension. Modern, shorter wheats appear to be able to recover fertilizer N better when it is applied at and after the start of stem extension (Foulkes et al. Reference Foulkes, Sylvester-Bradley and Scott1998). However, alleles conferring reduced sensitivity to GA can sometimes reduce earlier N capture (Addisu et al. Reference Addisu, Snape, Simmonds and Gooding2009), and more modern, shorter lines can be poorer at exploiting soil N (i.e. not from contemporary fertilizer applications) (Foulkes et al. Reference Foulkes, Sylvester-Bradley and Scott1998). These latter effects would be particularly unwelcome in more extensive, and/or organic systems where a greater proportion of N is available in earlier growth stages (GSs), particularly if the wheat follows a soil fertility building phase such as a legume-rich ley or green manure (Baresel et al. Reference Baresel, Zimmermann and Reents2008; Dawson et al. Reference Dawson, Huggins and Jones2008; Wolfe et al. Reference Wolfe, Baresel, Desclaux, Goldringer, Hoad, Kovacs, Loschenberger, Miedaner, Ostergard and van Bueren2008). It is also likely that dwarfing allele effects on NUtEg will interact with cropping system as improvements in DMHI associated with semi-dwarfing alleles are achieved less reliably in extensive and/or organic systems of production (Addisu et al. Reference Addisu, Snape, Simmonds and Gooding2010).
The present work seeks to address three aspects of the effects of dwarfing genes on the N economy of wheat through the use of near isogenic lines (NILs). Firstly, there is a need to clarify the above responses by assessing the effects of a range of alleles and their combination that confer different height reductions with GA insensitivity (Rht-B1b, Rht-D1b, Rht-B1c, Rht-D1c). Secondly, the effects of dwarfing alleles that do not rely on GA insensitivity such as Rht12 and Rht8c+Ppd-D1a are compared. Finally, the effects of dwarfing alleles on the N economy of wheat grown in contrasting production systems (‘conventional’ v. ‘organic’) are compared.
MATERIALS AND METHODS
Crop husbandry and experimental design
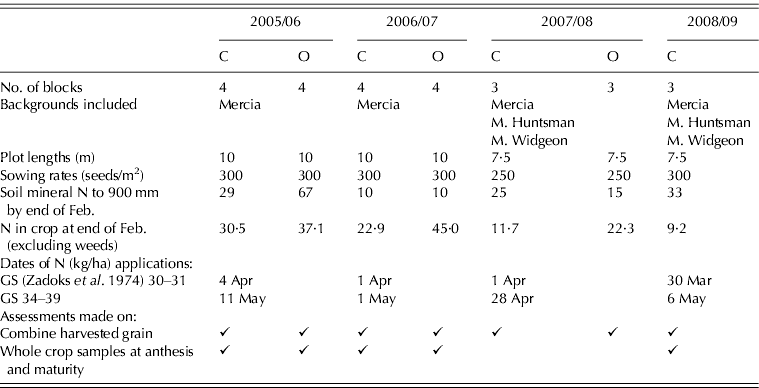
Seven field experiments conducted between 2005 and 2009 compared NILs of wheat varying for major dwarfing genes, replicated in complete randomized blocks (Table 1). Replication, plot lengths and seed rate varied with experiment (Table 1). All experiments were conducted within the same 10 ha site at the Crops Research Unit, Sonning, University of Reading, UK (51°29′N, 0°56′W, 35 m asl), on a free-draining sandy loam (9% (by volume) clay, particle size <0·2 μm; 19% silt, 2–20 μm; 72% sand, 20–2000 μm; pH=6·3–7·1) overlying coarse red-brown sand. The site is divided between an area receiving synthetic agrochemicals and fertilizers, managed conventionally, and an area managed organically since 2001 (Addisu et al. Reference Addisu, Snape, Simmonds and Gooding2009). The experiments on both the conventional and organic areas followed 2–3 year leys: perennial ryegrass plus clover on the organic area, and unfertilized perennial ryegrass on the conventional area. The aim was to contrast the high autumn N availability typical after a clover-rich ley in organic rotations with the more depleted autumn N-availability likely in many conventional combinable crop rotations. Before ploughing, the grass ley in the conventional area was destroyed with 1·8 kg/ha glyphosate; an insecticide, chlorpyriphos (0·45 kg/ha) was also applied in 2006. Soil was tested for pH, phosphorous, potassium and magnesium availability (MAFF 1986), and corrective nutrients applied as appropriate. In the organic area the ley was tightly mown. On both areas, turf was buried by mould-board ploughing to 300 mm. On the organic areas, stale-seed beds were prepared and destroyed three times on a 10-day cycle with a power harrow (Lely Roterra), before a final pass with the power harrow on both areas.
Experimental details on conventional (C) and organic (O) areas

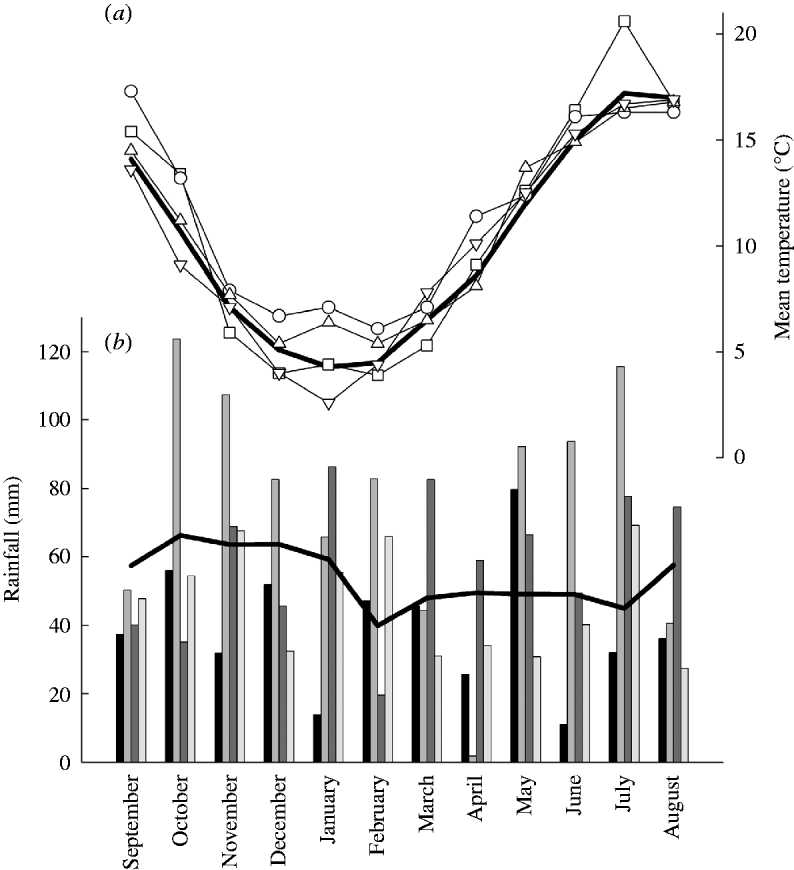
Untreated seeds were drilled on a single day within each year between 21 September and 4 October at a nominal depth of 50 mm, in rows 120 mm apart in 2 m-wide plots separated by 0·5 m double-width track wheelings. Weather data (Fig. 1) were recorded at an automated meteorological station at the site.
Monthly weather data at the experimental site. (a) Mean of daily maximum and minimum temperature for 2005/06 (□), 2006/07 (○), 2007/08 (△) and 2008/09 (▽). (b) Rainfall for successive years, left to right. Heavy lines are the 45 year means for the site.

Conventional management of the wheat typically involved: herbicide applications at GS (Zadoks et al. Reference Zadoks, Chang and Konzak1974) 19 and/or 31–32; and fungicide applications at GS 30–31, 39 and 59. No plant growth regulators were applied. Full details of sprays used for 2005/06 to 2007/08 are available in Addisu et al. (Reference Addisu, Snape, Simmonds and Gooding2010). In each year, 100 kg N/ha+40 kg S/ha was applied as a mixture of ammonium nitrate and ammonium sulphate at GS 30–31. A further 100 kg N/ha was applied as ammonium nitrate between GS 34 and GS 39. In the organic area, wheat was established after 2 or 3 years of perennial ryegrass plus clover ley.
All experiments included seven NILs in a cvar Mercia background (rht (tall), Rht-B1b, Rht-D1b, Rht-B1c, Rht8c+Ppd-D1a, Rht-D1c, Rht12). Mercia was introduced commercially in 1983, and was the last widely used winter wheat cultivar suited for bread-making in the UK, which did not have a major semi-dwarfing gene. Despite the lack of an Rht allele, Mercia was only slightly taller than cvar Hereward (Rht-D1b; Anon 1991), its successor as the major bread-making wheat cultivar in the UK. Hereward is actually shorter than more recent introductions such as Xi19 (2002; Rht-D1b) and Solstice (2002; Rht-D1b), and comparable to cvar Gallant (2009) (HGCA 2009), i.e. it can be considered that the height of Mercia without a major Rht allele is within the range commonly observed for modern commercial releases in the UK that have an Rht allele. In the last 2 years, therefore, NILs with taller backgrounds were included in the experiment, i.e. cvar Maris Widgeon (first registered 1964) and cvar Maris Huntsman (first registered 1971), comprising (rht (tall), Rht-B1b, Rht-D1b, Rht-B1c, Rht-B1b+Rht-D1b, Rht-D1b+Rht-B1c). Sources of dwarfing genes and markers used are detailed in Addisu et al. (Reference Addisu, Snape, Simmonds and Gooding2009).
Nitrogen availability and assessments
Nitrogen availability is calculated as the sum of soil N supply plus any N applied as fertilizer. In the conventional area, the soil N supply is taken as the above-ground crop N at maturity of plots receiving robust agrochemical programmes for crop protection, but no fertilizer N (Sylvester-Bradley & Kindred Reference Sylvester-Bradley and Kindred2009). This value averaged 78 kg N/ha for the 4-year period 2005/6 to 2008/9 which, combined with the fertilizer N, provided 278 kg of available N. In the organic areas soil N supply was taken as the amount in the above-ground crop of cvar Mercia rht(tall) lines plus the amount of N in the weeds at crop maturity. This sum averaged 173 kg N/ha for the 3-year period 2005/6 to 2008/9. The ratio of soil total carbon : total nitrogen concentrations (mg/g DM, by oxidative combustion) for the site average 9·0 : 0·9, 5·8 : 0·6 and 7·5 : 0·3, for the 0–300, 300–600 and 600–900 mm depth horizons, respectively. Soil mineral N was also determined from bulked samples collected to 900 mm by auger from the experimental site at the end of February; and this added to the crop N at the same time gave an assessment of available N before stem extension (Table 1, MAFF 2000).
Crop height was calculated as the mean of three measurements with a rising disc of polystyrene (Peel Reference Peel1987): at anthesis, the end of grain filling and at harvest maturity. Ear populations were assessed from between two and four randomly placed 0·1 m2 circular quadrats per plot during the week before combine harvesting. For each of the seven experiments, the central portion of each plot was combine harvested at maturity with a 1·3 m cutter bar, i.e. the combined area varied between 13 and 9·75 m2 for the 10 and 7·5 m long plots (Table 1), respectively. The effective distance from the edge of a sampled and harvested area to the outside row of a neighbouring plot was, therefore, maintained at 0·85 m to minimize the shading of short lines growing next to taller lines. Mean grain weights were determined from a divided sample of at least 250 grains per plot. Grain samples (20 g per plot) were dried at 80°C for 48 h to determine moisture content, and to adjust yields and mean grain weights to DM basis. Samples (100 g per plot) were milled using a Laboratory Mill 3100 (Perten Instruments AB, Huddinge, Sweden). Resultant wholemeal flour was dried and assessed for N concentration using oxidative combustion with a LECO FP-528 (LECO Instruments, Stockport, UK). Nitrogen per grain (NpG) was calculated from mean grain weight and N concentration. Results from the combine-harvested grain allowed the calculation of NUE, and Grain NY:


Additionally NUtE of the grain was calculated as the inverse of grain N concentration (Foulkes et al. Reference Foulkes, Sylvester-Bradley and Scott1998):

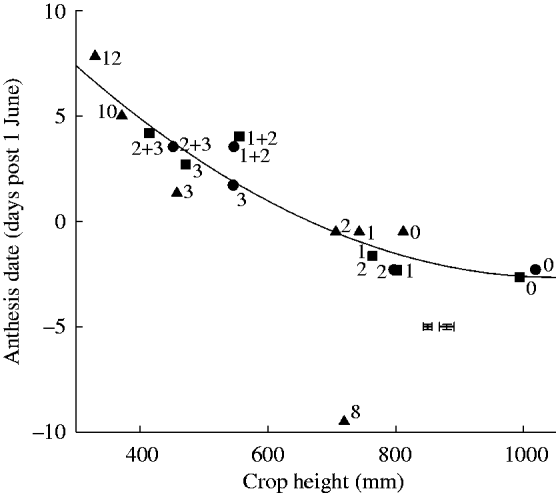
In both the conventional and organic areas in 2006 and 2007, and only the conventional area in 2009, N uptake and partitioning between anthesis and harvest maturity was assessed from destructive samples (1×0·5 m quadrat per plot per assessment in 2006 and 2007, and 3×1 m row lengths per plot per assessment in 2009). At anthesis (GS 65), the above-ground crop was collected, dried, weighed and milled. Date of anthesis, and hence date of sampling, varied among backgrounds and alleles (Fig. 2). At harvest maturity, ears were removed and threshed, with grain and chaff being collected separately. Samples at harvest maturity were taken at the same time for all alleles. Nitrogen concentration was determined for the vegetative and grain tissues as described for the combine harvested grain. The destructive samples allowed the interpretation of effects on Grain NY in terms of above-ground Crop NY and above-ground N harvest index (NHI), or more functionally, as the sum of N lost from the vegetative tissue (assumed to be remobilized N (RemobN)), and the net N taken up in to the above-ground crop, between anthesis and maturity (late N uptake (LNUp)) (Cox et al. Reference Cox, Qualset and Rains1986; Gooding et al. Reference Gooding, Gregory, Ford and Pepler2005; Hirel et al. Reference Hirel, Le Gouis, Ney and Gallais2007):


Remobilization efficiency (Remobeff) of N is expressed as a proportion of N in the crop at anthesis not present in straw (non-grain) components at harvest (Cox et al. Reference Cox, Qualset and Rains1986; Slafer et al. Reference Slafer, Andrade and Feingold1990):

The destructive samples also allowed the calculation of NUpE of the above-ground crop; the NUtE to produce biomass and grain (NUtEg); and an assessment of Grain NY and NUtE of the grain not confounded by any effects of alleles on combine harvesting efficiency.


NILs differing in dwarfing alleles in cultivar backgrounds of winter wheat cvars Mercia (triangles, mean of 2006–2009), Maris Huntsman (squares, 2008 and 2009) and Maris Widgeon (circles, 2008 and 2009), on anthesis date. Numerals 0, 1, 2, 3, 8, 10 and 12 correspond to rht(tall), Rht-B1b, Rht-D1b, Rht B1c, Rht8c+Ppd-D1a, Rht-D1c, and Rht12, respectively. Effects of background and year have been removed; see text for details. Fitted curve (allele 8 omitted from fit) is quadratic. Error bars are single s.e.d.s (132 d.f.) for comparing alleles within Mercia (left) or within the other backgrounds (right).

Statistical analyses
Genstat 10 was used for the analysis of residual maximum likelihood (REML) to investigate main effects and interactions between system and allele in the Mercia background, where system and allele combinations were replicated over years, i.e. the fixed model was System×Allele and the random model comprised Year/System/Block/. This analysis revealed significant interactions between system and allele (Table 2). Analyses using all backgrounds and alleles were therefore assessed within each growing system with the fixed model of Background (cvars Mercia, Maris Huntsman or Maris Widgeon)×Allele, and the random model of Year/Block/. The relationships between allele effects on height (presumed explanatory variable) and allele effects on response variables were investigated by quadratic regression with background as a grouping factor (Fitted model=pol(ht;2)+background). For presentation purposes the main effects of background on the response variates have been removed by subtracting the background effects on the regression constant so as to rebase the constant to that of Mercia. Finally, to test statistically the effect of system on the height of NILs needed to maximize NUE, quadratic regressions were fitted within each year and system, and peak height derived empirically before subjecting estimated peak heights to analysis of variance (Block structure=year; treatment structure=system).
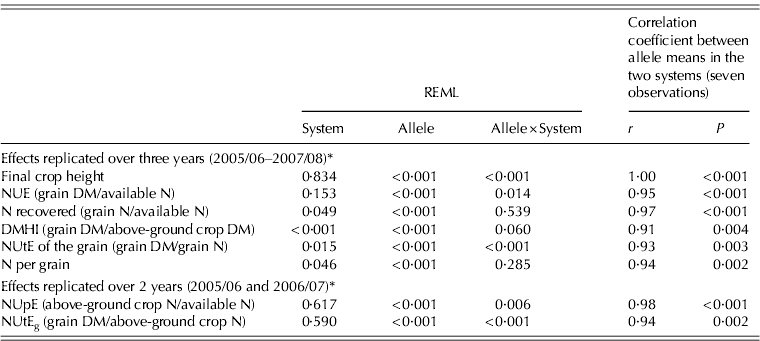
F probabilities and correlation coefficients for effects of Rht allele and system (organic or conventional) in NILs of winter wheat cvar Mercia for components of NUE

* Denominator d.f. for effects of allele and allele×system for 3- and 2-year analyses=120 and 84, respectively; denominator d.f. for main effect of system is 2 and 1 respectively.
RESULTS
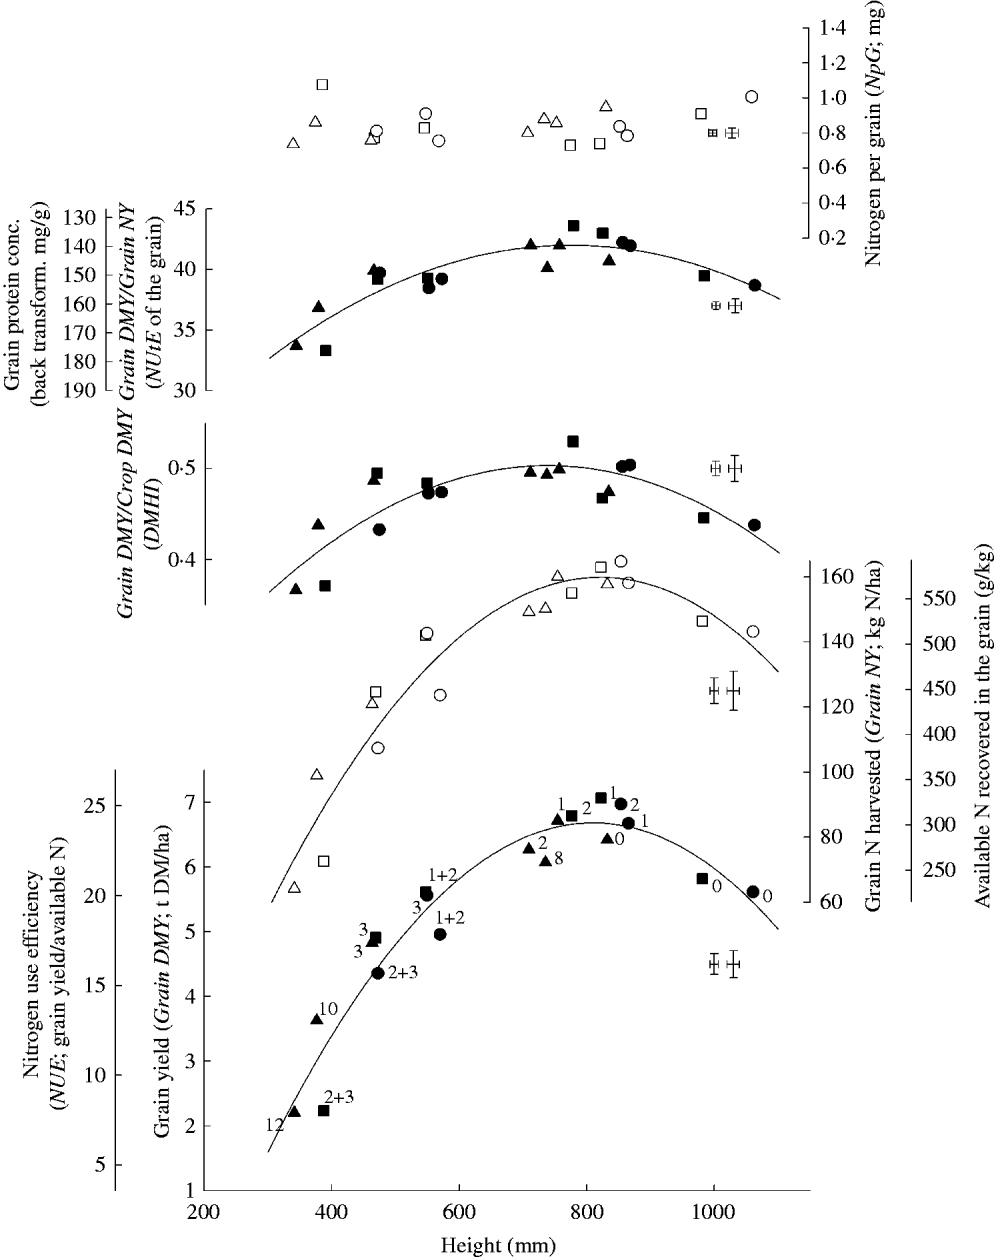
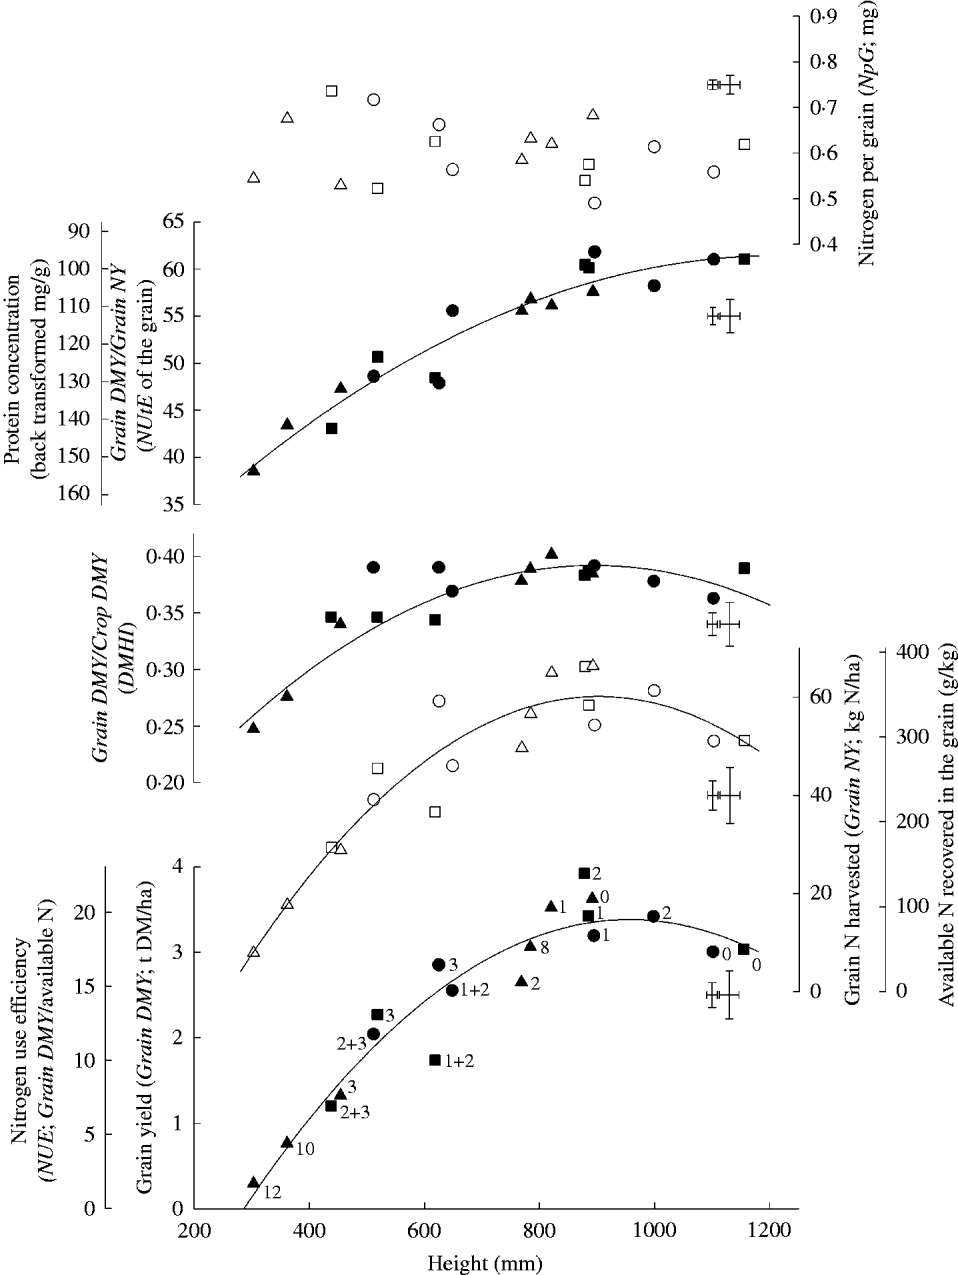
There were significant (P<0·05) system×allele interactions amongst the Mercia NILs for NUE and its components, NUpE and NUtEg (Table 2). Interactions were largely a result of the scale of the differences between alleles, rather than relative differences or ranking position within systems, as demonstrated by high levels of correlation in allele performance between the two systems (Table 2). Nonetheless, Rht-D1b in Mercia had no effect on the NUE in the conventional system (Fig. 3), but significantly reduced yield (compared with Mercia rht (tall)) in the organic system (Fig. 4). In contrast, adding semi-dwarfing alleles Rht-B1b and Rht-D1b to the taller backgrounds Maris Widgeon and Maris Huntsman increased NUE in the conventional system (Fig. 3), but not by a statistically significant margin in the organic system (Fig. 4). In both conventional and organic experiments the response of NUE, Grain NY, NUtE of the combine-harvested grain and DMHI to height deviated significantly from linearity (Figs 3 and 4). Over the range of heights observed the quadratic fits appeared appropriate and in each case the quadratic effect was negative and very highly significant (P<0·001). Fitted negative quadratic effects were also significant (P<0·05) for NUE and a number of its components in the hand harvests in the conventional experiments (Figs 5e–h, k–m and 6). For the hand harvests in the organic area, only samples from Mercia NILs were available, substantially reducing the range and number of heights available. For the hand harvests, therefore, only linear fits could be supported statistically (Fig. 7) except for NUtEg and NHI (Fig. 8).
The relationship of crop height of conventionally grown NILs differing in dwarfing alleles in cultivar backgrounds of winter wheat cvars Mercia (triangles, means of 2006–2009), Maris Huntsman (squares, 2008 and 2009), and Maris Widgeon (circles, 2008 and 2009) with DM and N in combine-harvested wheat grain, DMHI and NUtE in grain. Numerals 0, 1, 2, 3, 8, 10 and 12 correspond to alleles as described in Fig. 2. Effects of background and year have been removed; see text for details. Fitted curves are quadratic. Error bars are single s.e.d.s (132 d.f.) for comparing alleles within Mercia (left) or within the other backgrounds (right).

The relationship of crop height of organically grown NILs differing in dwarfing alleles in cultivar backgrounds of winter wheat cvars Mercia (triangles, means of 2006–2008), Maris Huntsman (squares, 2008), and Maris Widgeon (circles, 2008) with DM and N in combine-harvested wheat grain, DMHI and NUtE in grain. Numerals 0, 1, 2, 3, 8, 10 and 12 correspond to alleles as described in Fig. 2. Main effects of background have been removed; see text for details. Fitted curves are quadratic. Error bars are s.e.d.s (84 d.f.) for comparing alleles within Mercia (left) or within the other backgrounds (right).

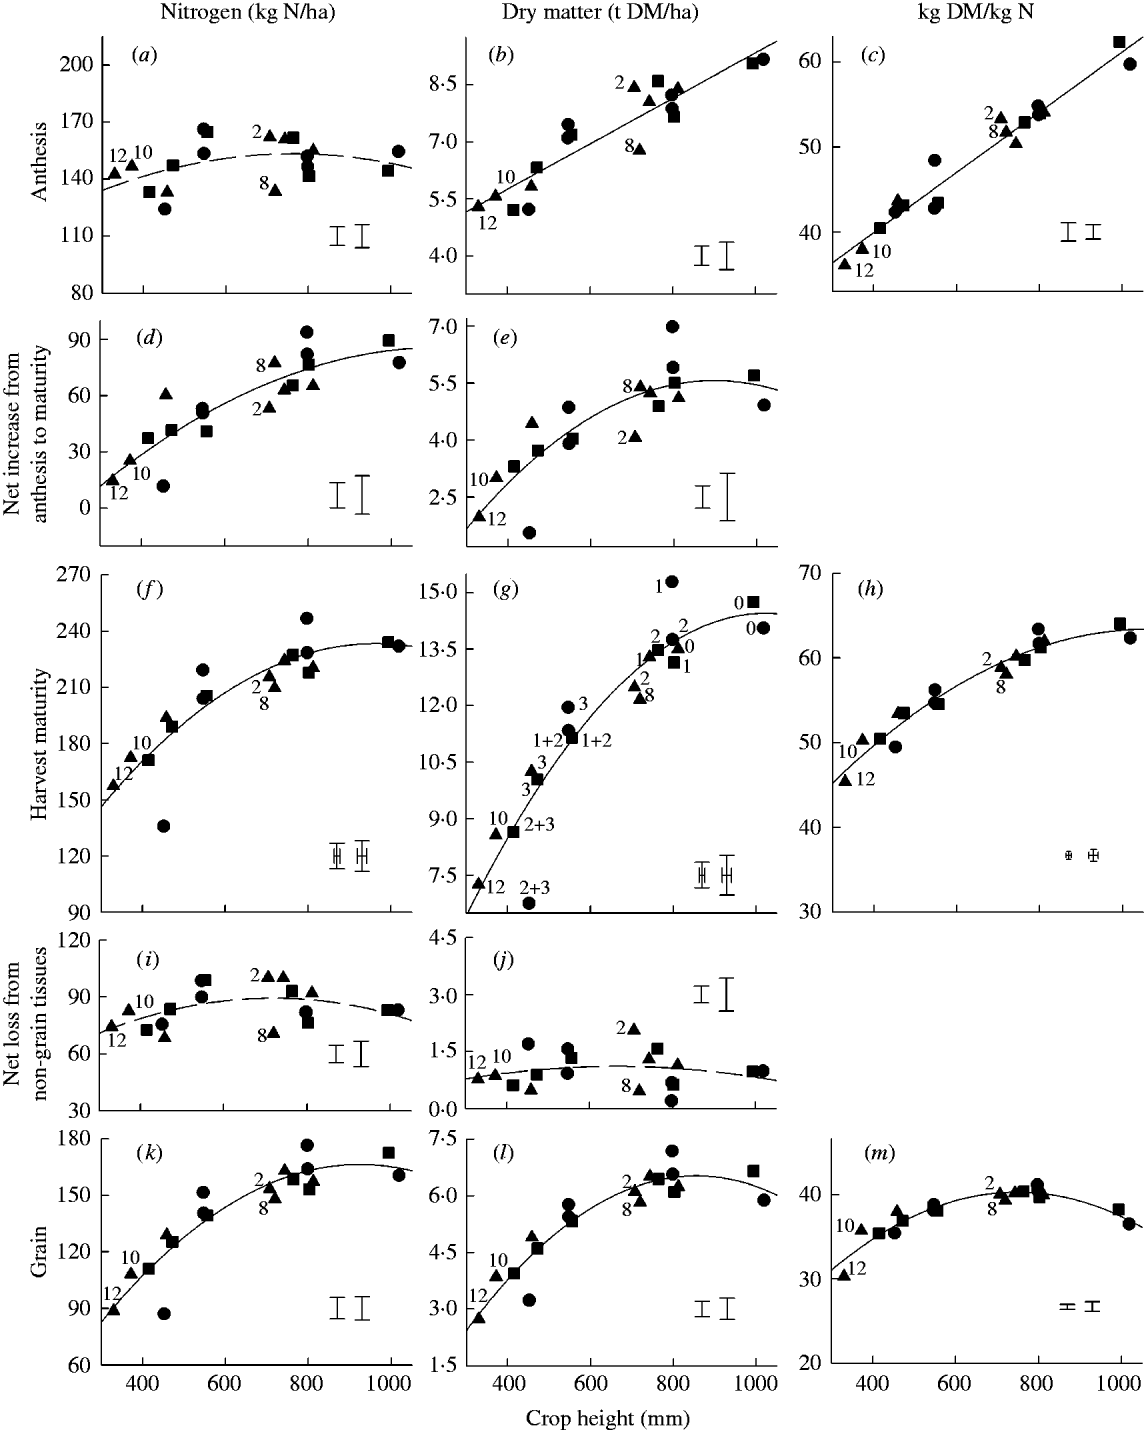
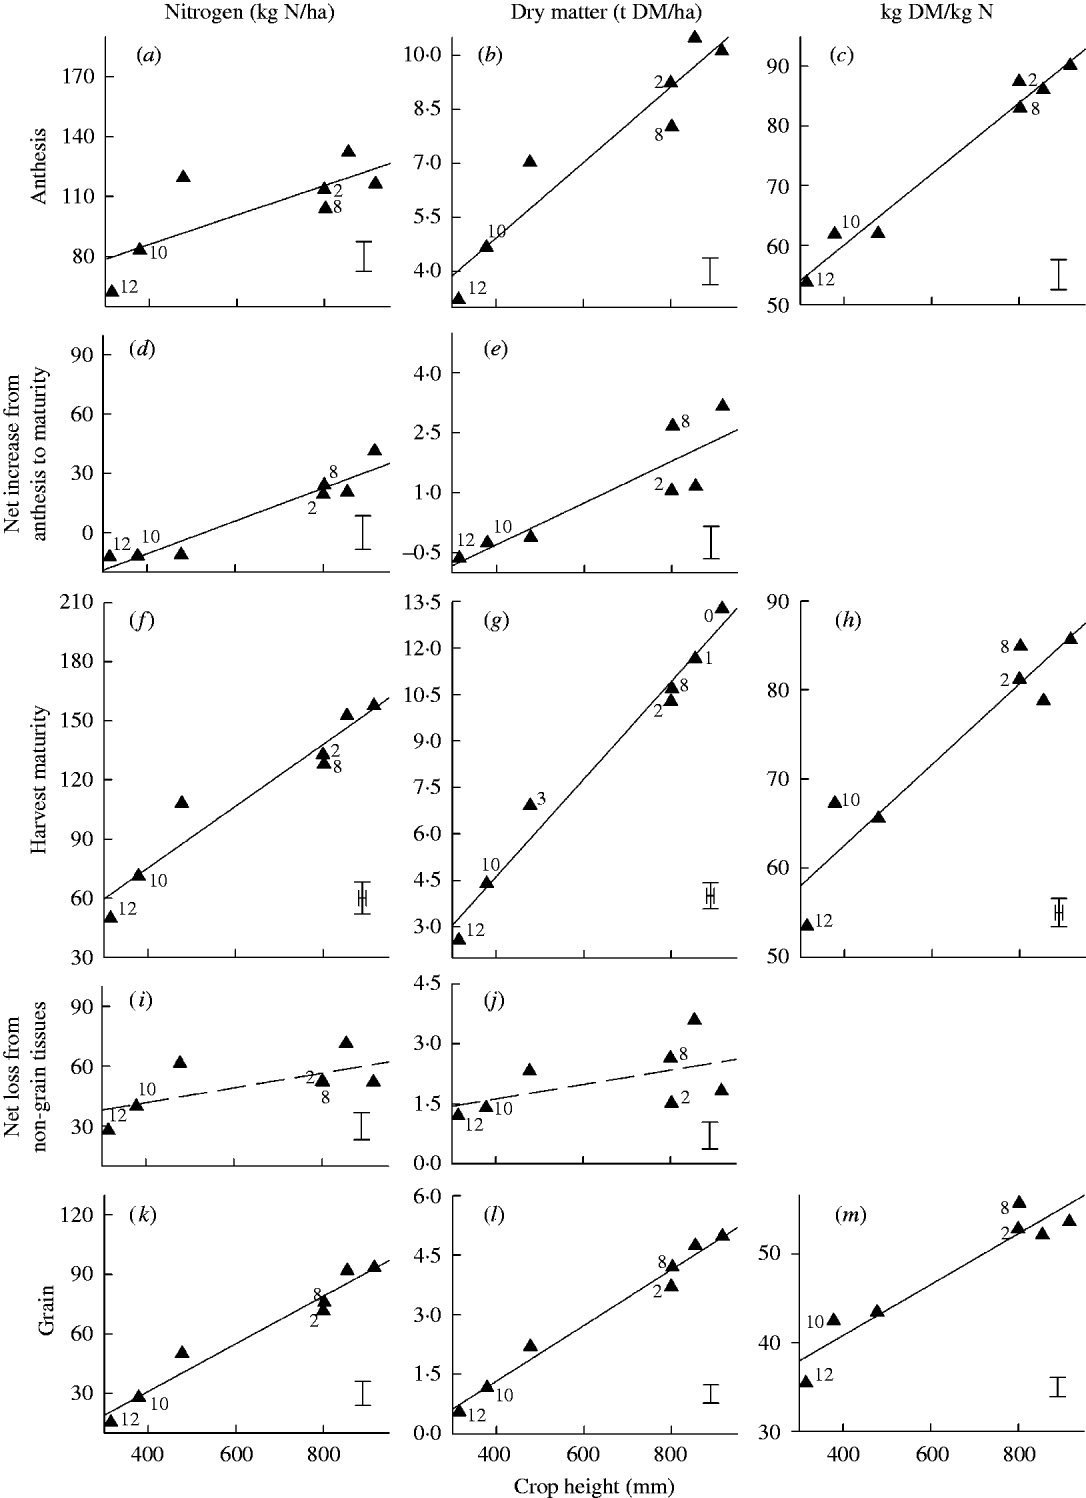
The relationships of crop height of conventionally grown NILs differing in dwarfing alleles in cultivar backgrounds of winter wheat cvars Mercia (triangles, mean of 2006, 2007 and 2009), Maris Huntsman (squares, 2009), and Maris Widgeon (circles, 2009), with N, DM and DM: nitrogen ratio (NUtE) in: the above-ground crop biomass at anthesis (a–c) and maturity (f–h); and the grain at maturity (k–m). (d) and (e) show the net increase in the above-ground crop biomass, and i and j show the net loss from the non-grain tissues, between anthesis and maturity. Numerals 0, 1, 2, 3, 8, 10 and 12 in g correspond to alleles as described in Fig. 2. Alleles in other graphs can be deduced as height is consistent, although 2, 8, 10, 12, are always labelled to compare gibberellin-insensitive (2, 10) and -sensitive (8, 12) alleles at similar heights. Main effects of background have been removed; see text for details. Fitted curves are quadratic (dashed and solid lines correspond to P>0·05 and P<0·05 for the regression respectively). Error bars are single s.e.d.s (78 d.f.) for comparing alleles within Mercia (left) or within the other backgrounds (right).

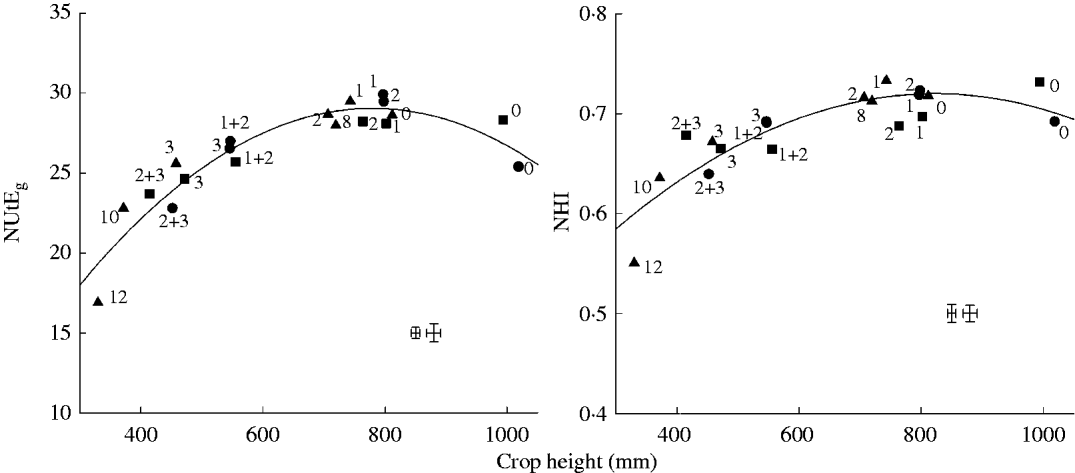
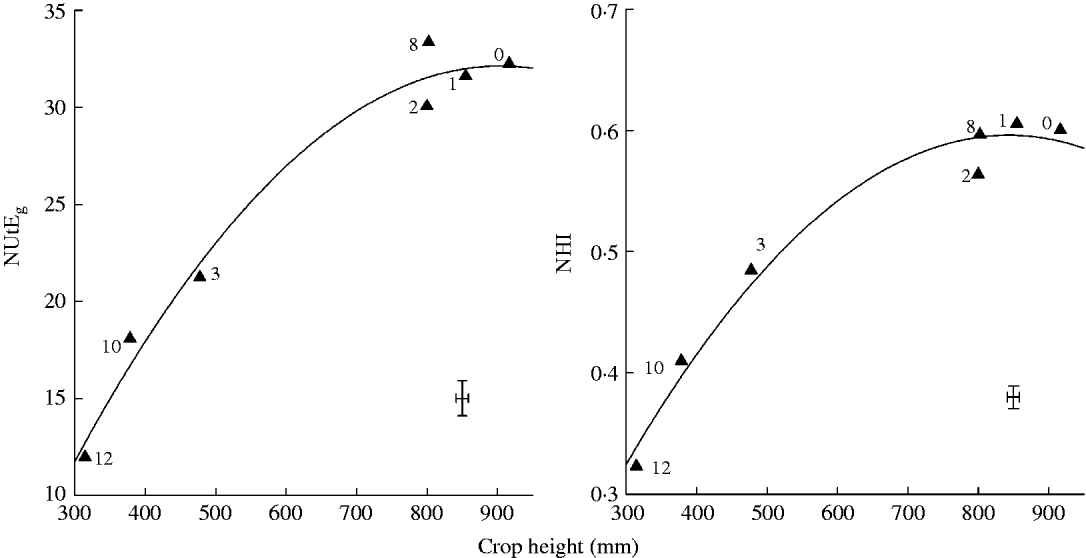
The relationship of crop height of conventionally grown NILs differing in dwarfing alleles in cultivar backgrounds of winter wheat cvars Mercia (triangles, mean of 2006, 2007 and 2009), Maris Huntsman (squares, 2009), and Maris Widgeon (circles, 2009), with NUtEg (kg grain DM/kg N in above-ground crop biomass), and NHI (kg N in grain/kg N in above-ground crop biomass). Numerals 0, 1, 2, 3, 8, 10 and 12 correspond to alleles as described in Fig. 2. Main effects of background have been removed; see text for details. Fitted curves are quadratic (P<0·05). Error bars are s.e.d.s (78 d.f.) for comparing alleles within Mercia (left) or within the other backgrounds (right).

The relationships of crop height of organically grown NILs differing in dwarfing alleles in a winter wheat cvar Mercia background (mean of 2006, 2007), with N, DM and DM: nitrogen ratio (NUtE) in: the above-ground crop biomass at anthesis (a–c) and maturity (f–h); and the grain at maturity (k–m). d and e show the net increase in the above-ground crop biomass, and i and j show the net loss from the non-grain tissues, between anthesis and maturity. Numerals 0, 1, 2, 3, 8, 10 and 12 in g correspond to alleles as described in Fig. 2. Alleles in other graphs can be deduced as height is consistent, although 2, 8, 10, 12, are always labelled to compare gibberellin-insensitive (2, 10) and -sensitive (8, 12) alleles at similar heights. Dashed and solid lines correspond to P>0·05 and P<0·05 for the linear regression, respectively. Error bars are single s.e.d.s (42 d.f.).

The relationship of crop height of organically grown NILs differing in dwarfing alleles in a winter wheat cvar Mercia background (mean of 2006, 2007), with NUtEg (kg grain DM/kg N in above-ground crop biomass), and NHI (kg N in grain/kg N in above-ground crop biomass). Numerals 0, 1, 2, 3, 8, 10 and 12 correspond to alleles as described in Fig. 2. Fitted lines are quadratic. Error bars are single s.e.d.s (42 d.f.).

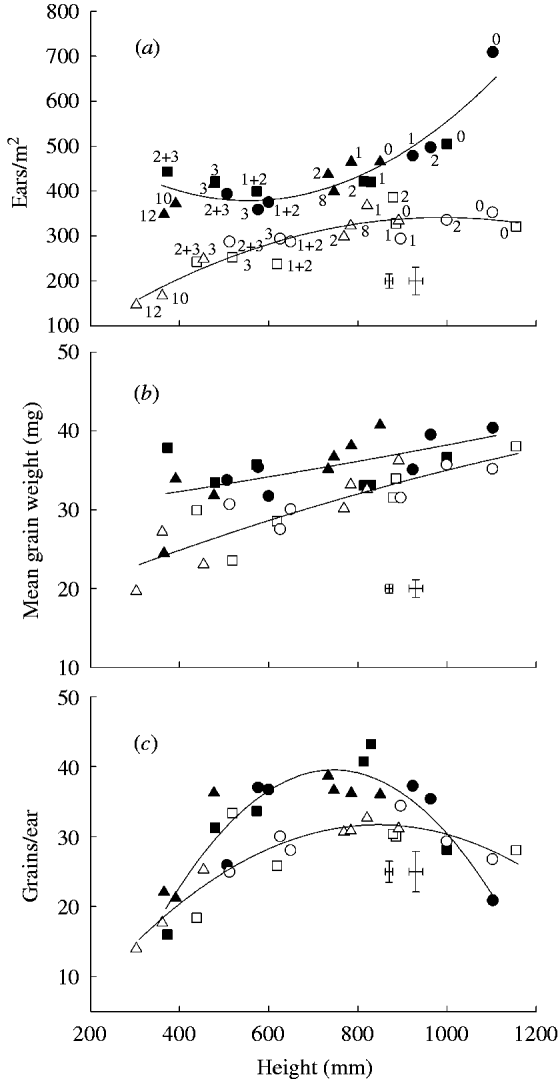
Despite very few degrees of freedom (2) errors for testing the effect of system on peak height for optimizing NUE for combine-harvested grain, the influence was nonetheless significant (P<0·05; s.e.d.=19·9 mm); the peak height was fitted to be 150 mm lower in the conventional system (Fig. 3) than in the organic system (Fig. 4). Main effects of system, allele and their interaction necessarily derive from effects on yield components. Higher grain yields in the conventional system resulted from greater numbers of ears/m2, mean grain weights, and for most genotypes, increased grains per ear (Fig. 9). The quadratic response of grain yield and NUE to height was largely a reflection of effects on grain numbers per ear (Fig. 9c), as was the increased optimal height for NUE in the organic system compared with the conventional system. The supra-optimal height of Maris Widgeon and Maris Huntsman rht (tall) were particularly associated with low grain numbers per ear, whereas there seemed no penalty for height with regards to ear population (Fig. 9a) nor mean grain weight (Fig. 9b), with generally positive associations observed over the range of heights achieved. In Mercia, Rht-D1b was associated with reduced mean grain weight in both systems (Fig. 9b), but this was only compensated by apparently increased grain numbers per ear in the conventional system.
The relationship of crop height of NILs differing in dwarfing alleles in cultivar backgrounds of winter wheat cvars Mercia (triangles, mean of 2006, 2007 and 2008), Maris Huntsman (squares, 2008), and Maris Widgeon (circles, 2008), with yield components when grown conventionally (solid symbols) or organically (open symbols). Numerals 0, 1, 2, 3, 8, 10 and 12 in a correspond to alleles as described in Fig. 2. Alleles in other graphs can be deduced as height is consistent. Main effects of background have been removed; see text for details. Fitted curves are quadratic. Error bars are single s.e.d.s (168 d.f.) for comparing alleles within growing systems in Mercia (left) or in the other backgrounds (right).

Nitrogen economy in the conventional experiments
Nitrogen recovery in the above-ground crop (NUpE)
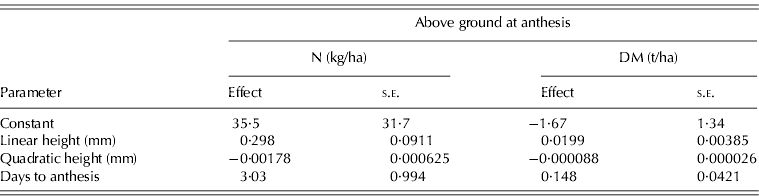
In contrast to effects on NUE, N accumulation in the above-ground crop by anthesis (Crop NYanthesis) was not closely related to height (Fig. 5a). The shortest lines, i.e. the GA-sensitive Rht12 and the GA-insensitive Rht-D1c (labelled 10 in Fig. 5a), had comparable Crop NYanthesis to much taller lines, and to each other. The photoperiod insensitive Rht8c+Ppd-D1a combination (8 in Fig. 5a) in Mercia accumulated less Crop NYanthesis than the photoperiod sensitive Rht-D1b (2 in Fig. 5a), despite being of similar stature. Allele effects on stature were confounded with their effects on rate of development, i.e. dwarfing was associated with delayed anthesis (Fig. 2), whether achieved with GA insensitivity (e.g. Rht-D1c) or not (Rht12). Ppd-D1a with Rht8c was associated with earlier anthesis; by more than 8 days compared to lines of similar stature but with greater photoperiod sensitivity. Multiple regressions (Table 3) suggested that 3 kg N/ha was accumulated for every day that anthesis was delayed. After accounting for this effect, a quadratic response of Crop NYanthesis to height could be discerned: the estimated effects of height (Table 3) implying a peak of 160 kg N/ha at 840 mm, declining to 109 kg N/ha at 300 mm and to 152 kg N/ha at 1050 mm. Whether accounting for anthesis date or not, there was no evidence that adding either of the Norin 10 alleles (Rht-B1b, Rht-D1b) to the tallest backgrounds (Maris Huntsman and M. Widgeon) reduced Crop NYanthesis.

LNUp between anthesis and maturity was reduced substantially by severe dwarfism (Fig. 5d), only amounting to about 15 kg N/ha for the shortest, and latest flowering line, Mercia Rht12, and for Maris Widgeon Rht-D1b+Rht-B1c (2+3). Semi-dwarfed and rht (tall) lines, however, achieved LNUp averaging 75 kg N/ha. The GA-sensitive Rht8c+Ppd-D1a, having accumulated less Crop NYanthesis associated with its earlier flowering, compensated with higher LNUp, such that Crop NYmaturity was broadly equivalent to that of Mercia Rht-D1b, a line of similar height (Fig. 5f), but achieved with GA-insensitivity. The fitted response in Fig. 5f peaks with a Crop NYmaturity of 233 kg N/ha, equating to a NUpE of 0·84. There was, however, no statistical evidence that adding single semi-dwarfing alleles to tall backgrounds affected Crop NYmaturity. Using the quadratic fits in Figs 5d, f, the penalty for reducing crop height from 800 to 300 mm on Crop NYmaturity, and thereby also delaying anthesis by 9 days, was about 80 kg N/ha, with 60 kg N/ha of this being accounted for by reduced LNUp. At 800 mm, 0·67 of Crop NYmaturity had been accumulated by anthesis.
Nitrogen recovery in the grain (Grain NY)
Nitrogen recovered in the combine-harvested grain peaked at c. 800 mm: the maximum fitted value of 160 kg N/ha representing 0·58 of available N (Fig. 3). A similar response was seen in the hand harvests but with less apparent penalty for excessive height (Fig. 5k). Remobeff and NHI peaked at 0·58 (not presented) and 0·72 (Fig. 6), respectively. Despite the quadratic fits, there was no statistically significant increase in Grain NY, Remobeff, or NHI by adding single semi-dwarfing alleles to the two tallest backgrounds in either combine- or hand-harvested grain. The Grain NY of the GA-sensitive dwarfing alleles (Rht12, Rht8c+Ppd-D1a) was similar to those of GA-insensitive alleles conferring similar heights (Figs 3 and 5k). The hand harvest (Fig. 5) revealed that effects of alleles on Grain NY could be attributed more to LNUp than to RemobN: using the quadratic fits, there was an 80 kg N/ha increase in Grain NY as heights increased from 300 to 800 mm; 62 kg of this derived from increased LNUp, and only 18 kg from increased RemobN. Of the 18 kg attributed to RemobN, 11 kg could be ascribed to effects on Crop NYanthesis (using a mid-point Remobeff of 0·55) and 7 kg to improved Remobeff. Similarly, the allele effects on Grain NY are more a function of Crop NYmaturity (Fig. 5f) than NHI (Fig. 6): c. 67% of the increase in Grain NY between 300 and 800 mm can be ascribed increased Crop NYmaturity and the remainder to improved NHI. Entire quadratic response of Grain NY to height is associated with effects on grain numbers rather than on N per grain (NpG). Indeed, NpG for Maris Huntsman NILs increased at heights either sub- or supra-optimal for Grain NY (Fig. 3), i.e. for just this background both the linear (−0·0043 mg/mm; s.e.=0·00128) and quadratic (0·000030; s.e.=0·0000094) effects of height were significant (P<0·05) with signs opposite to those for Grain NY.
NUtE
Effects of alleles on DM accumulation by anthesis (Crop DMYanthesis; Fig. 5b) contrasted with their effects on Crop NYanthesis. There was a positive linear association between Crop DMYanthesis and height, even as heights exceeded 1 m. When accounting for anthesis date on Crop DMYanthesis (c. 0·15 t DM/ha/d) deviation from linearity was significant (Table 3) but the predicted response to height still failed to reach a peak over the observed range: the linear and quadratic terms for height (Table 3), implying a Crop DMYanthesis of 3·5 t/ha at 300 mm, 8·6 t/ha at 800 mm, and 9·5 t/ha at 1050 mm. Therefore, there is an indication that adding any dwarfing alleles, even single semi-dwarfing alleles to tall backgrounds, can reduce Crop DMYanthesis. This disproportionate effect of dwarfing alleles on Crop DMYanthesis compared with that on Crop NYanthesis produced a close negative relationship between height and crop NUtE at anthesis (Fig. 5c), such that there was a significant negative effect of adding single semi-dwarfing alleles to tall backgrounds on NUtE. This negative relationship was unaffected by the dwarfing mechanism (Fig. 5c).
Net accumulation of biomass between anthesis and maturity increased only as height increased to 800 mm (Fig. 5e). The response of Crop DMYmaturity to height was similarly curved (Fig. 5g), as was crop NUtE at maturity (Fig. 5h). Despite the curvature, crop NUtE at harvest was still significantly reduced by single semi-dwarfing alleles (Rht-B1b, Rht-D1b, Rht8c+Ppd-D1a) in Mercia and Maris Huntsman backgrounds, as well as in all the severely dwarfed lines (Fig. 5h). Again, the negative relationship between height and NUtE to produce biomass at maturity appeared unaffected by the mechanism of dwarfing.
Allele and height effects on N utilization efficiency to produce grain (NUtEg) did vary somewhat from their effects on NUtE to produce biomass. NUtEg (Fig. 6) and NUtE of the grain (Figs 3 and 5m) were optimized at c. 800 mm, whether achieved by adding single semi-dwarfing alleles to the tallest background, or with the shorter background, Mercia, without a major dwarfing gene. Heights associated with producing the highest Grain NY were, therefore, associated with the lowest protein concentrations in the grain (Fig. 3; minimum fitted back-transformed crude protein concentration=136 mg/g). Adding semi-dwarfing genes (Rht-B1b or Rht-D1b) to both the tallest backgrounds significantly increased NUtEg (Fig. 6) and/or NUtE of the grain (Figs 3 and 5m). Mercia Rht-D1b and Rht8c+Ppd-D1a produced equally high NUtEg despite varying in dwarfing mechanism and photoperiod sensitivity. The GA-sensitive Rht12 did have significantly poorer NUtEg (Fig. 6) and NUtE (Fig. 5m) of the grain than the shortest GA-insensitive line (Rht-D1c). Poor NUtEg (or NUtE of the grain) of tall lines and of Rht12 compared to effects on NUtE to produce biomass are necessarily a function of their negative effects on DMHI (Fig. 3).
NUE
The fitted maximum combine-harvested grain yield of 6·69 t DM/ha at 810 mm (Fig. 3), equalled NUE of 24·0 kg grain DM/kg of available N. As with NUtEg and NUtE of the grain, optimum height for NUE was approached by adding single semi-dwarfing alleles to excessively tall backgrounds, or by using a background that had appropriate stature without a major dwarfing allele. A similar response was seen in the hand harvests but with less apparent penalty for excessive height (Fig. 5l). For neither harvest method was there any evidence that dwarfing mechanism influenced the relationship between height and NUE. Differences among alleles and responses to height for Grain DMY, and hence NUE, can be attributed approximately equally between effects on Crop NYmaturity (Fig. 5f) and NUtEg (Fig. 6). Of the 4 t/ha reduction in Grain DMY associated with reducing height from 800 to 300 mm (Fig. 5l), 1·9 t/ha can be attributed to Crop NYmaturity (using a midpoint NUtEg of 23·5 kg DM/kg N) and 2·1 t/ha to NUtEg (using a midpoint Crop NYmaturity of 187 kg N/ha).
Nitrogen economy in the organic experiments
Nitrogen recovery in the above-ground crop (NUpE)
In contrast to the conventional experiments, time to anthesis did not have a significant effect on Crop NYanthesis. For example, the Rht8c+Ppd-D1a line accumulated similar quantities of N by this stage to that of Rht-D1b (Fig. 7a), despite the former flowering 9 days earlier (Fig. 2). Rht12 accumulated the least N, despite flowering last. In the organic experiments, there was a significant penalty for dwarfism, despite dwarfism usually extending the time to anthesis. LNUp was much less in the organic than in the conventional experiments, and again significantly reduced with dwarfism even to the extent that severe dwarfing alleles (Rht-B1c; Rht-D1c; Rht12) were associated with apparent loss of N from the above-ground crop after anthesis. Using the linear fits in Fig. 7, the 78 kg N/ha increase in Crop NYmaturity that occurred between 300 and 800 mm is the sum of 37 kg N/ha from increased Crop NYanthesis and 41 kg N/ha from increased LNUp. At 800 mm, 0·84 of Crop NYmaturity had been accumulated by anthesis. The poorer crop N recoveries in the dwarfed lines were associated with greater quantities being recovered in the above-ground weed biomass (Fig. 10).
The relationship of crop height of organically grown NILs differing in dwarfing alleles in a winter wheat cvar Mercia background (mean of 2006, 2007 and samples taken at both anthesis and maturity of the wheat) with N (kg/ha) in the above-ground weed biomass in organically grown plots. Numerals 0, 1, 2, 3, 8, 10 and 12 correspond to alleles as described in Fig. 2. Error bar is one s.e.d. (42 d.f.)

Nitrogen recovery in the grain (Grain NY)
In the organic experiments, fitted Grain NY from the combine harvest peaked at 900 mm with 60·2 kg N/ha or 0·35 of available N (Fig. 4). Net loss from non-grain tissues between anthesis and maturity (RemobN; Fig. 7i) was not closely associated with crop height, i.e. positive relationships between crop height and Grain NY (Fig. 7k) largely reflected effects on Crop NYanthesis and LNUp. Using the linear fits in Fig. 7, the increasing height from 300 to 800 mm was associated with an increase in Grain NY of 60 kg N/ha; 41·5 kg N/ha deriving from LNUp and 18·5 kg N/ha from RemobN. Of the RemobN, 17·8 kg N/ha can be accounted for by effects on Crop NYanthesis with an average Remobeff of 0·48. Empirically, 0·57 of the increase in Grain NY between crop heights of 300 and 800 mm can be ascribed to Crop NYmaturity (using a mid-point NHI of 0·45) and the remainder to improved NHI (Fig. 8). As with the conventional experiments Grain NY effects were unrelated to effects on NpG hence, Grain NY was mostly a function of grain population.
NUtE
As in the conventional experiment, dwarfing alleles had greater effects on DM accumulation by anthesis (Fig. 7b) than on N accumulation such that NUtE at anthesis was significantly reduced by dwarfism (Fig. 7c). It is notable that DM yields at anthesis of the taller Mercia lines were greater in the organic experiments than in the conventional experiments (Fig. 7b v. Fig. 5b), despite N yields being greater in the latter (Fig. 7a v. Fig. 5a). Reduced N uptake, but greater DM production, was therefore associated with much higher NUtE at anthesis (c. 90 kg DM/kg N for the Mercia rht line; Fig. 7c) in comparison with that in the conventional experiments (around 55 kg DM/kg N for the Mercia rht line; Fig. 5c).
As for N, severe dwarfism in the organic experiments was associated with apparent loss of biomass between anthesis and maturity (Fig. 7c). The negative effect of dwarfing genes on DM accumulation both before and after anthesis produced a close negative relationship between height and Crop DMYmaturity (Fig. 7g) such that even some of the semi-dwarfing alleles (Rht-D1b; Rht8c+Ppd-D1a) in Mercia were associated with statistically significant reductions in biomass production. Again, allele effects on biomass production were greater than on N accumulation such that there was a negative effect of dwarfism on NUtE of the crop at maturity (Fig. 7h). Rht12 had significantly lower crop NUtE at maturity compared with Rht-D1c. Effects of dwarfing alleles in Mercia on Grain DMY (Fig. 7l) and NUtE of the grain (Fig. 7m) were similar to their effects on Crop DMY and NUtE.
NUE
The fitted maximum combine-harvested yield for the organically grown NILs was 3·38 t/DM/ha at 960 mm representing NUE of 19·5 kg grain DM/kg available N. Although the fitted optimum height for NUE was apparently taller for the organic crops compared with the conventional crops (Fig. 3 v. Fig. 4), and the penalty for excessive height less severe (and not statistically significant, P>0·05), fitted peak yields were still achieved by adding dwarfing genes to the tallest backgrounds (Maris Huntsman and Maris Widgeon) or by omitting major dwarfing genes from the apparently suitably statured background (Mercia). Also in common with the conventional experiments, GA-sensitive alleles produced similar NUE to the GA-insensitive alleles of similar height. Grain NUtE (Grain DMY/Grain NY) appeared to have a more influential effect on NUE in the organic, compared with the conventional experiments, with much higher values being achieved in the higher yielding lines, and no penalty for the heights of rht (tall) M. Widgeon and M. Huntsman being observed (Fig. 4). From the hand harvests, the empirical contributions of Crop NYmaturity and NUtEg (Fig. 8) to the Grain DMY yield increase of 3·5 t DM/ha between 300 and 800 mm, were approximately equal (0·46 attributed to Crop NYmaturity using the average NUtEg of 22 kg DM/kg N).
DISCUSSION
The fitted maximum combine-harvested grain yields, equating to 7·9 and 4·0 t/ha (expressed at 850 g DM/kg FW) for conventional and organic systems, respectively, are consistent with average commercial yields in the UK (FAOSTAT average for UK 2006–08=7·8 t/ha; Lampkin et al. (Reference Lampkin, Measures and Padel2006) estimate 4·5 t/ha for UK organic). In the conventional area the soil N availability+fertilizer N quantity of 78+200 kg N/ha were close to UK estimates of 80+187 kg N/ha (Sylvester-Bradley & Kindred Reference Sylvester-Bradley and Kindred2009). The peak NUE, NHI and NUtEg were also close to the calculated averages for UK milling wheat of 22, 0·75 and 33 kg DM/kg N, respectively (Sylvester-Bradley & Kindred Reference Sylvester-Bradley and Kindred2009), and well within the ranges found previously for wheat grown at this site with similar husbandry (Kindred & Gooding Reference Kindred and Gooding2004). There is less comparative data for organic wheat. The approach used in the present study to estimate available N (Crop NY+Weed NY), although comparable to the approach for the conventional wheat (Crop NY at zero N fertilizer), is open to criticism. Clearly, more soil mineral N is potentially available in the organic system, and a significant amount of this would be at risk of loss. Baresel et al. (Reference Baresel, Zimmermann and Reents2008) estimated total mineralized N under German organic winter wheat following 3-year fertility building phases to average c. 175 kg N/ha, similar to the value used in the present study for available N. However, the German work also calculates 40 kg N/ha to be lost during winter and it is quite possible that the value in the present work underestimates total N availability by a similar quantity. Nonetheless, peak Grain NY in the organic wheat presented here is 15–20 kg N/ha less than average values reported by Baresel et al. (Reference Baresel, Zimmermann and Reents2008). The peak values of NUE and NUtEg of 20, and 32 kg DM/kg N for organic wheat presented here are also lower (24 and 42 in the German work, respectively). The performance of wheat in the organic system in the present work was compromised by the weeds, with 0·15 of available N being recovered in weeds growing in the plots of Mercia (tall), the most competitive Mercia line. It is possible that NUE would have improved if post-establishment weed control measures, such as finger-tine hoeing had been employed, or if crop seed rates had been increased to improve competitive ability, but neither method necessarily increases Grain NY or NUtE of the grain in organic systems (Samuel & East Reference Samuel and East1990).
The comparison between organic and conventional results would support previous suggestions that the capture of resources made available during early crop-GSs is more important in systems mostly reliant on soil N from previous biological fixation, compared with systems reliant on high synthetic fertilizer inputs timed to periods of peak crop demand (Baresel et al. Reference Baresel, Zimmermann and Reents2008; Dawson et al. Reference Dawson, Huggins and Jones2008; Wolfe et al. Reference Wolfe, Baresel, Desclaux, Goldringer, Hoad, Kovacs, Loschenberger, Miedaner, Ostergard and van Bueren2008). In the organic experiments this would explain the lack of an effect of allele anthesis date on Crop NYanthesis, the reduced contribution of LNUp to genotypic effects on CropNmaturity and over 0·80 of CropNmaturity of higher-yielding lines being accumulated apparently by anthesis. The value of 0·80 is consistent with other field experiments with low levels of synthetic fertilizer (Kindred & Gooding Reference Kindred and Gooding2004), and broadly with other organic experiments (Baresel et al. Reference Baresel, Zimmermann and Reents2008). In the present organic experiments, the poor performance of the severe dwarfs would have been exaggerated by their reduced competitiveness with weeds (Gooding et al. Reference Gooding, Cosser, Thompson, Davies, Froud-Williams, Isart and Llerena1997), again emphasizing the need for early resource capture by the crop in such systems (Lemerle et al. Reference Lemerle, Verbeek, Cousens and Coombes1996). The present authors concur with others that organic systems can provide sufficient N for wheat, but suggest that there needs to be better matching of the timing of N availability with that of crop demand (Baresel et al. Reference Baresel, Zimmermann and Reents2008).
The present work demonstrates that Rht effects on Crop NYanthesis are confounded with their effects on the date of anthesis. It also confirms the delay in maturity associated with Rht12 (Worland et al. Reference Worland, Sayers and Borner1994), Rht-B1b (Giunta et al. Reference Giunta, Motzo and Pruneddu2007) and Rht-D1b (Addisu et al. Reference Addisu, Snape, Simmonds and Gooding2009), but further illustrates a more general association between late flowering and degree of dwarfism. Gibberellin sensitivity may affect the date of flowering through numerous mechanisms (Mutasa-Göttgens & Hedden Reference Mutasa-Göttgens and Hedden2009), and genetically or chemically induced GA deficiency has delayed anthesis in wheat (Appleford et al. Reference Appleford, Wilkinson, Ma, Evans, Stone, Pearce, Powers, Thomas, Jones, Phillips, Hedden and Lenton2007). The observation that both GA-sensitive and GA-insensitive alleles can delay anthesis possibly suggests an indirect mechanism mediated through dwarfism per se rather than a direct GA-signalling effect. The exception to this relationship is clearly the effect of Ppd-D1a to reduce plant height and bring forward anthesis by c. 8 days through photoperiod insensitivity (Worland Reference Worland1996; Beales et al. Reference Beales, Turner, Griffiths, Snape and Laurie2007).
The estimated rate of accumulation of 3 kg N/ha/d around anthesis in the conventional experiments is consistent with previous studies on Mercia in the UK receiving c. 200 kg N/ha as fertilizer (Sylvester-Bradley & Stokes Reference Sylvester-Bradley and Stokes2001). In this comparatively N-rich situation, and even accounting for time to anthesis, no evidence was found that single semi-dwarfing alleles (Rht-B1b; Rht-D1b) limit pre-anthesis uptake. Even with Ppd-D1a, reduced N uptake pre-anthesis of the Rht8c line is compensated for by increased accumulation post-anthesis, and no evidence has been found that mode of dwarfism influences Crop NYmaturity, i.e. effect of alleles are related to their effects on height rather than additional effects of GA sensitivity.
The present results are broadly consistent with Gale & Youssefian (Reference Gale, Youssefian and Russell1985) showing severe dwarfism, such as they report for Rht-B1c, can be associated with reduced Grain NY. The present paper demonstrates that this negative effect is mostly due to effects on LNUp rather than RemobN in contrasting production systems independent of the mechanism of dwarfing. The reasons for curtailed LNUp require further study, particularly as dwarfing was not a significant impairment to pre-anthesis uptake in the conventional system. Delayed anthesis may have reduced the time for effective uptake if all lines matured into a terminal drought. However, even if it is assumed that all lines completed LNUp at the same time, and a maximum uptake of 3 kg N/ha/d was maintained until that time, delayed anthesis would only account for about half of the reduction in LNUp observed as crop heights declined below 800 mm. Further, N can be lost from the crop between anthesis and maturity (Addisu Reference Addisu2009), which leads to an underestimate of the contributions of N uptake to Grain NY and a corresponding over-estimate of the RemobN contribution. Rooting may be impaired in the severe dwarf lines (Wojciechowski et al. Reference Wojciechowski, Gooding, Ramsay and Gregory2009) which could become more important as water and soluble N become depleted late in the season. Finally, the observation that Grain NY is a function of grain numbers rather than NpG (Le Gouis et al. Reference Le Gouis, Beghin, Heumez and Pluchard2000) may infer a degree of sink limitation on LNUp (Mi et al. Reference Mi, Tang, Zhang and Zhang2000). NpG in the conventional experiments approached 1 mg N/grain, a level at which uptake efficiency with increased N availability can decline rapidly (Gooding Reference Gooding2005; Gooding et al. Reference Gooding, Gregory, Ford and Ruske2007). Other explanations for the conservatism in NpG over a range of Crop NY are, however, possible (Gooding et al. Reference Gooding, Gregory, Ford and Ruske2007) and it is notable that NpG did not contribute greatly to genotypic effects on Grain NY in the organic system despite NpG being significantly less than 1 mg N/grain. In a comparison of genotypes of different vintage, Acreche & Slafer (Reference Acreche and Slafer2009) found more modern varieties to have reduced NpG associated with increased grain numbers compared with their predecessors. In the results presented here, however, NpG remained comparatively stable over a wide range of grain populations generated by the range of dwarfing alleles.
As with Gooding et al. (Reference Gooding, Cosser, Thompson, Davies, Froud-Williams, Isart and Llerena1997) and Gale & Youssefian (Reference Gale, Youssefian and Russell1985), no evidence was found in the present study that semi-dwarfing, either with GA insensitivity or not, reduced Grain NY. The present authors concur with Le Gouis et al. (Reference Le Gouis, Beghin, Heumez and Pluchard2000) that most genotypic variations in Grain NY are closely related to variations in Grain DMY. Grain NY and Grain DMY are thus maximized broadly at the same heights.
The penalty for biomass yield of dwarfism in cereals is reiterated, and show clear implications for NUtE of the above-ground crop biomass. As with Fernandez et al. (Reference Fernandez, Becraft, Yin and Lubberstedt2009), the present authors would therefore question the value of any Rht alleles to meet possible increased demand for lignocellulosic biomass for the production of biofuel. Although single semi-dwarfing alleles often reduced NUtE of the crop, that they could increase NUtE of the grain or NUtEg when added to tall backgrounds emphasizes the importance of DMHI for these characters (Ortiz-Monasterio et al. Reference Ortiz-Monasterio, Sayre, Rajaram and Mcmahon1997).
The effects of Rht alleles on the NUtE of the grain are broadly consistent with the frequently observed negative relationships between genetic effects on Grain DMY and protein concentration (Zheng et al. Reference Zheng, Le Gouis, Daniel and Brancourt-Hulmel2009). There is, therefore, conflict between wheat systems and genotypes targeted for bread-making and hence high grain-protein concentrations and those for NUtE, i.e. the inverse of N concentration (Barraclough et al. Reference Barraclough, Howarth, Jones, Lopez-Bellido, Parmar, Shepherd and Hawkesford2010). Foulkes et al. (Reference Foulkes, Sylvester-Bradley and Scott1998) label the inverse of grain N concentration as ‘crop nitrogen productivity’ (rather than as ‘NUtE of the grain’ as used herein), presumably as a more readily available potential indicator of NUtEg. The present results demonstrate the close association between genotype effects on the inverse of grain N concentration and NUtEg.
It would appear that dwarfing alleles, GA insensitive or not, would have little to contribute to increased protein concentration at high yields, other than to permit greater fertilizer N applications without excessively increasing the risk of lodging. Comparisons of commercially released varieties that vary in vintage so as to span the introduction of the cvar Norin 10 dwarfing alleles have found that the more modern, shorter varieties accumulate the same or more Crop NY and have greater Grain NY, NHI, Remobeff, NUtEg, NUtE of the grain and DMHI (Austin et al. Reference Austin, Ford, Edrich and Blackwell1977; Slafer & Andrade Reference Slafer and Andrade1989; Slafer et al. Reference Slafer, Andrade and Feingold1990; Ortiz-Monasterio et al. Reference Ortiz-Monasterio, Sayre, Rajaram and Mcmahon1997; Barraclough et al. Reference Barraclough, Howarth, Jones, Lopez-Bellido, Parmar, Shepherd and Hawkesford2010). The results presented, together with those presented previously (Gale & Youssefian Reference Gale, Youssefian and Russell1985; Gooding et al. Reference Gooding, Cosser, Thompson, Davies, Froud-Williams, Isart and Llerena1997), demonstrate that much of these effects can be attributed to the individual dwarfing alleles incorporated. However, these benefits are only seen in comparatively tall backgrounds (represented by Maris Widgeon and Maris Huntsman here), and there appears to be no benefit for reducing plant height below 800 mm with respect to any component of NUE, irrespective of the dwarfing mechanism or cropping system employed. It is notable that even the semi-dwarfing allele, Rht-D1b could sometimes reduce grain yield and NUE when added to a comparatively short background such as Mercia, a cultivar that was at least as short as many of its successors carrying semi-dwarfing alleles such as cvar Xi19 and cvar Solstice. Given the success of these latter cultivars, and the results presented here, there would appear little potential benefit in reducing cultivar height below 800 mm. The present paper does, however, demonstrate that optimum height to maximize NUE and its components, as manipulated by Rht alleles, varies with cropping system and crop utilization (i.e. grain or biomass).
The authors are grateful to the Felix Trust for providing a scholarship for M. Addisu, and to R. J. Casebow, R. E. Kiff and D. T. Smith for technical support.