Dietary assessment is essential for evaluating nutritional status. Although several methodologies, including FFQ, 24-h recalls (24hr), dietary history and dietary diaries are widely used, these methods remain prone to substantial measurement error, particularly due to memory, perception and conceptualisation biases inherent to self-reported dietary data(Reference Nelson, Atkinson and Darbyshire1). Efforts to reduce these errors through multi-step methodologies and technology-assisted tools have improved dietary evaluations; however, important limitations persist(Reference Blanton, Moshfegh and Baer2–Reference Nichelle, Almeida and Camey5), particularly when standardised tools fail to capture the geographical and cultural context of non-Western populations.
Systems such as the Automated Self-Administered 24-Hour Dietary Assessment Tool (ASA24) have increased the feasibility and standardisation of dietary data collection in large-scale studies(6). Yet these instruments rely on food composition databases and portion size references largely derived from US dietary patterns and food terminology, which may not adequately reflect the dietary practices of other populations(Reference Raffoul, Hobin and Sacco7–Reference Previdelli, Gómez and Kovalskys9). This lack of contextual adaptation can introduce systematic errors in dietary intake estimation, compromising the applicability of these tools in regions such as Latin America. This gap highlights the need for locally contextualised databases incorporating regional foods and culturally relevant portion size references.
Considering these challenges, we developed a database enriched with local foods and international measurement units (DbF) and hypothesised that a photograph-assisted 24hr analysed using this contextualised database would demonstrate superior accuracy compared with the standard ASA24 system when evaluated against weighed food records and recovery biomarkers. In the present study, twenty Colombian volunteers photographed and weighed all foods consumed over two non-consecutive days, followed by 24hr interviews conducted by a trained dietitian based on the photographs. Dietary intake estimates generated using either ASA24 or DbF were then compared against weighed food records and biomarkers quantified in blood and urine. The results suggest that integrating technology-assisted recalls with regionally adapted food databases improves the accuracy of dietary assessment in non-Western populations.
Methods
Study design and subjects
This study was conducted between October and November 2022 in Medellín, Colombia. A convenience sample of twenty adult men and women aged 28–64 years was recruited. Participants were required to own a smartphone with Internet access and be able to use it autonomously. They were instructed not to alter their dietary habits during the study period. Sex, age, weight and height were self-reported. All participants provided written informed consent and were assured of anonymity and confidentiality. The study adhered to the ethical principles outlined in the Declaration of Helsinki (2013 revision) and was classified as minimal risk according to Colombian regulations (Resolutions 008430/1993 and 2378/2008)(10,11) . The Institutional Committee on Ethics in Human Research of Universidad CES approved the study (act N°201 September/2022). It was registered at ClinicalTrials.gov (NCT05610137). The study was reported in accordance with the STROBE-nut (Strengthening the Reporting of Observational Studies in Epidemiology – nutritional epidemiology) guidelines(Reference Lachat, Hawwash and Ocké12).
Development of the Local Food Database (DbF)
Given the geographical and cultural incompatibility of international reference databases such as ASA24/Food and Nutrient Database for Dietary Studies (FNDDS) with the dietary practices of the Colombian population, we developed a customised DbF. The DbF was developed through a four-step process coordinated by a registered dietitian.
Core structure and computational framework
The DbF was developed in Microsoft Excel using automated lookup and conditional formulas to calculate energy and nutrient intake according to food items and portion sizes. The system allowed standardised linkage between food identification codes, serving sizes and nutrient composition data.
Integration of local food composition data
The database was initially based on the United States Department of Agriculture (USDA) FNDDS (2017–2018)(13) and was subsequently adapted using food composition data from official Colombian sources, including the Colombian Food Composition Table from the Instituto Colombiano de Bienestar Familiar (ICBF)(14) and the exchange lists developed by the Universidad de Antioquia(Reference Manjarrés, Gómez and Pérez15). All food items were standardised to express nutrient values per 100 g of edible portion.
Definition of portion sizes and standardised measurement units
Reference portion sizes were harmonised using grams, millilitres and common household measures. Portion definitions were derived from the Colombian Dietary Guidelines(16), the Universidad de Antioquia exchange lists(Reference Manjarrés, Gómez and Pérez15) and historical portion size data from the National Survey on Nutritional Status (ENSIN)(Reference Borda Villegas and Alvarez17). Correction factors for edible weight coefficients, refuse percentages and moisture/nutrient retention losses due to thermal processing were applied when relevant.
Standardisation of recipes and mixed dishes
Traditional Colombian mixed dishes and regional preparations were deconstructed into standardised recipes. Raw-to-cooked conversion factors and ingredient proportions were established using measurements from typical household and restaurant preparations through empirical measurement and weight-testing procedures. This process enabled more accurate disaggregation and nutrient profiling of complex multi-ingredient foods.
Dietary assessment
Two 24hr were conducted on non-consecutive days, one during the week and the other during the weekend, and were randomly distributed to capture habitual intake and minimise intra- and inter-individual variability. The recalls were supported by photographic records of all foods and beverages consumed, accompanied by brief descriptions. As a reference method, the participants weighed the food on digital kitchen scales provided by the research team.
Participants were trained to take standardised photographs. On each 24hr day, they captured four photographs at every eating occasion, regardless of meal type, quantity or location. Before consumption, participants took one photograph close to the food or beverage at a 45° angle and another from above (90° angle), ensuring that the entire dish or beverage was visible. Two similar photographs were requested after food consumption, including any leftovers. All photographs included a standard object of known size provided by the research team (a 6-cm-long ruler) (Supplementary Figure 1).
Participants also documented and described the foods consumed. They were trained in the correct use of the kitchen scale and were provided with a measuring container and standardised forms for food weighing. Throughout the study, a certified dietitian trained in the methodology provided continuous support to participants, including guidance on food matching, portion size estimation and identification of typical Colombian preparations. The dietitian received the photographs and descriptions through the WhatsApp messaging application and applied the multiple-pass method to estimate portion sizes and food weights. Participants reported recorded food weights to a second investigator after completion of the two 24hr, allowing assessment of estimation accuracy. Consumption of non-energetic supplements (e.g. vitamins and minerals) was self-reported and excluded from the dietary intake analysis.
Dietary intake data from the 24hr were analysed using ASA24 2020(6). Because ASA24 does not include many typical Colombian foods, local foods were matched to nutritionally equivalent options using Colombian food composition databases, including the exchange list developed by Universidad de Antioquia(Reference Manjarrés, Gómez and Pérez15), ICBF(14) and the Colombian Dietary Guidelines(16). Matched foods were selected based on the closest nutritional composition per 100 g based on FNDDS 2017–2018(13), which provided a broader range of food options to guide the data entry. When a food was unavailable in ASA24, a nutritionally similar option from the same food group was selected. Portion sizes commonly used in Colombia were also considered to improve representation within ASA24. To standardise the matching process, a logbook was created to document how Colombian foods were registered in ASA24 for proper nutritional analysis. The performance of the logbook was evaluated by comparing differences in energy, macronutrient and selected micronutrient between Colombian foods and their matched ASA24 counterparts. Before dietary intake was reported in ASA24, adjustments were made to food items, recipes, weights and household measurements to better reflect those commonly used in the Colombian population. Overall, 13 % of analysed food items required homologation to nutritionally comparable alternatives. Supplementary Table 1 summarises the principal homologated foods and their corresponding serving size equivalents.
The 24hr were also analysed with the expanded DbF database enriched with Colombian foods(14–Reference Borda Villegas and Alvarez17) and culturally relevant reference measurement units. Nutrient intake estimates obtained from ASA24 and DbF were further evaluated against the participants’ actual weighed food records. All dietary intake data from ASA24, DbF and weighed food records were entered into Personal Computer Software for Intake Distribution Estimation (PC-SIDE)(18) to adjust for inter-individual variability and estimate usual intake.
Food records showing nutritionally significant deviations – defined as differences of ≥200 kcal, 30 g protein, 80 g total fat, 100 g carbohydrates, 16 g fibre or 15 g sugar – were classified as major estimation errors. Each discrepancy was further evaluated by comparing estimated and actual food weights to better identify potential sources of error. Misreporting of energy intake was assessed according to Huang et al.(Reference Huang, Roberts and Howarth19), using a reference energy requirement of 2000 kcal/d (code available at https://github.com/Vidarium/Dietary-Intake-Assessment-ASA-DbF).
Physical activity
Physical activity assessment was included to estimate potential dietary misreporting. Each study participant was provided with a Xiaomi Mi Smart Band 5 smartwatch. Energy expenditure, including step count and calories burned, was monitored using the device on the same days that the 24hr were conducted. Participants were instructed to maintain their usual lifestyle and physical activity during the assessment period. The smart band synchronisation was discontinued once both 24hr assessments were completed. Physical activity levels were classified according to the criteria proposed by Hills et al. (2014): sedentary (<5000 steps/d), low activity (5000–7499 steps/d), somewhat active (7500–9999 steps/d), active (10 000–11 999 steps/d) and very active (≥12 000 steps/d)(Reference Hills, Mokhtar and Byrne20).
Biomarkers of intake
During each 24hr assessment, urine and blood samples were collected. Each participant provided a 24-h urine sample and a fasting blood sample the following day. Urinary urea N, Na and K concentrations were measured (Figure 1). Urea nitrogen was determined using the thermal conductivity method, and total protein intake (g) was estimated by applying the nitrogen-to-protein conversion factor (6·25). Urinary Na and K concentrations were measured by potentiometry.
Study design. 24hr, 24-h recall; ASA24, Automated Self-Administered 24-Hour Dietary Assessment Tool; DbF, database enriched with local foods and international measurement units.

Protein intake (PRT) was estimated from urinary urea N(Reference Okuda, Asakura and Sasaki21), based on the assumption that urea N represents 85 % of total N(Reference Bingham, Williams and Cole22), that 81 % of total N is excreted in urine and that N constitutes 16 % of protein(Reference Bingham and Cummings23). Dietary Na and K intake were estimated from 24-h urine and were calculated in mg/d using standard conversions: 1 mmol = 1 mEq, 1 mEq Na = 23 mg Na and 1 mEq K = 39 mg K. Urinary Na and K values were multiplied by 23 and 39, respectively, and adjusted using excretion factors of 0·86(Reference Freedman, Commins and Moler24) for Na and 0·80(Reference Freedman, Commins and Moler24,Reference Freedman, Midthune and Carroll25) for K.
Blood samples were analysed for key micronutrients, including plasma vitamin C, vitamin K1, vitamin B1, folic acid, serum zinc, plasma copper and carotenes. These biomarkers were considered circulating concentrations potentially reflecting recent dietary intake(Reference Gropper, Smith and Carr26). All blood and urine analyses were conducted at a certified clinical laboratory.
Zn, carotenes, vitamin K and folic acid were analysed for all participants in both 24hr assessments. However, vitamin C analysis was completed for 34 out of 40 samples due to anticoagulant interference. Similarly, vitamin B1 was assessed in thirty-six samples and Cu in thirty-nine samples, with some exclusions due to haemolysis. Despite these limitations, at least one valid micronutrient analysis was obtained for each participant across the two 24hr assessments.
Statistical analysis
A convenience sample of twenty adults was recruited. Based on this sample size, the minimal detectable correlation coefficient with 80 % power at α = 0·05 was r 0·59. The observed correlation for energy intake between DbF-based photograph-assisted 24hr and weighed food records was ρ = 0·96, indicating that the study was adequately powered to detect the strong associations observed.
Nutrient estimates from each 24hr obtained via ASA24 and DbF were compared against weighed food records. Spearman’s or Pearson’s correlations and Bland–Altman graphs were used to assess correlations and agreement, respectively. PC-SIDE was applied to the nutrient data to obtain the best linear unbiased predictor (BLUP) per nutrient(18) from both ASA24 and DbF. The BLUP for each participant represents the predicted long-term usual intake while accounting for day-to-day variability in dietary consumption. Nutrients exhibiting high variability and not meeting normality assumptions were analysed using raw data. Correlations between biomarkers and estimated nutrient intake were also assessed. Normality was evaluated for all quantitative variables, followed by descriptive analyses including minimum and maximum values, central tendency measures (mean or median, depending on data distribution) and corresponding dispersion measures (standard deviation or interquartile range). Statistical significance was set at P < 0·05. All statistical analyses were performed using R 4.3.1(27) and GraphPad Prism 10(28).
Results
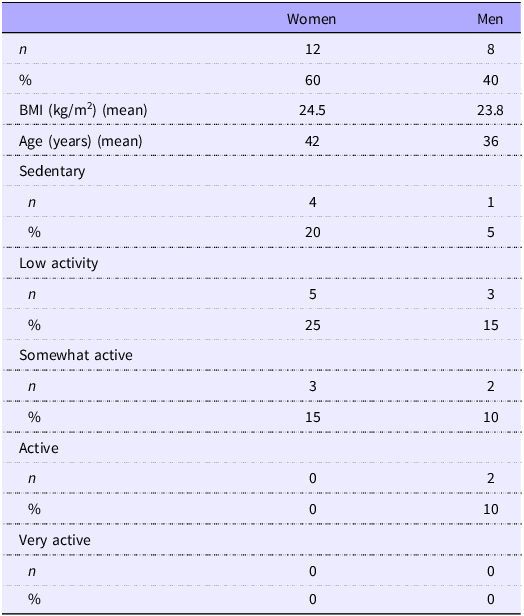
We summarised participant characteristics in Table 1. The mean age and BMI were 39 years and 24·2 kg/m2, respectively. Most participants were women (60 %) and sedentary or low activity (65 %), while none were classified as very active. Energy intake estimates showed similar biases across both dietary assessment methods. Plausible reporting rates were 60 % for ASA24 and 65 % for DbF, whereas overreporting rates were 25 % and 20 %, respectively. Underreporting was 15 % for both approaches.
Participant characteristics

Table 1. Long description
A table comparing participant characteristics by gender and activity level. The table has 12 rows and 4 columns. The columns are labeled Women, Men. The rows are labeled n, percent, BMI (kg/m2) (mean), Age (years) (mean), Sedentary, Low activity, Insufficiently active, Active, Very active. Row 1: Women, 12; Men, 8. Row 2: Women, 60 percent; Men, 40 percent. Row 3: Women, 24.5 kg/m2; Men, 23.8 kg/m2. Row 4: Women, 42 years; Men, 36 years. Row 5: Women, 4; Men, 1. Row 6: Women, 20 percent; Men, 5 percent. Row 7: Women, 5; Men, 3. Row 8: Women, 25 percent; Men, 15 percent. Row 9: Women, 3; Men, 2. Row 10: Women, 15 percent; Men, 10 percent. Row 11: Women, 0; Men, 2. Row 12: Women, 0 percent; Men, 10 percent. Row 13: Women, 0; Men, 0. Row 14: Women, 0 percent; Men, 0 percent.
ASA24 required substantial adaptations to align with the dietary practices of the Colombian population. A total of 391 food items were standardised, and 13 % of the analysed foods required substitution with nutritionally similar options because no direct equivalent was available.
For all analyses, the actual food weights reported by participants were used as reference. Strong and significant correlations were found between ASA24 and weighed food records (all P < 0·0001) for calories (ρ = 0·92), protein (ρ = 0·89), total fatty acids (ρ = 0·91), carbohydrates (ρ = 0·87), sugar (ρ = 0·91) and fibre (ρ = 0·73). Although most observations fell within the limits of agreement, energy intake estimates obtained with ASA24 exhibited substantial bias, with deviations ranging from 771 calories below to 909 calories above weighed food-based estimates. Furthermore, ASA24 showed marked deviations from median macronutrient intake, reaching approximately 50 % for sugars and carbohydrates, 40 % for total fatty acids and protein and 20 % for fibre (Figure 2).
Bland–Altman plot assessing the agreement in nutrient intake estimation between ASA24 and food weights. Panels represent agreement for (A) energy, (B) protein, (C) total fatty acids, (D) carbohydrates, (E) sugar and (F) fibre. Values parallel to the upper and lower dotted lines represent the maximum and minimum of the 95 % limits of agreement, respectively (defined as bias ±1·96 sd). Raw values and percentages of difference from the mean are shown. ASA24, Automated Self-Administered 24-Hour Dietary Assessment Tool.

Figure 2. Long description
Panel A: Scatter plot assessing the agreement in energy intake. The x-axis represents the mean of energy in kilocalories (kcal), and the y-axis represents the difference in energy in kilocalories (kcal). Panel B: Scatter plot assessing the agreement in protein intake. The x-axis represents the mean of protein in grams (g), and the y-axis represents the difference in protein in grams (g). Panel C: Scatter plot assessing the agreement in total fatty acids intake. The x-axis represents the mean of total fatty acids in grams (g), and the y-axis represents the difference in total fatty acids in grams (g). Panel D: Scatter plot assessing the agreement in carbohydrates intake. The x-axis represents the mean of carbohydrates in grams (g), and the y-axis represents the difference in carbohydrates in grams (g). Panel E: Scatter plot assessing the agreement in sugar intake. The x-axis represents the mean of sugar in grams (g), and the y-axis represents the difference in sugar in grams (g). Panel F: Scatter plot assessing the agreement in fibre intake. The x-axis represents the mean of fibre in grams (g), and the y-axis represents the difference in fibre in grams (g). Each plot includes dotted lines representing the 95% limits of agreement, with raw values and percentages of difference from the mean shown.
In contrast, we found stronger correlations between nutrient estimates and weighed food records when data were analysed using DbF rather than ASA24. With DbF, all nutrients exhibited correlations above 0·90 (all P < 0·0001): calories (ρ = 0·96), protein (ρ = 0·92), total fatty acids (ρ = 0·98), carbohydrates (ρ = 0·96), sugar (ρ = 0·98) and fibre (ρ = 0·98). Agreement between energy intake estimated from weighed food records and DbF also improved, with deviations ranging from an underestimation of 364 calories to an overestimation of 256 calories. Deviations from median intake were smaller with DbF than with ASA24 across all macronutrients, ranging from 14 % to 25 % for protein, total fatty acids and carbohydrates, and from 18 % to 31 % for sugar and fibre (Figure 3).
Bland–Altman plot assessing the agreement in nutrient intake estimation between DbF and food weights. Panels represent agreement for (A) energy, (B) protein, (C) total fatty acids, (D) carbohydrates, (E) sugar and (F) fibre estimates. Values parallel to the upper and lower dotted lines represent the maximum and minimum of the 95 % limits of agreement, respectively (defined as bias ±1·96 sd). Raw values and percentages of difference from the mean are shown. DbF, database enriched with local foods and international measurement units.

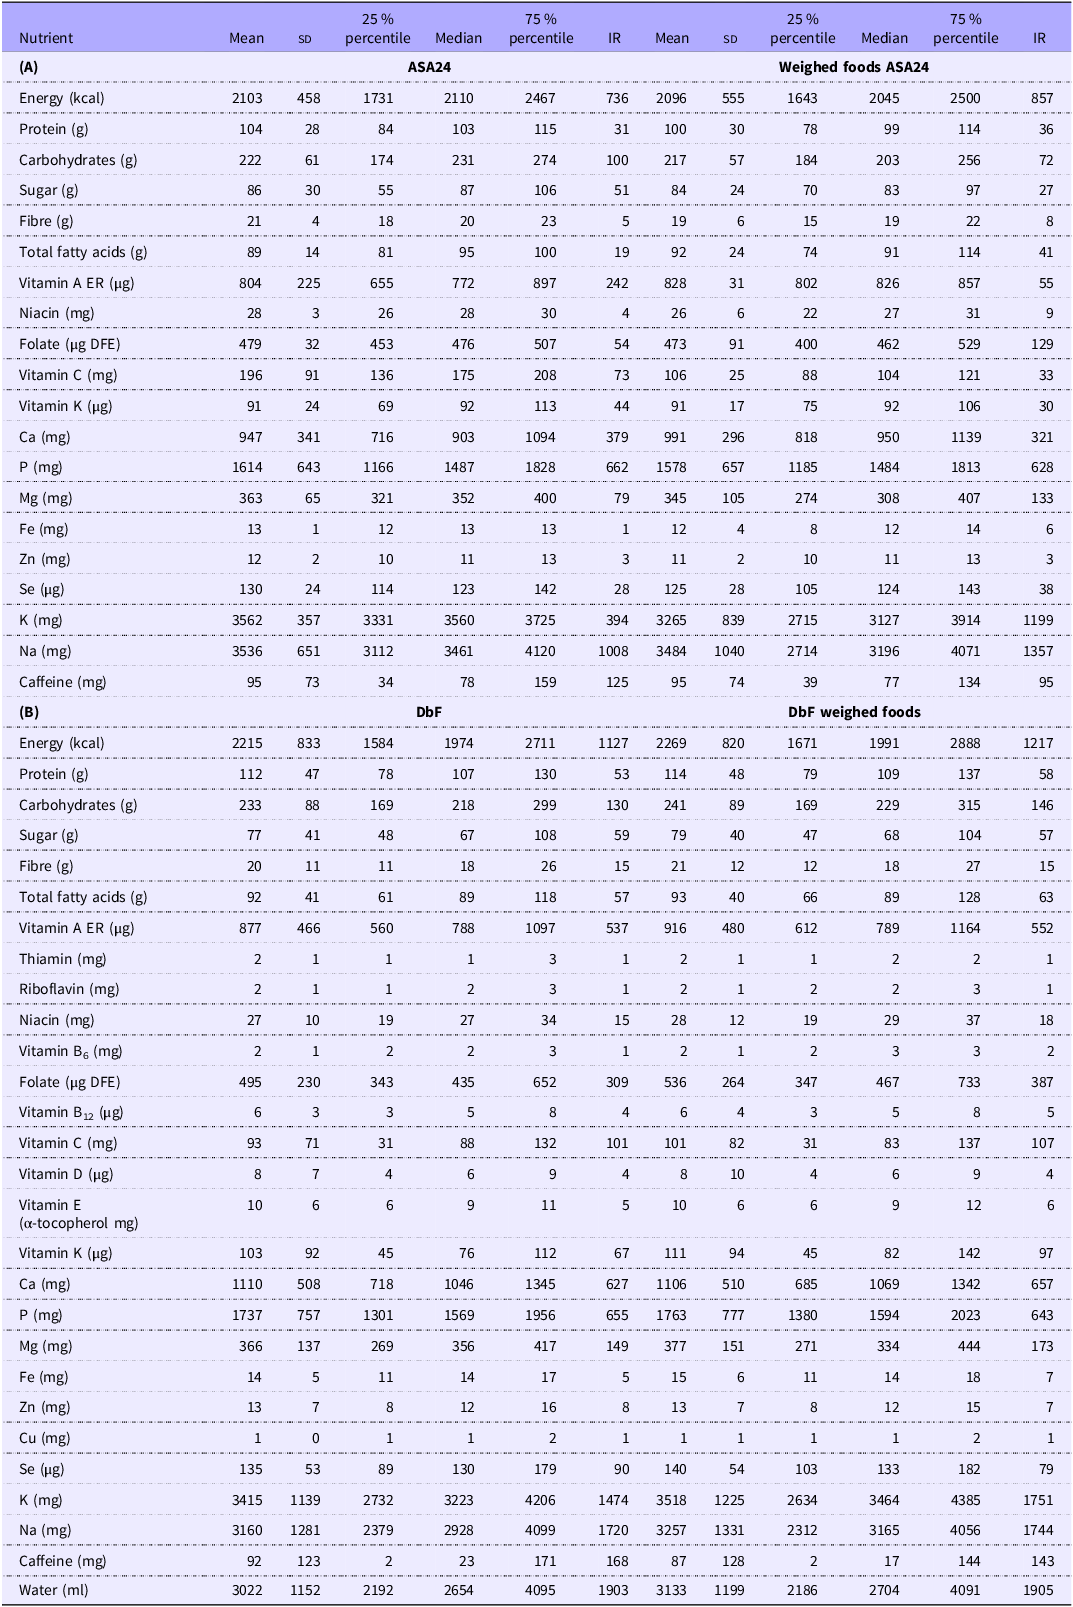
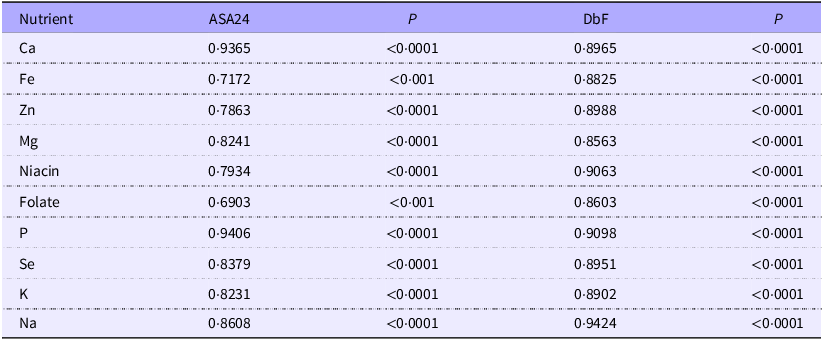
DbF outperformed ASA24 in the assessment of usual intake, successfully estimating twenty-eight nutrients compared with twenty using ASA24 (Table 2). High intake variability prevented ASA24 from accurately estimating usual intake for vitamins B1, B2, B6, B12, D and E, as well as Cu and water. Regarding micronutrient intake, DbF exhibited stronger correlations with weighed food estimates (r 0·86 to 0·94) than ASA24 (r 0·69 to 0·94) for niacin, folate, Fe, Zn, Mg, Se, K and Na (P < 0·05) (Table 3).
Descriptive statistics of nutrients estimated by ASA24-DbF and food weights. (A) ASA24 v. food weights. (B) DbF v. food weights

Table 2. Long description
The table presents descriptive statistics of nutrient intake estimated by ASA24 and DbF compared to weighed food estimates. It is divided into two main sections: (A) ASA24 versus food weights and (B) DbF versus food weights. Each section includes data for various nutrients such as energy, protein, carbohydrates, sugar, fiber, total fatty acids, vitamins, and minerals. The table lists mean, standard deviation, percentiles, median, and interquartile range for each nutrient. Panel A includes nutrients like energy (kcal), protein (g), carbohydrates (g), sugar (g), fiber (g), total fatty acids (g), Vitamin A (µg), niacin (mg), folate (µg D F E), Vitamin C (mg), Vitamin K (mg), calcium (mg), phosphorus (mg), magnesium (mg), iron (mg), zinc (mg), selenium (mg), potassium (mg), sodium (mg), and caffeine (mg). Panel B includes similar nutrients with additional details for DbF weighed foods. The table provides a comprehensive comparison of nutrient intake estimates from different methods.
ASA24, Automated Self-Administered 24-Hour Dietary Assessment Tool; DbF, database enriched with local foods and international measurement units; IR, interquartile range; DFE, dietary folate equivalents; ER, retinol equivalents.
Pearson’s correlation coefficients and associated P-values between usual micronutrient intake estimated by ASA24 and DbF v. food weights

Table 3. Long description
A table comparing Pearson’s correlation coefficients and associated P-values between usual micronutrient intake estimated by ASA24 and DbF methods. The table has 11 rows and 4 columns. The columns are labeled Nutrient, ASA24, P, DbF, and P. The row labels are Ca, FE, Zn, Mg, Niacin, Folate, P, Se, K, and Na. Each row provides the correlation coefficients and P-values for the respective nutrients. For example, Row 1: Ca, 0.9365, <0.0001, 0.8965, <0.0001.
ASA24, Automated Self-Administered 24-Hour Dietary Assessment Tool; DbF, database enriched with local foods and international measurement units.
We assessed correlations between selected biomarkers and estimated nutrient intake based on actual food weights. We observed high and significant correlations (all P < 0·0001) between intake estimates and urinary biomarkers of protein (ρ = 0·63), Na (ρ = 0·73) and K (ρ = 0·62) (Figure 4). Similarly, we found moderate correlations between intake estimates and blood levels of vitamin K1 (r 0·42, P < 0·0001) and carotenoids (r 0·39, P < 0·0001). No significant correlations were observed for Zn, Cu, vitamins C and B1, or folic acid.
Correlations between intake biomarkers and nutrient estimations. (A) PRT and protein estimation. (B) Urinary sodium and intake estimation. (C) Urinary potassium and intake estimation. PRT, estimated protein intake.

Figure 5 illustrates discrepancies in food weight estimation between ASA24 and DbF. The largest estimation errors with ASA24 were observed for culturally specific foods and regional preparations, particularly empanadas (dough-based pastries filled with ingredients), buñuelos (fried bread dough), blood sausage (rellena, morcilla), hot chocolate, boiled potatoes, bananas and bread, which substantially affected subsequent estimates of calories, carbohydrates and fats. In contrast, DbF reduced these discrepancies, resulting in closer agreement with weighed food records.
Heatmaps representing the estimation error in food weight and nutrient intake, comparing ASA24 and DbF with actual food weights. (A) ASA24 v. food weights. (B) DbF v. food weights. The heatmaps are divided into two sections. The left section displays the estimation error for food weight and calories, where red values indicate overestimation and green values indicate underestimation. The right section displays the estimation error for carbohydrates (carb.), sugars (sugar), protein, total fat (FAT) and fibre, where brown values indicate overestimation and blue values indicate underestimation.

Figure 5. Long description
Panel A: A heat map comparing ASA24 with actual food weights. The left section shows estimation errors for food weight and calories, with red indicating overestimation and green indicating underestimation. The right section shows errors for carbohydrates, sugars, protein, total fat, and fiber, with brown indicating overestimation and blue indicating underestimation. Panel B: A heat map comparing DbF with actual food weights. The left section shows estimation errors for food weight and calories, with red indicating overestimation and green indicating underestimation. The right section shows errors for carbohydrates, sugars, protein, total fat, and fiber, with brown indicating overestimation and blue indicating underestimation.
Discussion
Our study demonstrates that the accuracy of dietary assessment in a Colombian population is substantially compromised by the geographical and cultural incompatibility of international reference databases such as ASA24/FNDDS. Using photograph-assisted 24hr, we showed that a locally contextualised database enriched with regional foods and metric measurement units (DbF) reduced misreporting and improved agreement with weighed food records compared with ASA24, indicating greater accuracy in nutrient intake estimation.
Regarding misreporting, we considered a maximum energy intake requirement of 2000 calories because the study population was predominantly sedentary, with a high prevalence of physical inactivity (65 % of participants had <7500 steps/d)(Reference Batista, de França and Fontanelli29). This threshold resulted in plausible reporting rates of 60 % and 65 % for ASA24 and DbF, respectively. Underreporting prevalence varies widely across dietary assessment studies, ranging from 21·5 % to 67 % for 24hr, 11·9 % to 44 % for estimated food records and 14·3 % to 38·5 % for weighed food records(Reference Poslusna, Ruprich and de Vries30). In our study, underreporting prevalence was 15 %, close to the lower range previously reported, supporting the reliability of our data.
The Bland–Altman analysis showed acceptable limits of agreement for both ASA24 and DbF relative to food weights. However, ASA24 exhibited greater under- and overestimation of calories, protein, total fatty acids, carbohydrates, sugar and fibre, with deviations exceeding twice the estimates from food weights. In professional practice, discrepancies between estimated and actual food weights constitute an important source of bias in nutrient assessment. Compared with weighed food records, ASA24 showed deviations ranging from −771 to +909 calories, whereas DbF reduced these discrepancies substantially (−364 to +256 calories). We attributed the lower accuracy observed with ASA24 to the need to match local foods not represented in FNDDS when analysing diets rich in regional preparations. These findings support the use of reference databases incorporating local foods to improve dietary assessment accuracy.
Few dietary studies focus on intake accuracy. A recent Danish study validated two 24hr against doubly labelled water, reporting a mean difference of approximately 1600 calories, with most values falling within 2 sd (Reference Biltoft-Jensen, Ygil and Knudsen31). In a crossover study comparing ASA24 (adapted for Australia) and Intake24 (an Australian food and beverage database tool), the authors found discrepancies of 76 and 24 calories, respectively, relative to actual food weights(Reference Whitton, Collins and Mullan32). These smaller differences were likely explained by the controlled feeding conditions, in which foods were weighed by researchers and served separately, thereby reducing variability and perception bias. Our study showed intermediate deviations relative to these studies for both with ASA24 and DbF. However, DbF provided the closest agreement with actual food weights, achieving greater accuracy in nutrient intake estimation.
Another study showed that intake in low-income women using ASA24, with or without assistance from trained professionals, reported discrepancies between actual and reported intake for protein, folate, Fe, vitamin D, vitamin A, Mg and Ca(Reference Kirkpatrick, Guenther and Douglass33). The lowest concordance was observed for vegetables and meats, which might explain the estimation bias identified for several nutrients. We observed in our study a similar pattern, where carbohydrate- and fat-rich foods showed greater estimation errors in both ASA24 and DbF analysis. Using ASA24, meats (pork, beef), fats (vegetable oils, bacon, avocado) and high-starch foods (empanada, potatoes, maize, plantain, banana, pasta, rice and maize cereal) exhibited the largest biases. In DbF, we found the greatest estimation errors for fat-rich foods (pork cracklings, bacon) and high-starch foods (rice, empanada, plantain), all commonly consumed in Colombian cuisine (Figure 5). The lower accuracy observed with ASA24 may be related to limited portion size options based on unfamiliar measurement units (diameters, inches, ounces), and the inability of the system to assign negligible amounts of these foods in mixed dishes, forcing the selection of larger portions or reliance on automatic calculations. These factors likely contributed to both over- and underestimations of actual intake. In contrast, the remaining bias observed with DbF may reflect cultural variability in food preparation and portion sizes. Nevertheless, DbF enabled more detailed adjustments by considering actual food weights in different preparations, improving the accuracy of intake analysis.
Compared with ASA24, DbF enabled the identification of specific foods and portion size references contributing to estimation errors, facilitating error control and reducing intra- and inter-individual variability in the Colombian population. This improved the estimation of usual intake for twenty-eight nutrients (v. 20 with ASA24). Although no significant differences were observed in estimated nutrient intake between ASA24 and DbF, as both methods showed a high proportion of plausible reports, DbF provided a more accurate intake assessment through the incorporation of local foods and culturally relevant measurement units. Similar findings were reported in a Japanese study that evaluated energy and nutrient intake using national food composition tables(Reference Nakadate, Kobayashi and Ishihara34). However, that study adjusted energy intake using the residual method rather than calculating usual intake, limiting its applicability to actual consumption patterns, as their data were not affected by variance, and they were able to obtain as many nutrients as were available in the analysis source. Estimating usual intake is essential for analysing nutrient inadequacies, particularly for nutritional epidemiology and dietary surveillance(Reference Deitchler, Arimond and Hotz35–Reference Dodd, Guenther and Freedman37).
Regarding intake biomarkers, our findings reaffirmed the reliability of estimating protein, Na and K intake from 24-h urine collections, considering necessary metabolic adjustments such as insensible losses(Reference Okuda, Asakura and Sasaki21–Reference Bingham and Cummings23,Reference McLean, Farmer and Nettleton38) . These biomarkers showed stronger correlations with estimated intake in our study than those reported in other populations. For example, previous studies estimating protein intake in adolescents(Reference Okuda, Asakura and Sasaki21), men and women(Reference Schatzkin, Kipnis and Carroll39) reported correlations between estimated intake and biomarkers below r 0·45, lower than the correlation observed in our study (ρ = 0·62). Similarly, correlations between estimated Na and K intake and biomarkers reported in a previous study were also lower than those observed here(Reference Freedman, Midthune and Carroll25).
On the other hand, we found discrepancies between the estimated intake and biomarkers of vitamins B1, C, K1, folic acid, carotenoids, Zn and Cu. Many vitamins and minerals have a short biological half-life, and their plasma concentrations fluctuate substantially(Reference Mitmesser, Ye and Evans40). For example, vitamin C levels peak within four hours of consumption, particularly when supplementation doses exceed typical dietary amounts(Reference Mitmesser, Ye and Evans40). In addition, certain vitamins and minerals are sensitive to light and temperature, leading to losses during food processing(Reference Clarke, Rollo and Pezdirc41,Reference Couillard, Lemieux and Vohl42) . Therefore, the timing of biomarker assessment and the measurement of metabolites or metabolic products rather than the micronutrient itself may be necessary to improve intake estimation accuracy(Reference Clarke, Rollo and Pezdirc41,Reference Couillard, Lemieux and Vohl42) . These findings highlight the need for further research to improve the accuracy of dietary biomarker assessment.
Our study has several strengths. It included two non-consecutive 24hr assessments conducted on both weekdays and weekend days, without dietary restrictions, likely providing a better representation of usual intake. The recalls incorporated photographs, food descriptions and weighed food records, mitigating memory, perception and conceptualisation biases. In addition, photographs facilitated the recall process and allowed dietitians to verify participant reports, identify discrepancies and probe for additional details, thereby reducing misreporting. All intake data, including the photograph-based analysis, recall assessments, ASA24 and DbF manipulation, intake normalisation and nutrient data processing, were handled by a team of trained dietitians. Furthermore, the use of a database enriched with local foods increased the accuracy of energy and nutrient intake estimation.
Despite these strengths, we acknowledge limitations. The study included a relatively small sample size, limiting stratified analyses by sex or age. However, the carefully controlled design, including photograph-assisted recalls, weighed food records and biomarker measurements, provides robust proof-of-concept data that support the feasibility and validity of the proposed approach and warrant larger validation studies. It is also important to note that anthropometric data were self-reported, restricting a more detailed evaluation of nutritional status, and that weighed food records, although considered an excellent reference method, may influence food intake through a Hawthorne effect. Although DbF improved dietary assessment accuracy, it still relies on food composition tables, which have inherent limitations. Finally, micronutrient metabolites were not measured.
A model for contextualising dietary assessment
The results presented here suggest that improving dietary assessment accuracy in non-Western populations requires more than technological support alone. Although photograph-assisted recalls help reduce bias, accuracy depends substantially on the availability of a regionally contextualised reference database capable of representing local foods, preparation methods and portion size references. This study therefore supports a two-pronged model for contextualising dietary assessment that combines technology-assisted recalls with locally adapted food composition databases.
We propose this model as a proof-of-concept for a modular and adaptable framework that could be implemented in other underrepresented populations worldwide. Similar contextual adaptations may improve the validity of dietary assessment tools in regions where standardised international databases fail to capture local dietary practices. Such an approach may improve professional nutritional practice, enhance the accuracy of nutritional epidemiology and strengthen dietary surveillance and public health monitoring at a global scale.
Conclusion
Combining DbF with photograph-assisted 24hr improved dietary assessment accuracy by reducing deviations from actual food weights and identifying foods associated with substantial estimation errors. More importantly, this approach provides a proof-of-concept for a technology-assisted and contextualised dietary assessment model that could be adapted to other populations. Investing in the development and validation of open-access, locally relevant food composition databases is a critical step towards equitable and accurate global nutritional surveillance.
Supplementary material
For supplementary material/s referred to in this article, please visit https://doi.org/10.1017/S0007114526108769
Data availability statement
The analysis code used to process and classify dietary intake data is publicly available at https://github.com/Vidarium/Dietary-Intake-Assessment-ASA-DbF. No additional individual-level datasets are deposited in other repositories.
Acknowledgements
The authors are grateful to the participants for their commitment to the study.
Author contributions
V.C.-A.: Conceptualisation (lead), data curation, formal analysis, investigation, methodology, project administration, supervision, validation, visualisation, writing – original draft preparation (lead), writing – review and editing. O.L.O.-S.: Conceptualisation, data curation, formal analysis, investigation, methodology, validation, visualisation, writing – original draft preparation, writing – review and editing. M.H.: Data curation, formal analysis, investigation, validation, writing – original draft preparation. J.S.E.: Conceptualisation, methodology, supervision, writing – original draft preparation. D.A.R.: Investigation, writing – original draft preparation. O.J.L.-G.: Formal analysis, investigation, visualisation, writing – original draft preparation. N.A.V.-S.: Formal analysis, investigation, writing – original draft preparation, writing – review and editing. K.M.-D.: Conceptualisation, formal analysis, methodology, supervision, writing – original draft preparation. J.A.S.: Conceptualisation, data curation, formal analysis, methodology, supervision, writing – original draft preparation. All authors read and approved the final manuscript.
Financial support
This project was funded by Vidarium (Grupo Nutresa) and supported by tax incentives from the Colombian Ministry of Science, Technology, and Innovation (Resolution 1491 of 2022; code 328691190869). The sponsors had no role in the study design, data collection, data analysis, data interpretation, manuscript preparation or the decision to publish the results.
Competing interests
While engaged in this project, V. C.-A., O.L.O.-S., M.H., J.S.E., D.A.R., O.J.L.-G., N.A.V.-S., K.M.-D. and J.A.S. were employed by Vidarium, a research centre belonging to a food company (Grupo Empresarial Nutresa).