



Non-technical Summary
The quantification of shape in 3D for marine extinct arthropods remains rarely documented. Based on both heads and tails of some trilobites, we compare the overall shape and explore the ontogenetic patterns and the phylogenetic signal for the first time in 3D versus 2D. We demonstrate that there are rather congruent results between 3D and 2D to discriminate taxa; 2D and 3D landmarks capture different levels of detail, and the third dimension in 3D is very important for making taxonomic distinctions at the genus level; there is congruity between 2D and 3D datasets for ontogenetic patterns; the phylogenetic morphospaces show tree branches that do not intersect, suggesting possible phylogenetic constraints on morphospace occupation for each species; and the morphological descriptors in morphometric analyses in 2D and 3D throughout trilobite evolution are effective.
Introduction
Trilobites are a central group for the study of Paleozoic faunas and provide outstanding opportunities for the understanding of mechanisms underlying evolutionary patterns at different spatial and temporal scales (e.g., Foote Reference Foote1991; Adrain et al. Reference Adrain, Westrop, Chatterton and Ramsköld2000; Bault et al. Reference Bault, Balseiro, Monnet and Crônier2022a; Saleh et al. Reference Saleh, Guenser, Gibert, Balseiro, Serra, Waisfeld and Antcliffe2022). Because of their taxonomical, morphological, and behavioral diversity, they constitute a model to understand patterns of morphological variability and phylogenetic, developmental, or environmental factors that contribute to morphological diversity (Bault et al. Reference Bault, Crônier and Monnet2022b). The geometric morphometrics method is a useful tool to quantify and visualize this morphological variation as well as to test ontogenetic and phylogenetic factors (Bault et al. Reference Bault, Crônier and Monnet2022b). Geometric morphometrics encompasses several modern methods of shape or form quantification by using two-dimensional (x, y) or three-dimensional (x, y, z) coordinates that are differently parameterized in a way that is invariant or independent to changes in location, orientation, or scale to describe a complex geometry of shape or form (see reviews in Adams et al. Reference Adams, Rohlf and Slice2004, Reference Adams, Rohlf and Slice2013; Mitteroecker and Schaefer Reference Mitteroecker and Schaefer2022).
Historically, the morphological variation in trilobites has been studied by using 2D quantitative analyses due to their complex exoskeletal morphology and their robust fossil record (Foote Reference Foote1991; Smith and Lieberman Reference Smith and Lieberman1999; Webster Reference Webster2007; Hopkins Reference Hopkins2013; Jacobs and Carlucci Reference Jacobs and Carlucci2019; Bault et al. Reference Bault, Crônier and Monnet2022b). Typically preserved as disarticulated exuviae rather than complete exoskeletons, morphological cephalic (head) data on the one hand and pygidial (tail) data on the other hand supported the existence of variation within and among species based on several 2D analyses (Crônier et al. Reference Crônier, Renaud, Feist and Auffray1998, Reference Crônier, Auffray and Courville2005, Reference Crônier, Budil, Fatka and Laibl2015; Oudot et al. Reference Oudot, Neige, Laffont, Navarro, Khaldi and Crônier2019; Bault et al. Reference Bault, Crônier and Monnet2022b). Such knowledge of intraspecific variation is an important requirement for studying taxonomy as well as for studying diversity patterns through time and their relationship with environmental changes (Crônier et al. Reference Crônier, Feist and Auffray2004, Reference Crônier, Budil, Fatka and Laibl2015; Månsson and Clarkson Reference Månsson and Clarkson2012). Crônier et al. (Reference Crônier, Feist and Auffray2004) emphasized a tendency in the trilobite Acuticryphops in the way that the reduction in mean lens number in successive populations occurs in parallel with eustatic deepening; the selection pressures affecting the visual complex may have relaxed, whereas those concerning general morphology remained unchanged and subject to canalizing selection.
Geometric morphometrics offers an approach to provide a detailed quantification of shape diversity and taxonomic assessment, as well as information about ontogenetic allometries. Morphological variation among populations may arise through the proportional change of morphological traits associated with size change during development (Crônier et al. Reference Crônier, Renaud, Feist and Auffray1998, Reference Crônier, Auffray and Courville2005). Evolutionary changes in sizes and shapes can be accompanied by alterations in development (i.e., heterochrony; sensu Gould Reference Gould1977) due to developmental bias or constraint favoring evolutionary changes along the allometric trajectories (Arthur Reference Arthur2002; Gould Reference Gould2002). For example, a paedomorphic evolutionary trend was observed in Devonian trilobites by mapping the changes to phylogeny. This trend concerns the regression of their visual complex (Crônier and Courville Reference Crônier and Courville2003; Crônier Reference Crônier2013). Closely related species tend to be more similar in their trait values due to their shared evolutionary history (Felsenstein Reference Felsenstein1985; Revell et al. Reference Revell, Harmon and Collar2008). The consequences can be examined by determining the degree to which morphological traits exhibit phylogenetic signal (Blomberg et al. Reference Blomberg, Garland and Ives2003; Munkemuller et al. Reference Munkemuller, Lavergne, Bzeznik, Dray, Jombart, Schiffers and Thuiller2012). Geometric morphometrics provides a way of describing for how evolutionary lineages occupy the morphological space by quantifying and evaluating the phylogenetic signal for closely related species (Rohlf and Marcus Reference Rohlf and Marcus1993; Mitteroecker and Gunz Reference Mitteroecker and Gunz2009; Adams Reference Adams2014).
Over the last a few decades, geometric morphometrics has continued to develop with the rise of 3D approaches (Hallgrimsson et al. Reference Hallgrimsson, Percival, Green, Young, Mio and Marcusio2015) due to the increased availability of 3D equipment in laboratories. This availability does not prevent the use of 2D approaches, which remain popular with paleontologists. While 2D quantitative analyses have advanced our understanding of the morphological relationships among trilobites, the quantification of their morphological traits in 3D remains rarely documented. Hopkins and Pearson (Reference Hopkins and Pearson2016) used 3D geometric morphometrics to quantify shape variation during development of the highly convex cephalon of an Ordovician trinucleid trilobite. Esteve et al. (Reference Esteve, Rubio, Zamora and Rahman2017) created 3D computer models to assess the kinetics to achieve enrollment types in Cambrian conocoryphid trilobites. Compared with 3D geometric morphometrics, 2D geometric morphometrics appears faster but less accurate whenever applied to a non-flat structure (Álvarez and Perez Reference Álvarez and Perez2013; Cardini Reference Cardini2014). This has led several authors (Cardini and Chiapelli Reference Cardini and Chiapelli2020; Cardini et al. Reference Cardini, de Jong and Butynski2022) to work on 2D to 3D approximations in geometric morphometrics. Because trilobite shape is difficult to summarize using a 2D approach, we suspect that a classical 2D quantitative analysis can lead to the loss of an important part of the shape variation. Therefore, comparative studies are necessary to determine whether the previous results obtained from 2D studies remain reliable or not.
In this study, geometric morphometrics was used to explore shape allometries as well as to explore how the shape variations can be explained by the phylogenetic relationships among trilobite species in 2D on the one hand and 3D on the other. Our goal is to determine whether the conclusions that we would draw about allometry and morphological distinctiveness in trilobites would differ if 3D morphometrics was used instead of 2D morphometrics.
By using the same data as a basis, a cross-sectional analysis has been realized on a sample of eight well-preserved closely related phacopid species from Algeria. Studied species are representative of an Emsian–Eifelian lineage of North Africa (Khaldi et al. Reference Khaldi, Crônier, Hainaut, Abbache and Ouali Mehadji2016), although not all species were included due to insufficient preservation. Our sample is small but includes the most complete specimens attributed to this lineage, and we have 2D and 3D data for the same specimens. Our sample gives us the opportunity (1) to quantify their intraspecific variation, (2) to evaluate the hypothesis that there is a common significant shape allometric pattern among species, (3) to explore how the shape variations can be explained by the phylogenetic relationship among species, and (4) to explore precision in results in 2D and 3D, that is, to test whether 2D morphometrics provides the same responses as the more accurate 3D morphometrics. Based on mathematical principles we expect that results of the 3D dataset, especially the ordination in morphospace, will be strongly correlated with the 2D dataset. The two datasets have two-thirds of their variables in common, and the two datasets, and any results based on them, are autocorrelated by the shared x and y coordinates of the landmarks. The degree to which the 3D and 2D data are not identical is a function of how much relief there is in the third dimension (which is the amount of new variance added to the dataset) minus how much that third dimension is correlated with the first two dimensions (the amount of covariance shared with the 2D landmarks).
Materials and Methods
Data Collection
The studied phacopid species assigned to four closely related genera originate from the Lower Devonian of Algeria (Erg el Djemel, Saoura Valley) where many specimens are encountered as well-preserved 3D articulated and enrolled exoskeletons (see Khaldi et al. Reference Khaldi, Crônier, Hainaut, Abbache and Ouali Mehadji2016). These exoskeletons represent different instars and can constitute a continuous ontogenetic series ranging from the early to the late holaspid stages, that is, the “adult” period (see Khaldi et al. Reference Khaldi, Crônier, Hainaut, Abbache and Ouali Mehadji2016). As with all trilobites, sex and absolute age cannot be identified. These specimens are representatives of Austerops McKellar and Chatterton, Reference McKellar and Chatterton2009 and Morocops Basse, Reference Basse2006. Additionally, a few specimens assigned to other phacopids (i.e., Boeckops and Adrisiops, both from the Erg el Djemel) and a complete individual assigned to Phacops s.l. from the Tindouf Basin have been included for their good preservation and comparability with closely related taxa (Table 1). A total of 60 cephala and 41 pygidia were analyzed in 2D as well as in 3D for comparison (Table 1). The material is not abundant, but this paucity is not unusual (Crônier and Clarkson Reference Crônier and Clarkson2001; Crônier et al. Reference Crônier, Budil, Fatka and Laibl2015), and the data are important in terms of macroevolutionary issues.
Sample size per species. PCA, principal component analysis.

The 3D Meshes and 2D Pictures
The general 3D shape of trilobite exoskeletons was digitized by using a structured-light 3D scanner connected to a camera system (two Grasshopper3 USB3.0 cameras providing high-quality imaging for 3D measurement) and controlled by the software package Flexscan3D 3.1 (Polyga) on the Gismo platform, Biogéosciences lab, Dijon, France (http://gismo-solutions.fr). The size of our specimens being small, close to 1 cm, 50 mm lenses and a 3 mm square for system calibration were used (average projection error for calibration less than 7 μm). All scans have been exported in PLY format.
Additionally, 2D pictures have been taken of the same specimens for comparison. Dorsal views of specimens with the palpebral lobes in the horizontal plane (for orientation of specimens, see Shaw Reference Shaw1957) and oriented on the bilateral plane of symmetry were photographed using a Canon PowerShot S2 IS camera (5.0 megapixels; Canon zoom lens, 12×) on a binocular Zeiss Stemi SV11-Apo (by CC at the University of Lille).
Landmarks and Data Points
Landmarks were digitized on both sides of cephala and pygidia for the 3D and 2D datasets for consistency. As mentioned by Cardini (Reference Cardini2017), it is better to landmark both sides of a symmetric structure.
The 3D landmarks were digitized on meshes with the free software R by using the function digitMesh from the package Digit3DLand (https://github.com/morphOptics/digit3DLand). In total, 32 (6 on the midplane and 13 paired) and 13 (3 on the midplane and 5 paired) 3D landmarks have been defined and digitized respectively on complete cephala and pygidia, and 19 (6 on the midplane) 3D landmarks have been defined and digitized on the right or left side of cephala (Fig. 1B). The descriptions of these landmarks are given in Table 2.
A, Left to right: Enrolled phacopid trilobite in dorsal and ventral views from cephalon and in dorsal view from pygidium. B, Nineteen and eight 3D landmarks defined on one side from cephala (left images) and pygidia (right image). C, Fifteen and eight 2D landmarks defined on one side from cephala (left) and pygidia (right).

Descriptions of landmarks.
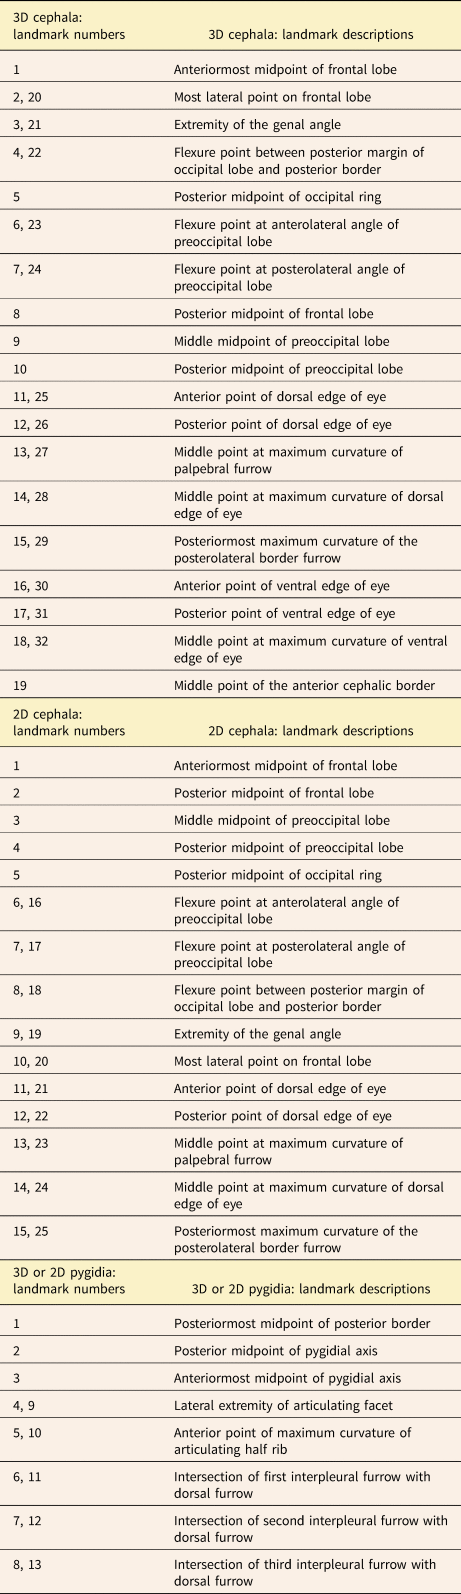
The 2D landmarks were digitized on pictures using the free software TPSdig (Rohlf Reference Rohlf2015) to summarize the cephalic shape. Twenty-five (5 on the midplane and 10 paired) and 13 (3 on the midplane and 5 paired) 2D landmarks have been defined and digitized on complete cephala and pygidia, respectively, and 15 2D landmarks have been defined and digitized on the right or left side of cephala (Fig. 1C). The descriptions of these landmarks are given in Table 2.
For incomplete specimens, the left side (or the right side) of cephalon and pygidium were reconstructed by symmetrizing the right-side (or the left-side) landmarks using the unpaired landmarks lying on the symmetry axis in both 3D and 2D in order to avoid problems related to treating only half of a bilateral structure (Cardini Reference Cardini2016). In 3D, a function to reflect 3D points across the plane of symmetry of an object (modified from R. H. Griffin; https://github.com/rgriff23/rgriff23.github.io) has been used.
Statistical Shape Analyses
To separate size and shape information from the cephalon and pygidium landmark configurations (for both 2D and 3D cases), each of the four datasets (one for each of both tagma and depending on each dataset dimensionality) was subject to a generalized Procrustes analysis (GPA). To deal with the object symmetry of our configurations (i.e., the bilateral symmetric nature of cephala and pygidia having a left and a right side separated by a midline; see Klingenberg and McIntyre Reference Klingenberg and McIntyre1998), this Procrustes fit included all individual configurations as well as their mirror configurations (with relabeled landmarks switched on either side of the plane of symmetry (Klingenberg et al. Reference Klingenberg, Barluenga and Meyer2002). We used GPA minimizing the partial Procrustes distances among configurations and the dataset mean shape (Dryden and Mardia Reference Dryden and Mardia1998). The GPA algorithm is based on rigid transformations of landmark configurations and consists of three main steps: each configuration is (1) translated to its centroid to remove the position information, (2) scaled to unit centroid size to remove the size information, and (3) rotated onto the dataset mean shape (iteratively estimated) based on the minimization of the partial Procrustes distances to remove the orientation information. Once aligned by GPA, mirrored individual configurations were then averaged. Finally, all configurations were projected onto the tangent space to the mean shape to go back to a Euclidean space. All those steps were performed by using the bilat.symmetry() function from the R geomorph package (Adams and Otarola-Castillo Reference Adams and Otarola-Castillo2013) in the R statistical environment (R Development Core Team 2019).
Principal component analyses (PCAs) were performed for each of our four datasets (including all individuals) to extract the major patterns of shape variation expressed by the first few PCs (principal components). Those PCAs were computed from the singular value decomposition of the variance–covariance matrices from the Procrustes tangent coordinates, by using the plotTangentSpace() function from the R geomorph package. To visualize the shape deformations associated with each PC, we used thin plate spline (TPS; see Bookstein Reference Bookstein1991) interpolation from the mean shape to project theoretical shapes along each of these axes. For 2D datasets, we used TPS grid visualizations, and for 3D datasets, we used mesh warping visualizations (using the plotRefToTarget() function from the R geomorph package).
To quantify and test shape allometries among our species, we performed a Procrustes analysis of variance (ANOVA; Klingenberg and McIntyre Reference Klingenberg and McIntyre1998). For the 2D and 3D datasets, we tested possible different allometries among species through a linear model wherein the shape (tangent Procrustes coordinates) variation could be explained by: a size effect (expressed as the log of the centroid sizes), a species effect, as well as the size x species interaction. The p-values for each effect were obtained through 9999 random permutations of the model residuals. This was done by using the procD.lm() function in the R geomorph package. Then, a pairwise mean shape comparison was done to test pairwise differences among least-squares means or slopes from the allometric models (by using the pairwise() function from the RRPP package; Collyer and Adams Reference Collyer and Adams2018). To visualize main allometric patterns and elucidate main divergence in allometric vectors among species, prediction lines (i.e., plot of PC 1 scores from the fitted values from the ANOVA models against the log of centroid sizes; see Adams and Nistri Reference Adams and Nistri2010) were used, and TPS grids (2D) or mesh warping (3D) were used to depict allometric shape variations. The 95% confidence intervals (CIs) associated with each prediction line were reported by using the plot.predict.lm.rrpp() function from the RRPP package. Nevertheless, as the sample size for some of our studied species is small, we are more interested in comparing than testing whether allometric signals differ among species for a given dataset in 2D and 3D.
To explore how the shape variations in cephalon and pygidium can be explained by the phylogenetic relations among species, we computed phylomorphospaces (Klingenberg and Gidaszewski Reference Klingenberg and Gidaszewski2010) on our datasets based on a PCA performed on species’ mean shapes and the phylogenetic tree modified from Oudot et al. (Reference Oudot, Crônier, Neige and Holloway2018) (by using the plotGMPhyloMorphoSpace() function from the R geomorph package). A phylogenetic tree was inferred from 63 morphological characters (modified from Oudot et al. Reference Oudot, Crônier, Neige and Holloway2018; McKellar and Chatterton Reference McKellar and Chatterton2009). The phylogenetic signal in this space was then quantified by K mult statistics (Adams Reference Adams2014), and its significance was obtained through random permutations (9999) of species among tree tips: the physignal() function from the R geomorph package was used for this.
Finally, to compare the 2D and 3D morphospaces, the Procrustes shape distances among individuals were calculated by using the dist() function from R. For a given tagma, the similarity between partial Procrustes distances from 2D and 3D datasets was quantified through a Mantel test (Mantel Reference Mantel1967; Legendre and Legendre Reference Legendre and Legendre2012) by using the mantel() function in the R vegan package (Oksanen et al. Reference Oksanen, Blanchet, Friendly, Kindt, Legendre, McGlinn and Minchin2018). Because of the non-independence of observations from which distances were computed (2D coordinates are expected to be at least in part correlated with 3D ones), we did not report associated statistical test, as it would be incorrect (Cardini Reference Cardini2014).
Results
Shape Variation: 2D versus 3D
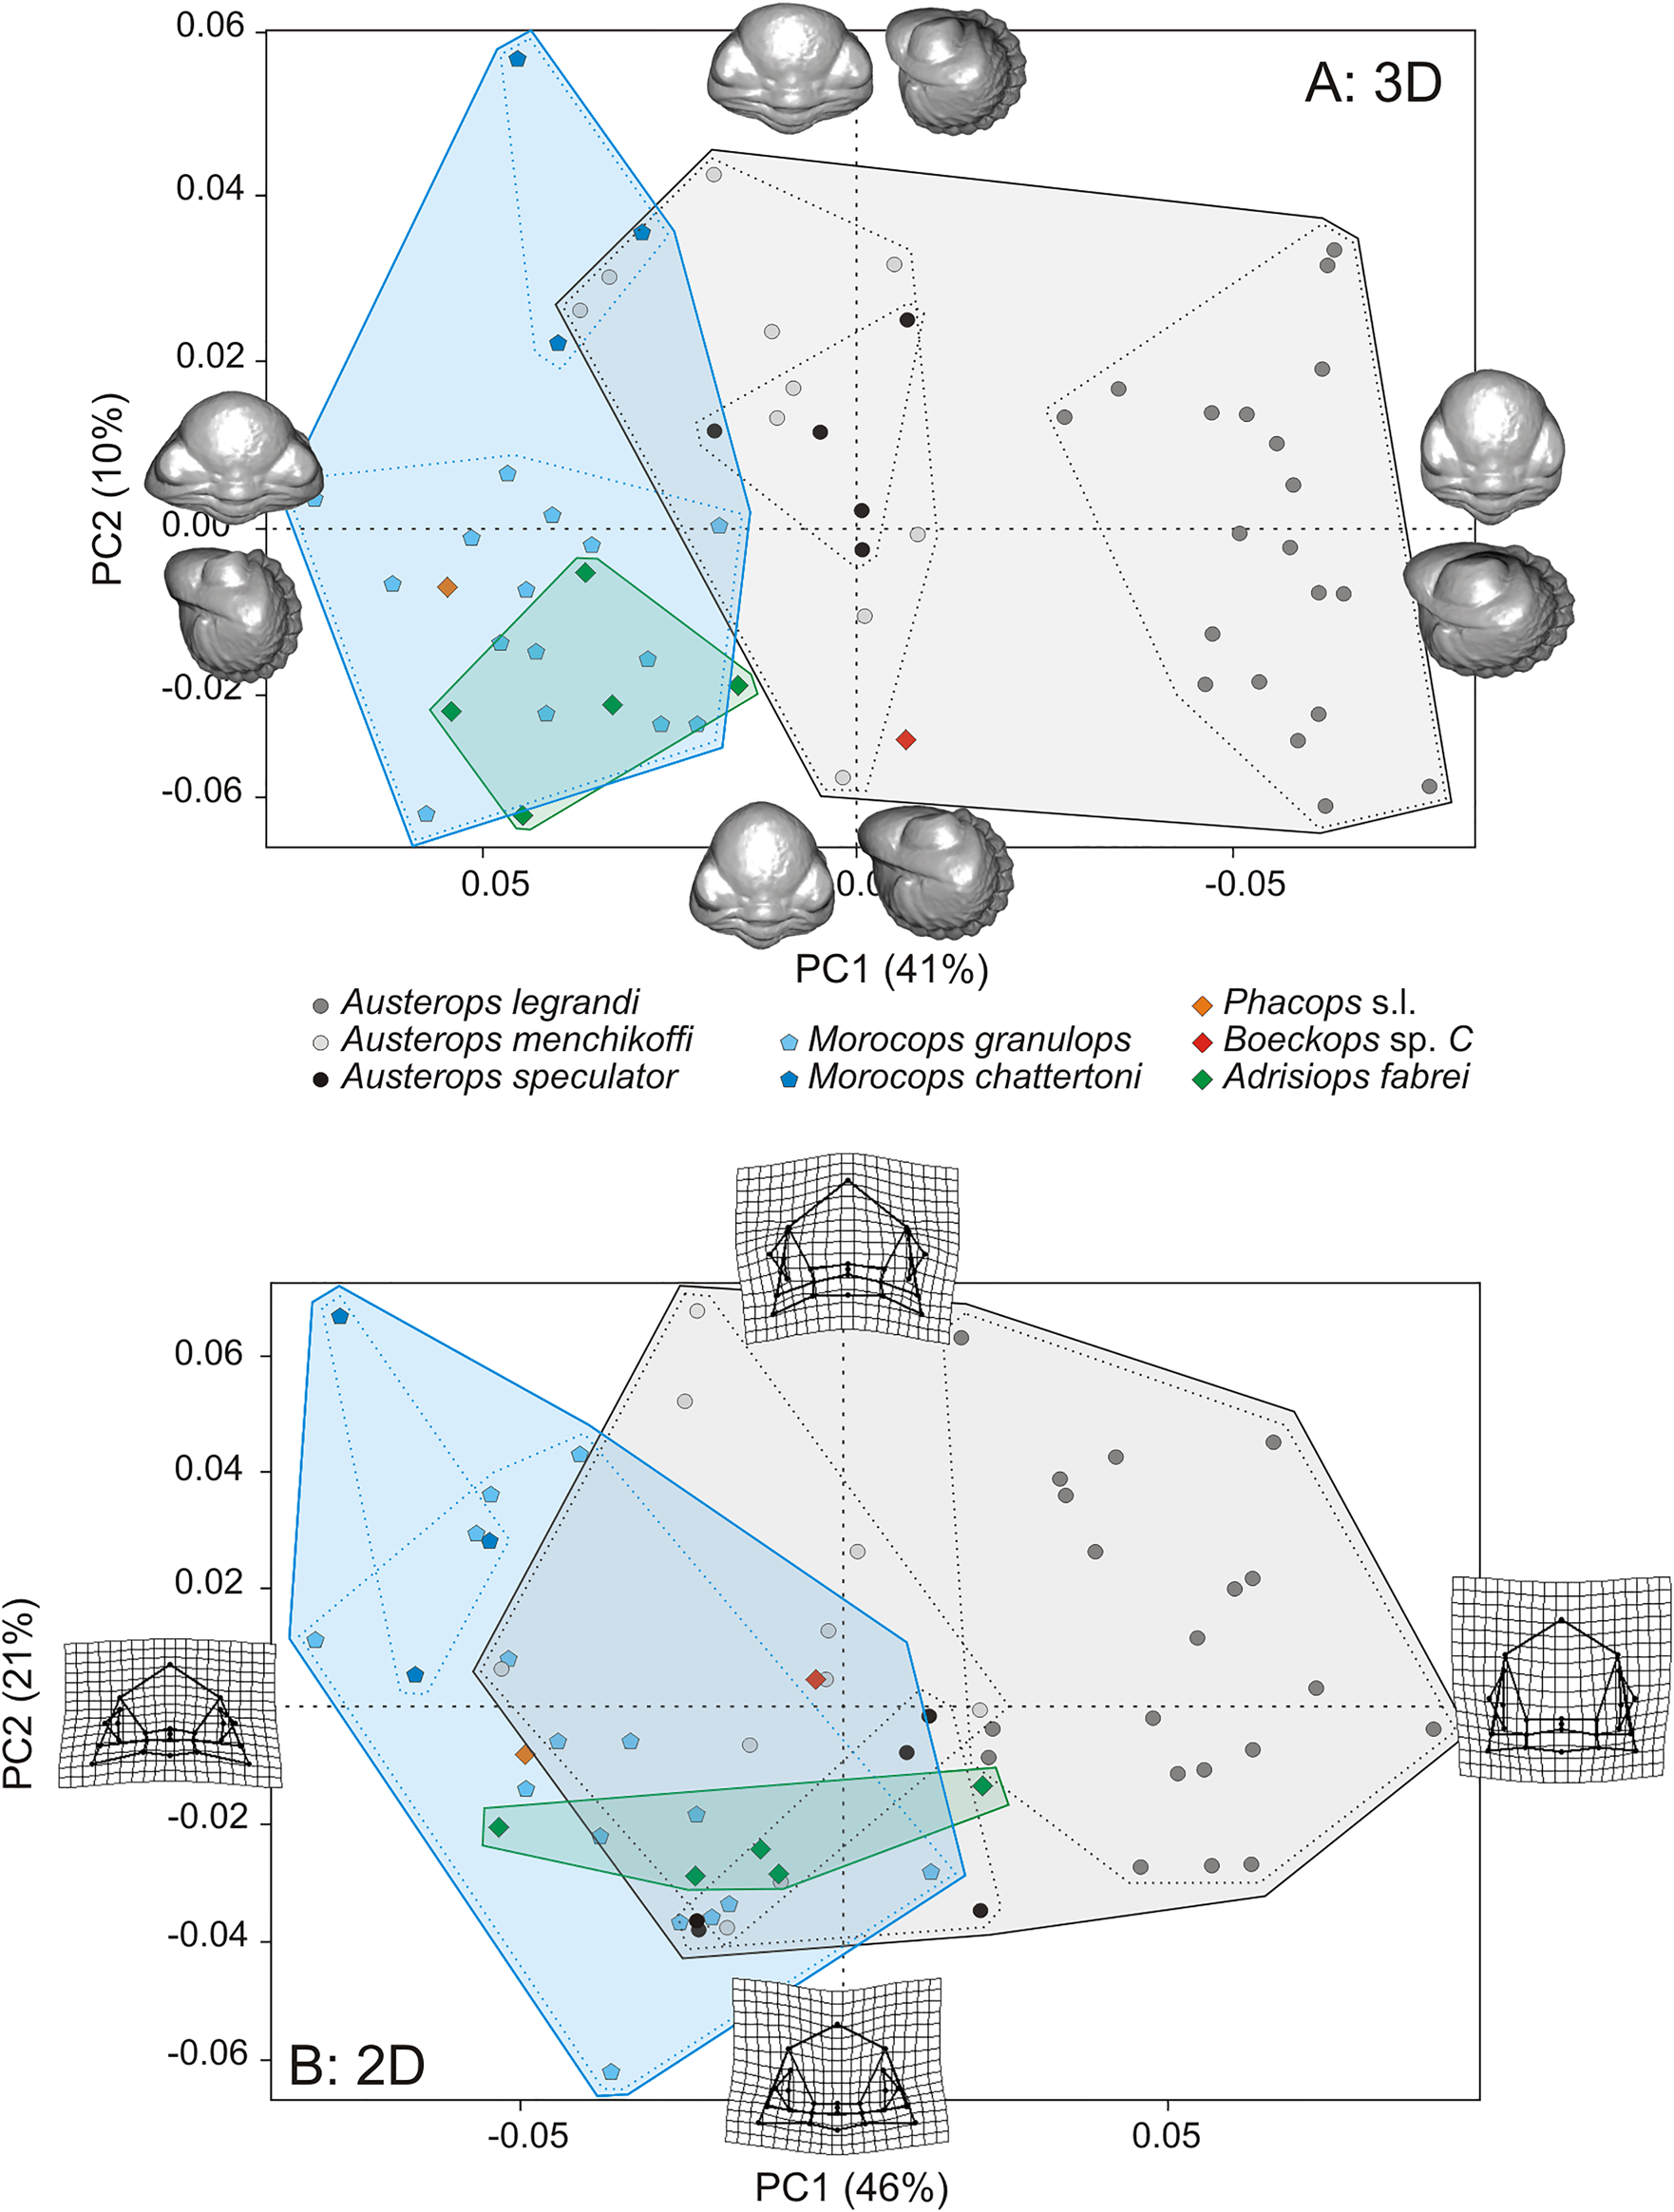
For cephala, morphological relationships among individuals can be displayed by their representation in the 3D and 2D shape spaces (Figs. 2, 3). The morphospaces depicted by the first three PC axes account for 59% (PC 1: 41%, PC 2: 10%, PC 3: 8%) and 76% (PC 1: 46%, PC 2: 21%, PC 3: 10%) of the total shape variation in 3D and 2D, respectively. The shape variation within those morphospaces seems mainly structured according to the individual taxonomy (especially for 3D data), where Austerops legrandi is the best-separated species, while other species overlap partially (Figs. 2, 3).
Ordination of 60 cephala in the morphospace defined according to the first two principal component (PC) axes after a generalized Procrustes analysis (GPA) in (A) 3D and (B) 2D. Axes PC 1 and PC 2 represent 41% and 10%, respectively, of the total variance in 3D; 46% and 21%, respectively, of the total variance in 2D. The 3D views or 2D thin plate spline (TPS) deformation grids used to depict patterns of shape change between the eight studied species.
Ordination of 60 cephala in the morphospace defined according to the first and third principal component (PC) axes after a generalized Procrustes analysis (GPA) in (A) 3D and (B) 2D. Axes PC 1 and PC 3 represent 41% and 8%, respectively, of the total variance in 3D; 46% and 10%, respectively, of the total variance in 2D. The 3D views or 2D thin plate spline (TPS) deformation grids used to depict patterns of shape change between the eight studied species.
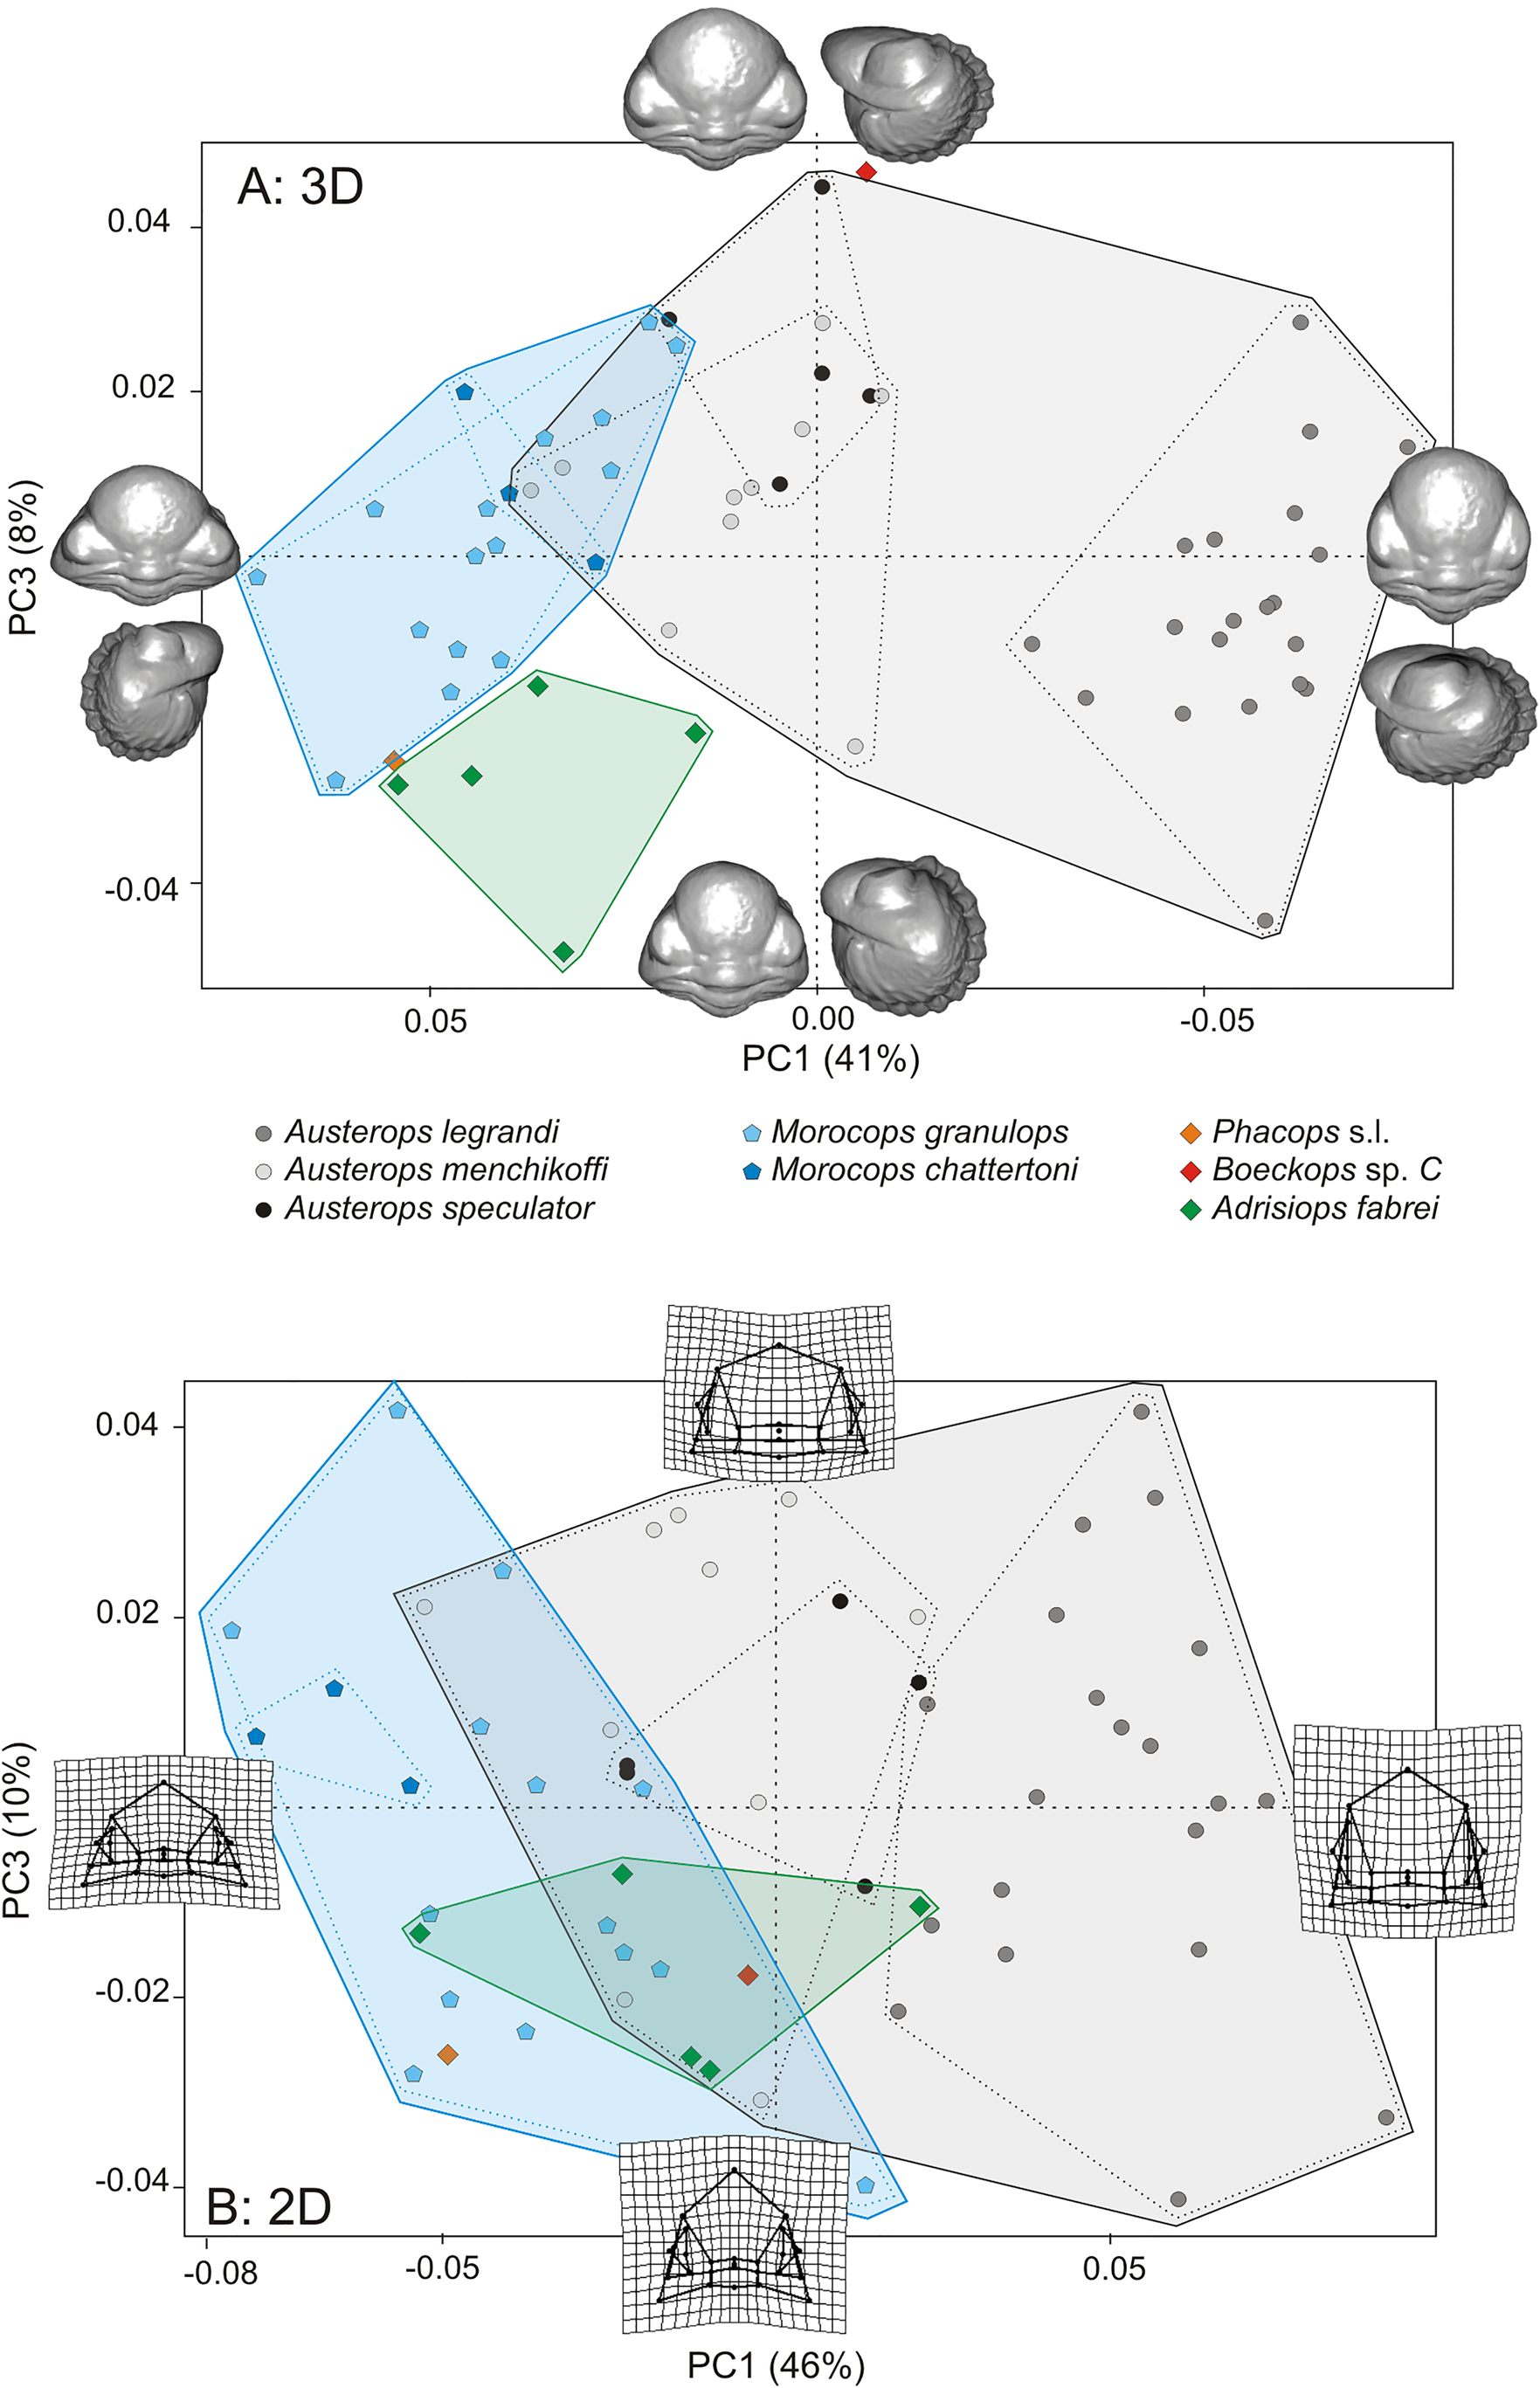
Concerning the 3D cephalon dataset, the main shape changes among individuals associated with each PC is depicted by 3D mesh (Figs. 2A, 3A) and landmark configurations with connecting lines (Supplementary Fig. A). The first PC axis shows that the main shape change in these species contrasts more or less large transversal (tr.) cephala (Fig. 2A) with more or less enlarged eye (enlarged eye for narrower cephala as seen in the lateral view; Supplementary Fig. A3, negative PC 1 scores). These traits are shown in A. legrandi (negative PC 1 scores) with a narrow (tr.) cephalon and enlarged eyes versus Morocops granulops (positive PC 1 scores) with a wide (tr.) cephalon. The PC 2 axis depicts more or less elongated sagittal (sag.) glabella, while the PC 3 axis depicts more or less inflated glabella and stretched genal angles dorsoventrally, as seen in the dorsal and lateral view (Fig. 2A, Supplementary Fig. A). Adrisiops is characterized by a wide (tr.) cephalon (positive PC 1 scores; Fig. 3A) and stretched genal angles (negative PC 3 scores; Fig. 3A).
Concerning the 2D cephalon dataset, the main shape changes among individuals associated with each PC is depicted by the TPS deformation grids (Figs. 2B, 3B). The first PC axis shows that the main shape change in these species contrasts more or less large cephala (with or without stretched genal angles). These traits are shown in A. legrandi (positive PC 1 scores) with a narrow (tr.) cephalon and without stretched genal angles versus M. granulops (negative PC 1 scores) with a wide (tr.) cephalon and stretched genal angles. The PC 2 axis depicts more or less inflated glabella (Fig. 2B), while the PC 3 axis depicts a more or less elongated glabella anteriorly (Fig. 3B).
For pygidia, morphological relationships among individuals can be displayed by their representation in the 3D and 2D morphological spaces (Figs. 4, 5). The morphospaces depicted by the first three PC axes account for 63% (PC 1: 27.5%, PC 2: 19.5%, PC 3: 16%) and 79.5% (PC 1: 39.5%, PC 2: 24.5%, PC 3: 15.5%) of the total shape variation in 3D and 2D, respectively. The shape variation within those morphospaces seems mainly structured according to the individual taxonomy but with overlap; primarily along the first axis for 3D data (Figs. 4A, 5A), and along the second axis for 2D data (Figs. 4B, 5B).
Ordination of 41 pygidia in the morphospace defined according to the first two (PC) axes after a generalized Procrustes analysis (GPA) in (A) 3D and (B) 2D. Axes PC 1 and PC 2 represent 27.5% and 19.5%, respectively, of the total variance in 3D; 39.5% and 24.5%, respectively, of the total variance in 2D. The 3D views and 2D thin plate spline (TPS) deformation grids used to depict patterns of shape change between the eight studied species.

Ordination of 41 pygidia in the morphospace defined according to (A) the first and third (PC) axes after a generalized Procrustes analysis (GPA) in 3D and (B) the second and the third in 2D. Axes PC 1 and PC 3 represent 27.5% and 16%, respectively, of the total variance in 3D; PC 2 and PC 3 represent 24.5% and 15.5%, respectively, of the total variance in 2D. The 3D views or 2D thin plate spline (TPS) deformation grids used to depict patterns of shape change between the eight studied species.

Concerning the 3D pygidium dataset, the main shape changes along individuals associated with each PC is depicted by 3D mesh (Figs. 4A, 5A) and landmark configurations with connecting lines (Supplementary Fig. B). The first PC axis shows that the main shape change in these species contrasts more or less large (tr.) and short (sag.) pygidial axes for a more or less elongated (tr.) pygidium (Fig. 4A). These traits are shown in Morocops (negative PC 1 scores) with a wide (tr.) pygidium versus Austerops (positive PC 1 scores) with a narrow (tr.) pygidium. The PC 2 axis depicts a more or less parabolic posterior outline (Fig. 4A), while the PC 3 axis depicts a more or less elongated (sag.) pygidial axis (Fig. 4A), as seen in the dorsal and lateral view (Supplementary Fig. B).
Concerning the 2D pygidium dataset, the main shape changes among individuals associated with each PC is depicted by the TPS deformation grids (Figs. 4B, 5B). The PC 1 axis shows that the main shape change in these species contrasts a more or less enlarged (tr.) pygidial axis anteriorly and elongated (sag.) pygidia with stretched posterolateral pygidial angles (Fig. 4B), while the PC 2 axis depicts more or less elongated (sag.) pygidia and its pygidial axis (with a more or less parabolic posterior outline). These traits are shown in Austerops (positive PC 2 scores) with an elongated (sag.) pygidium and a narrowly parabolic posterior outline versus Morocops (negative PC 2 scores) with a short (sag.) pygidium and a widely parabolic posterior outline. The PC 3 axis depicts more or less inflated pygidial axis only anteriorly (Fig. 5B).
Allometry–Size Effect: 2D versus 3D
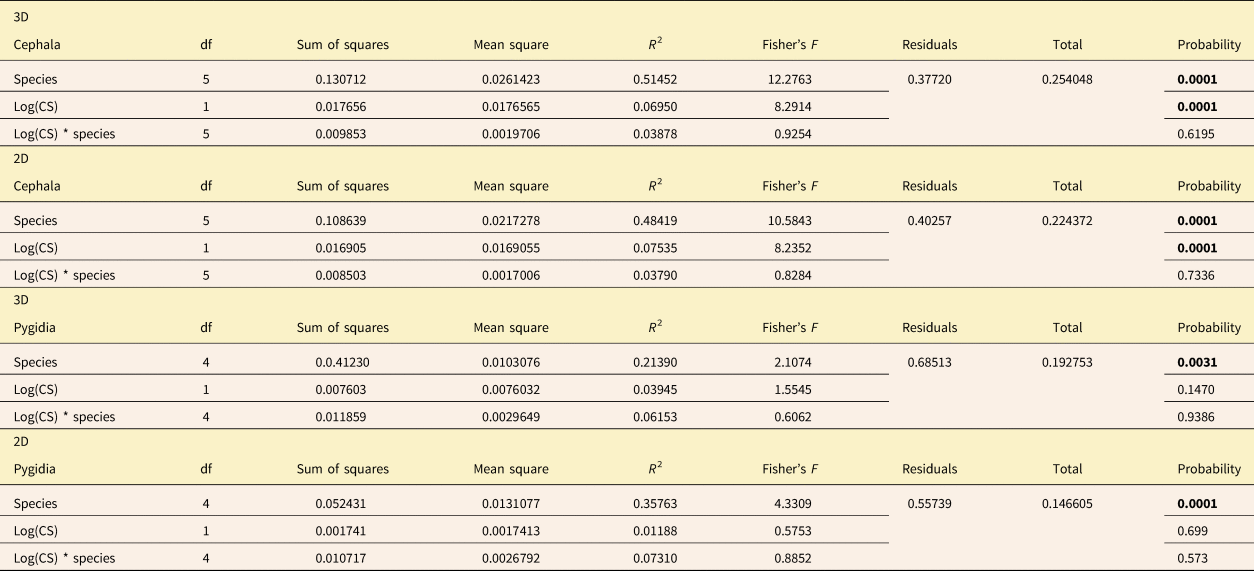
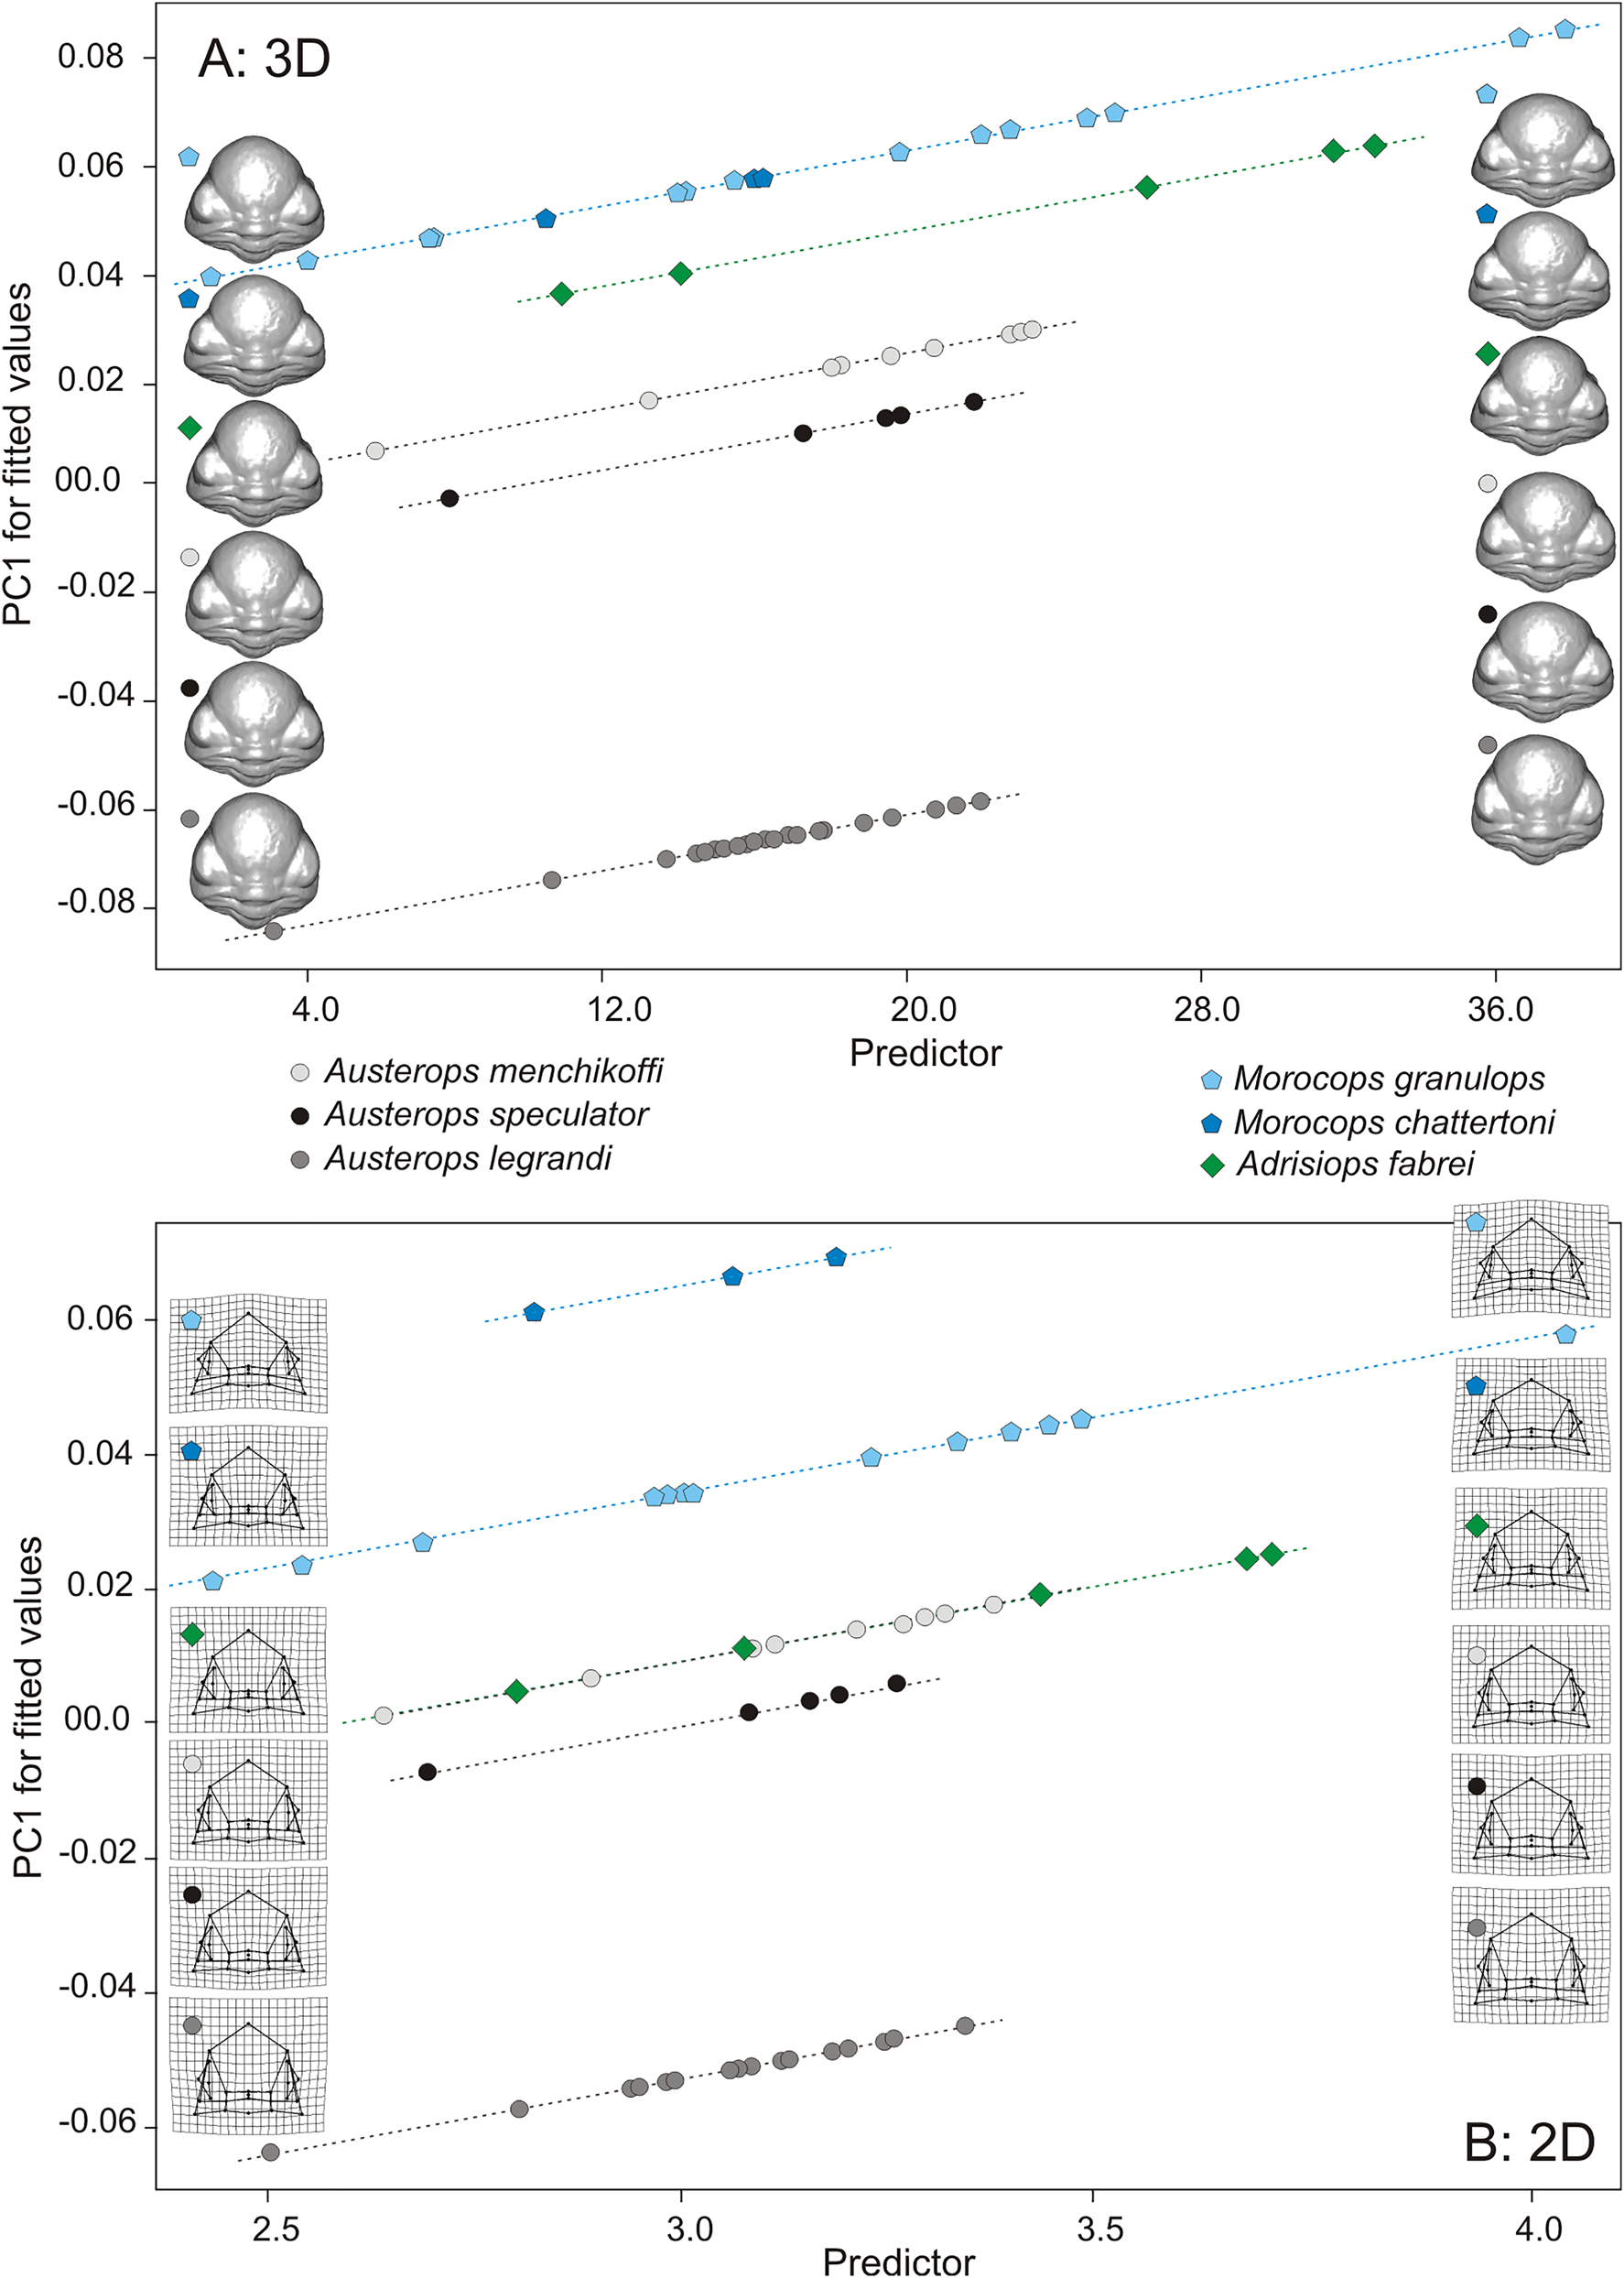
For cephala, Procrustes ANOVA showed a significant effect of species factor as well as log centroid sizes on 3D shape (tangent Procrustes coordinates), but without significant interaction between explanatory variables, suggesting similar slopes of allometric effects among species but with different mean shapes among them (Table 3). The signal is similar for cephalon 2D shapes (Table 3). The allometric shape variations among species is depicted by 3D mesh warping (Fig. 6A) and 2D TPS grids (Fig. 6B), showing that the glabellar length (sag.) decreases during growth, leading to wider cephala (Supplementary Fig. C). Moreover, this scatter plot of PC 1 for fitted values against the log-transformed centroid sizes shows that 95% CIs account for nearly 75% of fitted value variation (Supplementary Fig. E). Despite the small size, some pairwise mean shape comparisons are significant (Table 4), suggesting that at least one species, that is, A legrandi, differs from the other one considering cephala in 3D and 2D. Conversely, Austerops menchikoffi and Austerops speculator are very close morphologically both in 2D and 3D.
Results of Procrustes analysis of variance (ANOVA) performed on the tangent Procrustes coordinates according to log(CS) and species as factors, as well as their interaction, in 3D and 2D for cephala and pygidia. Significant p-values in bold.
Scatter plot of fitted principal component (PC) 1 scores (shape scores predicted by multivariate regression of shape on size) against predictor as the log-transformed centroid sizes showing allometric trajectories among six studied species for 60 cephala in (A) 3D and (B) 2D. Mesh warping (3D) and thin plate spline (TPS) deformation grids (2D) for the minimum (left) and maximum (right) shapes predicted from a multivariate Procrustes regression for each species having at least three individuals are presented to depict allometric shape variations.
Results of pairwise mean shape comparison: pairwise distances between means, testing log(CS) as covariate in 3D and 2D on cephala, testing species as covariate in 3D and 2D on pygidia. Significant p-values in bold.

For pygidia, Procrustes ANOVA showed only a significant effect of species factor on 3D shape, but without size effect and interaction between explanatory variables, suggesting only different mean shapes among them (Table 3). The signal is similar for pygidium 2D shapes (Table 3). The shape differences among species are depicted by 3D mesh warping, showing a more elongated pygidial axis in A. speculator than in Morocops chattertoni and a less curved posterior border in A. legrandi than in M. granulops (Supplementary Fig. D), and by 2D TPS grids (Supplementary Fig. D), showing that the pygidial axis in A. speculator or A. menchikoffi is narrower (transv.) than in A. legrandi and M. chattertoni (Supplementary Fig. D). The few significant pairwise mean shape comparisons from the allometric models concerned A. legrandi versus M. granulops and A. speculator versus M. chattertoni when considering pygidia in 3D (Table 4), and A. speculator or A. menchikoffi versus A. legrandi and M. chattertoni when considering pygidia in 2D (Table 4).
Phylomorphospace
The phylogenetic relationships between the six studied species as well as several outgroup taxa are illustrated in Figure 7A. For cephala, the phylogenetic tree plotted onto the morphospace was well structured, with Austerops clustered on one side and Morocops clustered on the other side in the phylomorphospace (Fig. 7B,C). The distribution of taxa in phylomorphospace in terms of divergence or convergence is rather similar between the two 3D and 2D datasets (Fig. 7B,C). Based on the 67% of variation (2D) or 51% (3D) described by PC 1 and PC 2, it appears that the taxa in the phylomorphospace of the 2D dataset are more evenly distributed than in the phylomorphospace of the 3D dataset (Fig. 7B,C). The Austerops genus showed the widest range of divergence in 2D especially. Within Austerops, the distribution of A. menchikoffi and A. speculator is much more clustered in the 3D phylomorphospace (as seen in the phylogenetic tree [Fig. 7A] and the morphospace [Fig. 4]), suggesting the existence of convergent evolution, and much more divergent along PC 2 of the 2D phylomorphospace (Fig. 7B,C). Austerops legrandi and M. chattertoni are the taxa with the most extreme values of PC 1 and are the same for both datasets (Fig. 7B,C). Austerops legrandi presented a more distinctive morphology and a possible outlier species within Austerops (Fig. 7B,C). For PC 2, if Austerops species are rather similar values in 3D, the taxa on the extreme ends of PC 2 differ between the datasets (Fig. 7B,C). From their ancestor node, Austerops species and Morocops species diverge in the same way along PC 1 and PC 2 in 2D based upon cephalic proportions (Fig. 7C), while Morocops species diverge along PC 2 and Austerops species diverge along PC 1, where Austerops speculator and A. menchikoffi are the most convergent species in 3D (Fig. 7B).
A, Phylogenetic relationships among six studied species and other ancestral taxa (modified from McKellar and Chatterton Reference McKellar and Chatterton2009; Oudot et al. Reference Oudot, Crônier, Neige and Holloway2018); nodes are indicated by small white circles. Location of the cephalic mean shape for six studied species (with numerous individuals) in the phylomorphospace defined according to the first two principal component (PC) axes after a generalized Procrustes analysis (GPA) in (B) 3D and (C) 2D. Shape change depicted by PC 1 axis of the 2D and 3D datasets as shown in Fig. 2.

In 3D, the phylogenetic signal contained in our shape data was significant (K mult = 0.891, p = 0.0225), contrary to the phylogenetic signal in the centroid size data (K mult = 1.145, p = 0.1271). In 2D, the phylogenetic signal was significant for neither shape nor size (shape data: K mult = 0.809, p = 0.1098; centroid size data: K mult = 0.380, p = 0.1279). The third dimension added sufficient statistical power needed to detect phylogenetic signal that was not detectable with 2D landmarks in this dataset.
For pygidia, as for cephala, the distribution of taxa in phylomorphospace in terms of divergence or convergence is rather similar between both 3D and 2D datasets, with similar maximum and minimum PC scores (Fig. 8A,B). Contrariwise for cephala, where A. menchikoffi and A. speculator are closely clustered, for pygidia, these two taxa are not so much clustered in the 3D phylomorphospace and much more divergent along PC 2 of the 2D phylomorphospace (Fig. 8A,B). Austerops speculator and M. chattertoni are the taxa with the most extreme values of PC 1 and are the same for both datasets (Fig. 8A,B) but differ between pygidia (Fig. 8A,B) and cephala (Fig. 7B,C). If the taxa on the extreme ends of PC 2 are almost the same between the datasets (i.e., A. menchikoffi or M. granulops vs. A. legrandi), they differ between pygidia (Fig. 8A,B) and cephala (Fig. 7B,C). Morocops were more conservative than Austerops and seem to be better defined according to their pygidia than their cephala (Figs 7, 8).
Location of the pygidial mean shape for five studied species (with several individuals) in the phylomorphospace defined according to the first two principal component (PC) axes after a generalized Procrustes analysis (GPA) in (A) 3D and (B) 2D. Shape change depicted by PC 1 axis of the 2D and 3D datasets as shown in Fig. 4.

For pygidia, in 3D as in 2D, we did not find evidence of phylogenetic constraints on morphospace occupation: the phylogenetic signal was significant for neither shape nor size (3D shape data: K mult = 0.810, p = 0.0592; 2D shape data: K mult = 0.810, p = 0.08575; 3D centroid size: K mult = 0.532, p = 0.57035; 2D centroid size: K mult = 0.456, p = 0.791). No significant phylogenetic correlation was detected with either 2D or 3D data in the pygidium.
Finally, to compare the 2D and 3D results, a plot of 2D and 3D partial Procrustes distances has been realized, as well as a plot of centroid sizes from 2D and 3D configurations (Supplementary Fig. F). The correlation between 2D and 3D centroid sizes gives r = 0.9781 for cephala and r = 0.9812 for pygidia. Moreover, the Mantel statistic based on Pearson's correlation shows between the two datasets for cephala a Mantel statistic r = 0.5836 for Euclidian distances and r = 0.5829 for Procrustes distances.
Discussion and Conclusions
A challenge in evolutionary biology is to determine whether different taxa or their morphological traits display similar phenotypic patterns (Goswami et al. Reference Goswami, Binder, Meachen and O'Keefe2015; Sherratt et al. Reference Sherratt, Serb and Adams2017). In trilobites, quantitative measurements have been used for the study of morphology for a very long time (Eldredge Reference Eldredge1972, Reference Eldredge1973). Quantitative measurements (e.g., linear distances or angles between anatomical landmarks, homologous landmarks) digitized on 2D pictures are usually used for such studies (Zelditch et al. Reference Zelditch, Bookstein and Lundrigan1992; Swiderski Reference Swiderski1993; Elewa Reference Elewa and Elewa2004). Nevertheless, while 2D quantitative analyses have advanced our understanding of the morphological relationships among trilobites (Smith and Lieberman Reference Smith and Lieberman1999; Kim et al. Reference Kim, Sheets, Haney and Mitchell2002; Crônier et al. Reference Crônier, Auffray and Courville2005, Reference Crônier, Budil, Fatka and Laibl2015), 3D quantitative analyses have recently received the most attention, although not in phacopid trilobites. Recent studies on other organisms reflect the great interest of comparing 2D and 3D geometric morphometric methods as well as the power of both methods. For instance, Andrialovanirina et al. (Reference Andrialovanirina, Caillault, Couette, Laffont, Poloni, Lutet-Toti and Mahé2023) demonstrate the precision and robustness of 3D methods to detect morphological variations undetected by 2D methods.
Because of the complex exoskeletal morphology of trilobites and their robust fossil record, the morphological disparity in 2D has been extensively documented in the Cambrian and the Ordovician (Foote Reference Foote1991; Smith and Lieberman Reference Smith and Lieberman1999; Webster Reference Webster2007; Hopkins Reference Hopkins2013; Jacobs and Carlucci Reference Jacobs and Carlucci2019). Contrariwise, Devonian studies are rare (Bault et al. Reference Bault, Crônier and Monnet2022b) and often dedicated to developmental and ontogenetic topics exploring the intrinsic factors of morphological changes (e.g., Crônier et al. Reference Crônier, Renaud, Feist and Auffray1998; Crônier Reference Crônier2013; Oudot et al. Reference Oudot, Neige, Laffont, Navarro, Khaldi and Crônier2019). Bault et al. (Reference Bault, Crônier and Monnet2022b) investigated the morphological evolution in Devonian trilobites from North Africa and showed the influence of some abiotic and biotic factors (bathymetry, feeding habits, and visual abilities) on their shape. Oudot et al. (Reference Oudot, Neige, Laffont, Navarro, Khaldi and Crônier2019) explored the full, integrated, and modular spaces of two developmental modules in phacopid trilobites, the cephalon and the pygidium, and highlighted some differences among them. In almost all cases, 2D landmarks were digitized from photographs of the dorsal view of the cephalon or pygidium. These studies assumed that 2D landmark configurations as source of morphometric data would be adequate for capturing the majority of the shape change of interest.
The morphological disparity in 3D remains rarely documented. By analyzing the unusual and highly convex shape of the cephalon of the Ordovician trilobite Cryptolithus, Hopkins and Pearson (Reference Hopkins and Pearson2016) showed that the cephalon continued to change in shape into adulthood and that a 2D approach fails to capture the dramatic change in convexity of the cephalon during development. Thus, while 2D approaches pose advantages such as rapid acquisition of images and low cost, 3D approaches performed using devices that are more sophisticated and therefore more expensive enhance the capture of morphological changes (Berssenbrugge et al. Reference Berssenbrugge, Berlin, Kebeck, Runte, Jung, Kleinheinz and Dirksen2014; Hopkins and Pearson Reference Hopkins and Pearson2016). However, as noticed by Cardini (Reference Cardini2014), using 2D images for studying morphological variation in 3D structures is an approximation that implies measurement error due to the “missing third dimension.” Moreover, the potential benefits and accuracy of quantitative measurements obtained from alternative methods is equivocal, neglected, and rarely demonstrated (Cardini Reference Cardini2014; Hopkins and Pearson Reference Hopkins and Pearson2016; Buser et al. Reference Buser, Sidlauskas and Summers2018; McWhinnie and Parsons Reference McWhinnie and Parsons2019; Cardini et al. Reference Cardini, de Jong and Butynski2022). This raises questions concerning all the measurements made so far in 2D on 3D biological objects, including trilobites, and the relevance of the obtained results. Such questions require comparative studies to ensure that the 2D data could discriminate enough and not miss too much biologically important shape change information.
To address this issue, our quantitative comparison involving 2D and 3D data shows similar patterns of morphological variability across taxa in 3D and 2D. Our results demonstrate both congruity and divergence between 2D and 3D data, but rather congruent results to discriminate taxa and rather divergent results to capture different levels of detail. The 3D and 2D datasets for cephala and pygidia show similar shape variation along PC axes. The set of individuals for cephala is grouped together according to their specific and generic attribution in the morphospaces mainly along the first axis, where Austerops legrandi is the best individualized species, while other species overlap partially (Figs. 2, 3). The set of individuals for pygidia is partially grouped together according to their specific and generic attribution in the morphospaces mainly along the first axis, with overlap (Figs. 4, 5). Moreover, our results demonstrate congruity between 2D and 3D datasets for allometric patterns. Considering only cephala in 2D and 3D, our results show similar slopes of allometric patterns among species but with different mean shapes among them. The relative glabellar length decreases during growth, leading to wider cephala in the studied taxa. Likewise, the pairwise mean shape comparisons from the allometric models show congruity between 2D and 3D datasets. For cephala, A. legrandi is very different morphologically, and conversely, Austerops menchikoffi and A. speculator are very close morphologically. In the same way, the signals are congruent considering only pygidia in 2D and 3D. However, these signals obtained on the one hand on cephala and on the other hand on pygidia indicate different relative preferences between species, suggesting a possible differentiation in the development of these distinct fused tagmata in our studied taxa.
Our results indicate that 2D landmarks digitized from photographs of the dorsal view of the cephalon or pygidium serve as a reasonably good proxy for 3D shape. Nonetheless, although, the x and y components of shape seem to be adequate to describe taxa and to determine their variability, an approach including the third dimension of shape (i.e., 3D) appears to be more precise, especially for organisms with high variation in their lateral view. The difference in the location of taxa, especially along PC 3 for cephala, could likewise result from the absence of the z-axis in the 2D dataset, as the shape variation appears quite consistent between the two datasets in the x and y plane, and much of the shape differentiation in the 3D dataset occurs along the z-axis (corresponding to the vector orthogonal to the x and y plane of the 2D digital photographs). This is how Adrisiops fabrei is well and better individualized in 3D than in 2D along the PC 3 axis for its cephala (Fig. 3). Thus, the 3D approach enhances the capture of morphological changes for an additional dimension in this particular taxa.
An approach including the third dimension might be necessary not only for phacopid trilobites but also for some trilobite groups with high convexity. For instance, 3D is maybe more appropriate for some species of the Ordovician trilobite Neseuretus Hicks, Reference Hicks1873 erected according to the height of the glabella (Sadler Reference Sadler1974; Text-Fig. 6) or for some other Ordovician or Silurian genera belonging to the Cheirurinae Hawle and Corda, Reference Hawle and Corda1847 and Deiphoninae Raymond, Reference Raymond and Eastman1913 families characterized by a strong inflation of their glabellae (Přibyl et al. Reference Přibyl, Vaněk and Pek1985).
Our quantification of the cephalic and pygidial shapes supports taxonomically relevant variation of other diagnostic characters found in the studied taxa (Khaldi et al. Reference Khaldi, Crônier, Hainaut, Abbache and Ouali Mehadji2016), such as the number of lens files per eye, the number of lenses per file, the presence/absence of a subocular pad, or the ornamentation. As demonstrated by Oudot et al. (Reference Oudot, Neige, Laffont, Navarro, Khaldi and Crônier2019) and confirmed also in our 3D versus 2D results, A. legrandi is characterized by an original cephalic shape in comparison to other species. According to its diagnostic characters (Khaldi et al. Reference Khaldi, Crônier, Hainaut, Abbache and Ouali Mehadji2016), Austerops legrandi has a very narrow cephalon, a depressed glabella with a very wide base, and a short (tr.) occipital ring, which differentiates it from other studied representatives of Austerops. In lateral view, Austerops legrandi has a rather short, ridge-like anterior border, projecting forward slightly and sloping posteroventrally, while A. fabrei has an anterior border along with a forward ridge-like projection.
Moreover, the three studied genera with enough individuals, that is, Austerops, Morocops, and Adrisiops, are significantly different from each other despite some overlap and clearly represent three differentiated genera in the cephalon morphoshape in 3D (Fig. 3A). In contrast, Morocops and Adrisiops do not differ from each other in the cephalon morphoshape in 2D (Fig. 3B). Such results demonstrate that the third dimension is very important to a generic assignation according to cephalic pieces that represent diagnostic features.
In the pygidium morphospace, the amount of overlap between genera and also between species appears higher than in the cephalon morphospace. While Austerops and Morocops are significantly different from each other despite some overlap and clearly represent two genera in the 3D dataset, such a significant difference is not present in the 2D dataset. Such results demonstrate that the pygidia are less important for a generic assignation than the cephala and suggest that these cephalic pieces also gather a greater intergeneric shape divergence as they concentrate numerous vital functions, that is, facial sutures for molting and growth, eyes as sensory organs, mouthparts, and a glabella occupied by the anterior digestive system (Fortey and Owens Reference Fortey and Owens1999; Hughes Reference Hughes2003).
An important consideration for understanding dynamic evolution in organisms is to understand the contribution of both evolutionary convergence and divergence to morphospace patterning in a phylogenetic framework (Sidlauskas Reference Sidlauskas2008; Sakamoto and Ruta Reference Sakamoto and Ruta2012; Kimmel et al. Reference Kimmel, Small and Knope2017; Santos et al. Reference Santos, Perrard and Brady2019; Gómez et al. Reference Gómez, Gonzáles-Megías, Narbona, Navarro, Perfectti and Armas2021). Resolving the patterns of phenotypic change within the context of the phylogeny provides insights into the evolutionary history. Our analysis includes the studied taxa in a single cladistic matrix (modified from Oudot et al. Reference Oudot, Crônier, Neige and Holloway2018) and offers a preliminary numerical test of phylogenetic hypotheses. Using two genera (i.e., Austerops vs. Morocops) as sister clades makes a suitable prospect to test hypotheses of morphological diversification. The phylomorphospaces show that the tree branches do not cross each other, which may suggest possible phylogenetic constraints on morphospace occupation for each species; and there is only a phylogenetic effect on shape in 3D for cephala. Our results support the idea that the Austerops group and the Morocops group are sister clades that experienced different modes of morphological evolution. The members of the Morocops group are distributed according to an evolutionary change of nearly equal magnitude across a moderate area of morphospace, when considering cephala or pygidia in 2D and 3D. By contrast, the members of the Austerops group seem to explore a much greater area of morphospace in 2D, and a more restricted area in 3D (also demonstrated by the sum of variances [SoV] and the sum of ranges [SoR] in these two clades on PC 1 and PC 2 on cephala: SoV = 0.001792121 for Austerops in 2D > SoV = 0.001521231 for Austerops in 3D; SoV = 0.001618249 for Morocops in 2D > SoV = 0.0006598642 for Morocops in 3D; SoR = 0.2360655 for Austerops in 2D > SoR = 0.1777445 for Austerops in 3D; SoR = 0.2237643 for Morocops in 2D > SoR = 0.1447904 for Morocops in 3D). This difference between 2D and 3D phylomorphospaces leads us to suggest the existence of evolutionary constraints more noticeable in 3D or the diversity in Morocops is somewhat lost when looking at just 2D, due to the height of the studied structures, that is, the third dimension. These results raise a question as to the underlying causes for the constrained morphological diversification within these groups. The recognition of causal mechanisms remains a challenge in macroevolution. Potential mechanisms include developmental or functional constraints (Oudot et al. Reference Oudot, Neige, Laffont, Navarro, Khaldi and Crônier2019) or environmental controls (Sundberg Reference Sundberg1996; Crônier and Courville Reference Crônier and Courville2003) over the distribution of morphologies. Bault et al. (Reference Bault, Crônier and Monnet2022b) investigated how the morphological shape in Devonian trilobites may be linked to different paleoenvironmental and/or paleoecological factors. They demonstrated that the trilobite orders that survived Devonian events had a wide morphological spectrum, occupying the global morphospace, and were better adapted to withstand environmental change, although some areas of morphospace remained empty because some morphologies did not develop during this Devonian time slice. Such empty areas were demonstrated theoretically by Erwin (Reference Erwin2007), who suggested that areas in the morphospace not visited by taxa may correspond to impossible phenotypes. Moreover, while Yoder et al. (Reference Yoder, Clancey, Des Roches, Eastman, Gentry, Godsoe and Hagey2010) and Maia et al. (Reference Maia, Rubenstein and Shawkey2013) showed functional innovations generate bursts in morphological diversification, several other studies failed to find such a relationship (e.g., Slater et al. Reference Slater, Price, Santini and Alfaro2010; Dornburg et al. Reference Dornburg, Sidlauskas, Santini, Sorenson, Near and Alfaro2011) as a consequence of new ecological opportunities or reaching functional limits in morphospace (Dornburg et al. Reference Dornburg, Sidlauskas, Santini, Sorenson, Near and Alfaro2011). As our studied sample was small, leading to limitations, our results should be considered with caution.
Although we recognize the limits of results obtained with a sample of five species, two of which having a small number of individuals, our comparisons between species nonetheless provide new perspectives of study that could encourage us to gather more data.
In conclusion, throughout phacopid evolution, our study demonstrates the effectiveness of morphological descriptors in morphometric analyses in 2D and 3D. Phacopids have experienced changes in morphological construction, exhibiting rather congruent divergences and convergences between taxa for both 2D and 3D datasets, but differing between cephala and pygidia. The 2D method of quantifying dorsal morphology remains one of the easiest, least expensive (compared with a structured-light 3D scanner), useful tools, and less time-consuming in shape studies, that can still be used, especially when assessing or evaluating dorsal dimensions. However, if the 3D method is better in terms of accuracy and additional depth (third dimension), the 2D method could be enhanced by using the lateral view to achieve this third dimension, especially for organisms with a greater depth of field.
Acknowledgments
Our work benefited from the language corrections provided by J. Puzey (U.K.) and from help for a few lines of R codes provided by C. Monnet (UMR CNRS 6282, France). The authors also thank the editor and the reviewers A. Cardini, D. Polly, J. Esteve, and M. Hopkins, who greatly improved this work and the English writing. The authors warmly thank the Gismo platform and its staff (Biogéosciences, University Bourgogne, UMR CNRS 6282, France), which manages and maintains the analytical equipment used in this study.
Competing Interest
The authors declare no competing interests.
Data Availability Statement
Data available from the Zenodo Digital Repository (All Supplementary Material): https://doi.org/10.5281/zenodo.13348472.



