Implications
The muscle-to-meat transition is a complex process, characterised by pH decrease and accompanied changes within the muscle tissue. Mitochondria are important organelles that influence the energy metabolism and might therefore have an impact on the muscle-to-meat conversion. The aim of the present study was to elucidate if postmortem pig longissimus muscles with differing pH values not only vary with regard to meat quality, but also the structure and mitochondrial respiratory activity of the muscle tissue.
Introduction
Mitochondria are involved in the muscular energy production under normal oxygen supply (normoxia) and also to a less extent in postmortem muscle when oxygen concentration dramatically decreases in muscle (hypoxia/anoxia). The mitochondria content of muscle tissue is mainly related to the muscle fibre composition. Muscles with high percentages of fast-twitch glycolytic (FTG) muscle fibres have lower mitochondria contents than muscles with high percentage of slow-twitch oxidative (STO) fibres. In the latter, energy is generated more aerobically owing to the higher mitochondria and myoglobin content in contrast to the FTG fibres with more anaerobic ATP production through glycolysis (Lefaucheur, Reference Lefaucheur2010). It is known that the pH 45 min p.m. of meat is influenced by the muscle fibre composition with lower values in muscles with higher FTG percentages (Ryu and Kim, Reference Ryu and Kim2005). However, it is not clear if differences in mitochondrial content per se and/or intrinsic mitochondrial respiratory activity (MRA) have an impact on the pH values or vice versa. Therefore, in the present study fast- (FG) and normal glycolysing (NG) longissimus muscles (LMs) were analysed not only with regard to meat quality parameters, but also to muscle structure and MRAs.
Material and methods
Animals and sample collections
In the experimental abattoir of the Department of Animal Sciences in Goettingen, 48 pigs (24 barrows, 24 gilts) of a commercial crossbreed (Piétrain×German Landrace, malignant hyperthermia syndrome (MHS) homozygote negative) were slaughtered at eight slaughter dates. Directly after stunning (250 V, 1.3 A, 6 s) and exsanguination, the carcasses were scalded at 62ºC for 3 min. The carcasses were eviscerated within 30 min p.m. and then immediately transferred to a chilling room at 7ºC. The pH and temperature values were determined 45 min after stunning (45 min p.m.) between the 13th and the 14th thoracic vertebrae (Th) in the LM.
Then a sample was removed from the centre of the muscle at the same location and prepared for analysis of the MRA and muscle structure. The first samples were stored in ice cold storage buffer containing 15 mM phosphocreatine, 49 mM potassium morpholino–ethanesulfonic acid, 20 mM taurine, 20 mM imidazol, 5.2 mM ATP, 9.5 mM MgCl2, 3 mM KH2PO4 and 0.5 mM dithiothreitol. The pH of the solution was 7.1. Samples for muscle structure analysis were taken from the Th 45 min muscle samples (1×1×1 cm) and quickly frozen in liquid nitrogen.
The carcasses were chilled at 7ºC for 6 h followed by the removal of the right LM between 12th and 15th Th. The meat piece was individually packed and stored at 4ºC until next day. At 24 h p.m., a 2.5 cm thick meat slice was cut from the collected meat piece between 13th and 14th Th. After determination of the pH, electrical conductivity (EC) and colour values on the cutting surface, the meat slice was further used for analysis of drip and grill losses as well as shear force as described below.
Methods
The pH (pH Star; Matthäus GmbH, Poettmes, Germany), EC (LF Star; Matthäus, Germany) and meat temperature (Testo AG, Lenzkirch, Germany) values of the LM were determined at 45 min (pH, temperature) and 24 h after slaughter (pH, EC). For analysis of lightness (L*), redness (a*) and yellowness (b*) meat slices – collected 24 h after slaughter – were trimmed of fat and connective tissue. After blooming for 15 min, the L*a*b* values of the muscle samples were determined with a chromameter (CR 400; Konica-Minolta GmbH, Langenhagen, Germany) according to the procedure by Janisch et al. (Reference Janisch, Wicke and Krischek2012). After colour determination the meat slices were weighed (174±46 g), placed in a container equipped with a plastic bag and a lid and stored at 4ºC. At 72 h postmortem, the sample was reweighed and the drip loss was calculated as the weight loss percentage (Bertram et al., Reference Bertram, Schafer, Rosenvold and Andersen2004). The drip loss samples were subsequently used for the analysis of the grill loss and the shear force. The samples were not frozen in between. The grill loss was determined as described by Werner et al. (Reference Werner, Natter, Schellander and Wicke2010a). The grill loss was calculated as the loss of weight during the heating process relative to the initial weight and expressed in percentage. The samples prepared for the determination of the grill loss were subsequently used for the Warner-Bratzler shear force analysis according to Werner et al. (Reference Werner, Natter, Schellander and Wicke2010a). For histological analysis, cryofixed muscle samples were cut, after identifying the fibre direction, into 12 µm thick slices using a cryo-microtome (Cryocut CM 1900; Leica GmbH, Nussloch, Germany). The histological sections were stained according to the procedure by Werner et al. (Reference Werner, Natter, Schellander and Wicke2010a). After this the slices were investigated with a stereo microscope (Nikon GmbH, Duesseldorf, Germany) at a low magnification (4×) and at least three sections were transferred through a digital camera to a personal computer. For the calculation of the percentage of the STO, fast-twitch oxidative (FTO) and FTG fibres, all the sections were analysed. For the investigation of the cross-sectional areas (CSA), at least 200 muscle fibres were circumscribed and semi-automatically analysed using LUCIA software (Nikon GmbH, Duesseldorf, Germany).
MRA analysis was performed on permeabilised fibres as described by Werner et al. (Reference Werner, Natter, Schellander and Wicke2010a). The weight-specific state-3-respiration with the substrates pyruvate/malate (Pyr/Mal) and succinate/rotenone (Succ/Rot) and the state-4-respiration with oligomycin (pmol O2/min×mg sample weight) was calculated as the time derivative of the oxygen concentration using the software Datlab 4.1 (Oroboros Instruments Corp., Innsbruck, Austria). Each value was a repeat of at least two different experiments.
Chemicals
All chemicals were purchased from Sigma-Aldrich GmbH (Taufkirchen, Germany), unless otherwise indicated.
Statistical analysis
The samples were separated into FG and NG groups considering a pH 45 min p.m. of 6.0 as the limit between both classes (Josell et al., Reference Josell, von Seth and Tornberg2003). The data were analysed with the software Statistica 10.1 (StatSoft GmbH, Hamburg, Germany). After analysis of normality with the Shapiro–Wilks test, normal distributed data were analysed using the ANOVA with pH group as main effect and slaughter day, gender and STO/FTG percentages (only for MRA results) as covariables. The gender influenced the temperature, grill loss and the slaughter day, the L*, as well as drip and grill loss results. No impact of the covariables, especially the STO- and FTG percentages, on the MRA results could be found. All non-normally distributed results (EC, b*, drip loss, CSA of FTO and STO fibres) were analysed with the Mann–Whitney U test. A P-value<0.05 was considered as significant.
Results and discussion
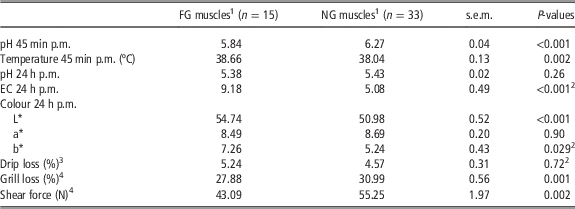
The meat of the FG group had significantly (P<0.05) higher EC 24 h p.m. and L* 24 h p.m. values and lower pH 45 min p.m., grill loss and shear force results compared with pig meat of the NG group. The temperature, analysed 45 min p.m., was higher (P<0.05) in the FG meat. However, no influence of the pH group on the pH 24 h p.m., drip loss and redness values was found (Table 1).
Effects of the rate of pH decline in the porcine longissimus muscles on different meat quality parameters

a*=redness; b*=yellowness; EC=electrical conductivity in mS/cm; FG=fast glycolysing; L*=lightness; NG=normal glycolysing.
1 FG muscles had a pH 45 min p.m.<6.0, whereas NG muscles had a pH>6.0.
2 These data were non-normally distributed and were analysed with the Mann–Whitney U test.
3 Drip loss determined between 24 and 72 h after slaughter.
4 Grill loss and shear force analyses were performed at 72 h p.m. using the drip loss samples.
P-values<0.05 were considered significant.
The higher meat temperature in the FG group agrees with data of Fernandez et al. (Reference Fernandez, Neyraud, Astruc and Sante2002), Copenhafer et al. (Reference Copenhafer, Richert, Schinckel, Grant and Gerrard2006) and Werner et al. (Reference Werner, Natter, Schellander and Wicke2010a) and could be related to the accelerated rate of biochemical changes like rapid glycolysis or muscle contraction in these muscles (Scheffler and Gerrard, Reference Scheffler and Gerrard2007).
Considering the high proportion of pigs in the FG group (n=15) and the overall low average pH 45 min p.m. value (6.14±0.04) of all pigs in comparison with previous studies (Josell et al., Reference Josell, von Seth and Tornberg2003; Werner et al., Reference Werner, Natter, Schellander and Wicke2010a), it could be suggested that the pigs were exposed to a certain stress before slaughter accompanied with initially higher lactic acidosis.
The relation between low pH 45 min p.m. values and meat conductivity was also shown by Schubert-Schoppmeyer et al. (Reference Schubert-Schoppmeyer, Fiedler, Nurnberg, Jonas, Ender, Maak and Rehfeldt2008) and Werner et al. (Reference Werner, Natter, Schellander and Wicke2010a). The faster pH decrease in the low pH group results in pronounced shrinkage and denaturation of the myofibrillar proteins accompanied with accelerated release of water and electrolytes (Scheffler and Gerrard, Reference Scheffler and Gerrard2007). This causes higher conductivity values of the low pH meat (Sielaff and Hoft, Reference Sielaff and Hoft1979).
Monin and Sellier (Reference Monin and Sellier1985), Cheah et al. (Reference Cheah, Cheah and Just1998), Fernandez et al. (Reference Fernandez, Neyraud, Astruc and Sante2002), Gil et al. (Reference Gil, Oliver, Gispert, Diestre, Sosnicki, Lacoste and Carrion2003) and Copenhafer et al. (Reference Copenhafer, Richert, Schinckel, Grant and Gerrard2006) also found, despite clear pH differences 45 min p.m., no impact of the rate of pH decline on the pH 24 h p.m. results. However, other studies, investigating MHS positive and negative pigs, presented lower pH 24 h p.m. values in LMs with low pH 45 min p.m. results (Hamilton et al., Reference Hamilton, Miller, Ellis, McKeith and Wilson2003; Werner et al., Reference Werner, Natter, Schellander and Wicke2010a; Zelechowska et al., Reference Zelechowska, Przybylski, Jaworska and Sante-Lhoutellier2012). The contrary results are difficult to explain. The extent of pH reduction is a complex process and is influenced by lactate production during anaerobic glycolysis related to factors like glycolytic potential or glycolytic enzyme activities (Monin and Sellier, Reference Monin and Sellier1985; Werner et al., Reference Werner, Natter and Wicke2010b; Scheffler et al., Reference Scheffler, Scheffler, Kasten, Sosnicki and Gerrard2013), or by factors like residual aerobic energy production shortly after slaughter or the H+ buffering capacity of the muscle fibres (Abe, Reference Abe2000; Werner et al., Reference Werner, Natter, Schellander and Wicke2010a).
The presented pH effects on the lightness values agree with results of Copenhafer et al. (Reference Copenhafer, Richert, Schinckel, Grant and Gerrard2006) and Werner et al. (Reference Werner, Natter, Schellander and Wicke2010a). The higher reflectance in the low pH group could be related to the higher myofibrillar refraction owing to the pronounced shrinkage of the myosin and actin and to the precipitation of sarcoplasmic proteins (Swatland, Reference Swatland2003; Choe et al., Reference Choe, Choi, Lee, Shin, Ryu, Hong and Kim2008).
Considering the presented drip loss results, Schubert-Schoppmeyer et al. (Reference Schubert-Schoppmeyer, Fiedler, Nurnberg, Jonas, Ender, Maak and Rehfeldt2008) and Zelechowska et al. (Reference Zelechowska, Przybylski, Jaworska and Sante-Lhoutellier2012) also found no impact of lower pH 45 min p.m. values on the drip loss values. In contrast to this, in other studies low pH 45 min p.m. values of pork were accompanied with higher drip loss results, especially if MHS pig genotypes were investigated (Fernandez et al., Reference Fernandez, Neyraud, Astruc and Sante2002; Gil et al., Reference Gil, Oliver, Gispert, Diestre, Sosnicki, Lacoste and Carrion2003; Copenhafer et al., Reference Copenhafer, Richert, Schinckel, Grant and Gerrard2006; Werner et al., Reference Werner, Natter, Schellander and Wicke2010a). Gil et al. (Reference Gil, Oliver, Gispert, Diestre, Sosnicki, Lacoste and Carrion2003) and Choi et al. (Reference Choi, Jung, Choe and Kim2012) additionally presented significantly different drip loss values of pork with similar pH 45 min p.m. results. The inconsistency of these results is quite difficult to explain, but might be principally related to factors like different pig genetic, analytical methods or limit for pH sorting of the meat. It has been described that faster pH reduction affects the water holding capacity (WHC) by increasing shrinkage and denaturation of the myofibrillar proteins (Scheffler and Gerrard, Reference Scheffler and Gerrard2007). However, considering the different publications, these alterations did not generally result in significant drip loss differences. For example, the drip loss values of low and normal pH 45 min p.m. pork in the present study or the studies of Schubert-Schoppmeyer et al. (Reference Schubert-Schoppmeyer, Fiedler, Nurnberg, Jonas, Ender, Maak and Rehfeldt2008) and Zelechowska et al. (Reference Zelechowska, Przybylski, Jaworska and Sante-Lhoutellier2012) only showed a difference of 0.67%, 1.03%, 1.02%, respectively (P>0.05), in comparison with Gil et al. (Reference Gil, Oliver, Gispert, Diestre, Sosnicki, Lacoste and Carrion2003), Copenhafer et al. (Reference Copenhafer, Richert, Schinckel, Grant and Gerrard2006) and Werner et al. (Reference Werner, Natter, Schellander and Wicke2010a) (1.5%, 4.8%, 3.3%, respectively, P<0.05). Further investigations are necessary to clarify the relation between rate of pH decline and WHC/drip loss.
The presented effect of the pH group on the grill loss results agrees with a study by Virgili et al. (Reference Virgili, Degni, Schivazappa, Faeti, Poletti, Marchetto, Pacchioli and Mordenti2003). In contrast to this, Choi et al. (Reference Choi, Jung, Choe and Kim2012) found differing cooking losses in LMs with comparable pH 45 min p.m., whereas Werner et al. (Reference Werner, Natter, Schellander and Wicke2010a) found comparable grill losses in muscles with varying pH 45 min p.m. Band et al. (Reference Band, Guimaraes, Lopes, Schierholt, Silva, Pires, Benevenuto and Gomide2005) or Boler et al. (Reference Boler, Dilger, Bidner, Carr, Eggert, Day, Ellis, McKeith and Killefer2010) presented opposite results with higher cooking loss values in low pH 45 min p.m. pork. Cooking loss as well as drip loss are parameters to characterise the WHC of the tissue. Therefore, both parameters should be considered to understand the relation between pH 45 min p.m. and the grill/cooking loss and drip loss results. Considering the present results, it could be suggested that the liquid expelling from the meat during drip loss analysis reduces the liquid loss during subsequent grilling. Correlation analysis showed a negative correlation (R=−0.41) between drip and grill loss considering all data. However, additional investigations are necessary to clarify the discrepancies.
The reduced shear force values in the FG group agree with investigations of Copenhafer et al. (Reference Copenhafer, Richert, Schinckel, Grant and Gerrard2006) and Nam et al. (Reference Nam, Choi, Lee, Choe, Jeong, Kim and Kim2009), indicating that this meat is more tender compared with the NG meat (Ellis et al., Reference Ellis, Webb, Avery and Brown1996). However, other studies found no (Oksbjerg et al., Reference Oksbjerg, Petersen, Sorensen, Henckel, Vestergaard, Ertbjerg, Moller, Bejerholm and Stoier2000; Band et al., Reference Band, Guimaraes, Lopes, Schierholt, Silva, Pires, Benevenuto and Gomide2005) or an opposite relation between pH 45 min p.m. and shear force or sensory tenderness results (Fernandez et al., Reference Fernandez, Neyraud, Astruc and Sante2002; Boler et al., Reference Boler, Dilger, Bidner, Carr, Eggert, Day, Ellis, McKeith and Killefer2010; Werner et al., Reference Werner, Natter, Schellander and Wicke2010a). In general, after slaughter, the calpain-dependent proteolytic degradation of cellular proteins (e.g. myosin, desmin, vinculin, troponin) is related to the increasing tenderness of the tissue, marked by lower shear force values (Bee et al., Reference Bee, Anderson, Lonergan and Huff-Lonergan2007). In a publication by Shackelford et al. (Reference Shackelford, King and Wheeler2012), the authors presented higher desmin degradation in pale compared with dark pork, indirectly supporting the presented pH effects on the shear force results. However, Bee et al. (Reference Bee, Anderson, Lonergan and Huff-Lonergan2007) showed that in pig meat with low pH 3 h p.m. values, proteolytic degradation of desmin, vinculin and talin, as well as autolytic activation of µ-calpain was reduced indicating that low pH is related with higher shear force values. Zelechowska et al. (Reference Zelechowska, Przybylski, Jaworska and Sante-Lhoutellier2012) also found reduced µ-calpain activation, but only tendentially (P=0.06) lower desmin degradation in pork with low pH 45 min p.m. values (pale soft exudative pork). Beside these proteolytic effects, other parameters (e.g. sarcomere length, collagen content, water content) may also have an impact on the tenderness/shear force results (Wheeler et al., Reference Wheeler, Shackelford and Koohmaraie2000). Therefore, the presented lower grill loss results might be an explanation for the lower shear force results of the FG pork. This assumption is supported by Huff-Lonergan et al. (Reference Huff-Lonergan, Baas, Malek, Dekkers, Prusa and Rothschild2002), Boler et al. (Reference Boler, Dilger, Bidner, Carr, Eggert, Day, Ellis, McKeith and Killefer2010) or Omana et al. (Reference Omana, Goddard, Plastow, Janz, Ma, Anders, Moore and Bruce2014), who presented a positive relation between cooking loss and sensorially tougher meat, respectively, pork with higher shear force values.
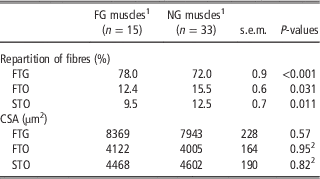
With regard to muscle structure parameters, the rate of pH decline only influenced the percentages of muscle fibres but not the CSA results. LMs of the FG group had significantly (P<0.001) higher proportions of FTG fibres and lower (P<0.05) FTO and STO fibre percentages (Table 2).
Effects of the rate of pH decline in the porcine longissimus muscles on the muscle structure parameters

CSA=cross-sectional areas; FG=fast glycolysing; FTG=fast-twitch glycolytic; FTO=fast-twitch oxidative; NG=normal glycolysing; STO=slow-twitch oxidative muscle fibres.
1 FG muscles had a pH 45 min p.m. <6.0, whereas NG muscles had a pH >6.0.
2 These data were non-normally distributed and were analysed with the Mann–Whitney U test.
P-values<0.05 were considered significant.
This relation between pH and the muscle fibre characteristics (partly) agrees with publications of Fiedler et al. (Reference Fiedler, Dietl, Rehfeldt, Wegner and Ender2004), Ryu and Kim (Reference Ryu and Kim2005) and Choi et al. (Reference Choi, Ryu and Kim2006). Other authors found an additional pH effect on the CSA values (Fiedler et al., Reference Fiedler, Dietl, Rehfeldt, Wegner and Ender2004; Werner et al., Reference Werner, Natter, Schellander and Wicke2010a). However, in the latter studies halothane/MHS pig genotypes were investigated, which principally show higher CSA of the LM. The lower pH 45 min p.m. in the meat samples with higher proportion FTG fibres could be related to the energy metabolism of the muscle cells. It could be suggested that the shift from the aerobic to the anaerobic ATP production postmortem is accelerated in FTG fibres owing to the lower myoglobin and mitochondria content and higher glycolytic metabolism (Lefaucheur, Reference Lefaucheur2010). The consequence is an increased lactate production in these fibres accompanied with lower pH values (lactic acidosis) (Ryu and Kim, Reference Ryu and Kim2005).
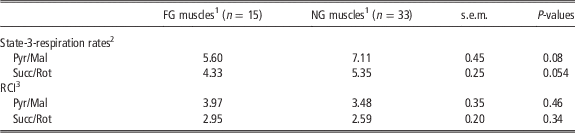
The permeabilised muscle fibres from FG and NG meat showed tendentially different mitochondrial respiration results (Pyr/Mal: P=0.08; Succ/Rot: P=0.054), whereas the respiratory control index values were comparable between the meat groups (Table 3).
Effects of the rate of pH decline in the porcine longissimus muscles on the mitochondrial respiration parameters

FG=fast glycolysing; NG=normal glycolysing; Pyr/Mal=pyruvate/malate; RCI=respiratory control index; Succ/Rot=succinate/rotenone.
1 FG muscles had a pH 45 min p.m. <6.0, whereas NG muscles had a pH >6.0.
2 State-3-respiration rates with the substrates Pyr/Mal and Succ/Rot in pmol O2/s×mg sample weight.
3 The RCI was calculated by dividing the Pyr/Mal or Rot/Succ state-3-respiration and the state-4-respiration rates with oligomycin.
P-values<0.05 were considered significant.
This effect was also shown in the study by Wicke et al. (Reference Wicke, Gellerich, Greb, von Lengerken and Zierz2000) and Werner et al. (Reference Werner, Natter, Schellander and Wicke2010a) on comparing different pig genotypes. Investigation in broiler and turkey meat also showed no impact of a lower pH 20 min p.m. on the Pyr/Mal-MRA results (Opalka et al., Reference Opalka, Wicke, Gellerich, Schmidt, Rosner, Zierz and von Lengerken2004; Werner et al., Reference Werner, Janisch and Wicke2011). In all these studies, MRA was analysed with permeabilised muscle fibres. Considering studies that investigated the respiratory activities of isolated mitochondria, no differences of Pyr/Mal- or glutamate/malate (Glu/Mal)-MRA values in pig muscle samples with different pH values could be found (Brooks and Cassens, Reference Brooks and Cassens1973; Campion et al., Reference Campion, Olson, Topel, Christian and Kuhlers1975; Rasmussen et al., Reference Rasmussen, Rasmussen, Andersen, Jorgensen and Quistorff1996). However, Eikelenboom and van den Bergh (Reference Eikelenboom and Van den Bergh1973) found lower Glu/Mal-MRA and Cheah (Reference Cheah1973) found lower Succ-MRA results in isolated muscle mitochondria from stress-susceptible (Pietrain) compared with -resistant pigs (Dutch Landrace, Large White). The data indicate that the mitochondria were not affected by the accelerated pH reduction in the FG meat, and that the MRAs had no influence on the pH development after slaughter of the pigs.
In conclusion, FG and NG pig LMs differ with regard to pH, EC, temperature, lightness and shear force values. Beside these effects on the meat quality characteristics, this differing pH reduction postmortem was clearly related to the proportions of FTG, FTO and STO fibres in the meat. However, no effects of the pH decrease on the mitochondrial functions and vice versa could be obtained.
Acknowledgements
This study was supported by the Ahrberg Foundation, Hannover, Germany. The authors gratefully acknowledge Dieter Daniel, Erwin Toenges, Peter Ludewig, Ruth Wigger and all the people participating in the time-consuming meat collections and analyses.