


1. Introduction
Understanding how economies progress towards prosperity has long been a challenge for researchers and practitioners in development economics. Hidalgo and Hausmann developed the economic complexity index (ECI) by modelling international trade flows as ‘country-product’ networks. They contend that countries' income levels converge based on the complexity of their productive structures, which has implications for growth and development (Maurya and Sahu, Reference Maurya and Sahu2022). Through a set of linear iterative equations, ECI characterises the structure of a country's trade network, coupling its diversity (the number of products exported) and the ubiquity of a product (the number of countries exporting that product). It is a measure of the knowledge integrated into the productive structure of a country. Its growth reflects the diversification of production systems and improvements in quality (Ivanova et al., Reference Ivanova, Strand, Kushnir and Leydesdorff2017). Likewise, differences in income across countries can be explained by differences in their economic complexity, which measures their ‘capabilities’. It is a non-monetary indicator of development and competitiveness of countries as it expresses intangible assets of the productive system.
Several studies have highlighted the diverse impact of economic complexity on overall development. Some authors, for example, provide evidence of bidirectional causalities between economic growth, economic complexity, and CO2 emissions (Romero and Gramkow, Reference Romero and Gramkow2021; Wang et al., Reference Wang, Wu and Wang2023), and that economic complexity may reduce GDP in low-income countries due to a lack of human capital, innovation, and institutions (Bucci et al., Reference Bucci, Carbonari, Gil and Trovato2021; You et al., Reference You, Zhang and Lee2022). Other studies find that economic complexity improves the growth effect of FDI on host countries (Sadeghi et al., Reference Sadeghi, Shahrestani, Kiani and Torabi2020; Ranjbar and Rassekh, Reference Ranjbar and Rassekh2022); still others claim that there is a positive interaction effect on economic growth between economic complexity and human capital, resources, and institutions. Ceteris paribus, economic complexity directly and/or indirectly influences growth and its distribution within countries.
Evolution of income inequality in tandem with certain forms of development has long been a source of concern for economists and policymakers (Kuznets, Reference Kuznets1955). Hartmann et al. (Reference Hartmann, Guevara, Jara-Figueroa, Aristarán and Hidalgo2017) demonstrate that economic complexity reveals information on an economy's level of development, relevant to how economies generate and distribute incomes. There exist two important perspectives on economic complexity: first, enlarging the diversity and production network has the potential to expand the production system, which increases the demand for production inputs such as jobs (Bandeira Morais et al., Reference Bandeira Morais, Swart and Jordaan2021). Secondly, economic complexity goes hand in hand with institutional arrangements that set the basis for income distribution as institutions define and shape the environment in which education, public spending, and trade openness facilitate the reducing effects of economic complexity on income inequality (Chu and Hoang, Reference Chu and Hoang2020).
Instability, poverty, and rising inequality are facts of life in nations with abundant natural resources. There is ample historical evidence which argues that resource-poor countries tend to grow faster than resource-rich ones, even though natural resource wealth has not historically been the primary factor in a country's economic success (Acemoglu and Robinson, Reference Acemoglu and Robinson2012). According to studies on the resource curse, natural resources lead to deindustrialization, lessen the accumulation of human and physical capital, increase macroeconomic uncertainty, degrade political institutions, and fuel civil war and social unrest (Kim et al., Reference Kim, Chen and Lin2020). As a result, some authors put the blame for rising inequality on the lack of economic diversification and on the focus on raw natural resource exportation. Diversifying the economic structure and promoting good governance practices would allow them to escape the resource curse and redistribute rents fairly.
The interaction between natural resources and the productive structure can lead to the underdevelopment of resource-rich countries and to unequal or unfair forms of income distribution, irrelevant for structural change and long-term growth (Tabash et al., Reference Tabash, Mesagan and Farooq2022). Indeed, economic complexity fostered by investments in human and technological capital is a key component of structural transformation, necessitating an appropriate institutional structure that can reduce the magnetic effect between resource rents and poor governance (Ajide, Reference Ajide2022; Saud et al., Reference Saud, Haseeb, Zafar and Li2023). This therefore will provide resource-rich countries the opportunity to take a giant and positive step towards expanding opportunities for employment, income redistribution, and improved growth prospects. As such, the raising of infrastructures (that promote economic complexity) becomes the only means of reconciling economic diversification and natural resource wealth (Marco et al., Reference Marco, Llano and Pérez-Balsalobre2022). Further, economic complexity is an appropriate tool against the resource curse as it broadens countries' economic base by distancing their economic growth from natural resource exploitation. In other words, it emphasises the differences in growth patterns between resource-rich and resource-poor countries, and indicates that economic growth is driven by diversification of exports beyond the natural resources sector.
While income inequality is in the news, the literature struggles to find its true determinants (Ravallion, Reference Ravallion2018; Lee and Vu, Reference Lee and Vu2019; Nolan et al., Reference Nolan, Richiardi and Valenzuela2019). Both developed and developing countries exhibit a high degree of income inequality (figure 1). More specifically, the World Inequality Lab (2018) shows that in 2016, the share of total national income accounted for by the top 10 per cent of earners was 37 per cent in Europe, 41 per cent in China, 46 per cent in Russia, 47 per cent in US-Canada, and around 55 per cent in sub-Saharan Africa, Brazil, and India. In the Middle East, the top 10 per cent capture 16 per cent of national income.
Geography of average income inequality, 1995–2016.
Source: Authors' construction, based on SWIID database.

In this paper, we empirically examine the effect of natural resources on income inequality as a function of economic complexity. Numerous studies have highlighted the role of a country's economic structure in the resource–income inequality nexus (Gylfason and Zoega, Reference Gylfason and Zoega2002; Fum and Hodler, Reference Fum and Hodler2010; Parcero and Papyrakis, Reference Parcero and Papyrakis2016; Hartwell et al., Reference Hartwell, Horvath, Horvathova and Popova2019), but none have examined the mediating role of the new indicator of economic complexity. Furthermore, evidence in the literature suggests that economic complexity reduces resource dependence (Canh et al., Reference Canh, Schinckus and Thanh2020) and income inequality (Hartmann et al., Reference Hartmann, Guevara, Jara-Figueroa, Aristarán and Hidalgo2017; Lee and Vu, Reference Lee and Vu2019). All these facts have been widely documented, but rarely in a unified manner. Assessing the co-evolutionary pattern between resource dependence, economic complexity, and income inequality is a step to extend empirical work on the resource curse hypothesis and provide effective instruments for policymakers in resource-rich countries.
According to the literature on the resource curse, productive structure determines the pattern of specialisation and the development outcomes of resource-rich countries (Baland and Francois, Reference Baland and Francois2000; Djimeu and Omgba, Reference Djimeu and Omgba2019; Canh et al., Reference Canh, Schinckus and Thanh2020). However, research on inequality-reducing factors in resource-rich countries has long relied on GDP, export diversification, or institutional quality in isolation (Gylfason and Zoega, Reference Gylfason and Zoega2002). Economic complexity, on the other hand, is more robust than the indicators traditionally used to measure productive structure in the resource curse literature because it incorporates both a country's economic and institutional arrangements. Indeed, as economic development is linked to changes in the structure of the economy that would affect the way production and consumption are carried out (Hidalgo and Hausmann, Reference Hidalgo and Hausmann2009; Hausmann and Hidalgo, Reference Hausmann and Hidalgo2011), economic complexity then becomes an instrument for transitioning the link between natural resource rents and inequality, whose correlation becomes even more important in the context of climate change (Hartmann et al., Reference Hartmann, Guevara, Jara-Figueroa, Aristarán and Hidalgo2017).
We employ the two-step system generalised method of moments (GMM) estimator in a sample of 111 nations from 1995 to 2016. This estimator corrects for joint endogeneity of explanatory variables' biases in dynamic panel data models, as well as problems brought on by unobserved country-specific effects (Farhadi et al., Reference Farhadi, Islam and Moslehi2015; Kim et al., Reference Kim, Chen and Lin2020). According to the findings, commodity exports have a negative impact on income inequality as economic complexity rises. The distinction between point-source and diffuse-source resource exports, as well as the use of resource rents per capita as a gauge of resource abundance, all depend on this. Furthermore, we find a significant difference between OECD and non-OECD countries, those with low and high ethnic fractionalization but also between countries with low and high democracy.
The structure of the paper is as follows. After a brief literature review in section 2, section 3 includes an overview of the methodology applied, both for the data and estimation strategy. In section 4 we present the results. Section 5 concludes.
2. What the literature says
The resource curse literature has identified resource dependence as a determining factor of increasing income inequality in some resource-rich countries (Leamer et al., Reference Leamer, Maul, Rodriguez and Schott1999; Gylfason and Zoega, Reference Gylfason and Zoega2002; Allcott and Keniston, Reference Allcott and Keniston2018; Cavalcanti et al., Reference Cavalcanti, Da Mata and Toscani2019). First, reliance on natural resources constrains the scope for economic transformation and diversification, trapping some resource-rich countries in a cycle of ‘immiserizing’ specialisation and growth (Corden and Neary, Reference Corden and Neary1982; Corden, Reference Corden1984). Rents are generally distributed in favour of the political elite or power group and at the expense of the population. While shocks to labour-intensive commodities (agricultural commodities, food) appear to be associated with lower inequality, shocks to capital-intensive commodities (oil, gas, mining) appear to be associated with higher inequality, as Mohtadi and Castells-Quintana (Reference Mohtadi and Castells-Quintana2021) point out. Natural resource exploitation can also contribute to inequality through environmental degradation and a negative impact on green growth. Most importantly, resources undermine the institutional framework that is supposed to frame and seed rents into productive infrastructure that facilitates income distribution (Hartwell et al., Reference Hartwell, Horvath, Horvathova and Popova2019, Reference Hartwell, Horvath, Horvathova and Popova2021; Avom et al., Reference Avom, Ntsame Ovono and Ongo Nkoa2022).
A growing body of empirical evidence suggests that resource dependence worsens income inequality (Parcero and Papyrakis, Reference Parcero and Papyrakis2016; Steinberg, Reference Steinberg2017). Goderis and Malone (Reference Goderis and Malone2011) demonstrate this through the Dutch disease: resource booms increase income inequality by reducing manufacturing employment. According to Kim et al. (Reference Kim, Chen and Lin2020), commodity price shock has a positive long-run effect on income inequality because rising labour demand in the booming sector has the potential to change income inequality and poverty rates (Mejía, Reference Mejía2020), and crowds out public investment in human capital accumulation (Mousavi and Clark, Reference Mousavi and Clark2021).
Carmignani and Avom (Reference Carmignani and Avom2010) investigate the impact of resource intensity on social development and discover that increasing resource exports lowers social development by increasing income inequality and macroeconomic volatility, while Kim and Lin (Reference Kim and Lin2018) claim oil dependency may reduce income disparity. Others use the institutional channel to demonstrate that natural resources have an impact on income inequality in countries with weak institutions (Mehlum et al., Reference Mehlum, Moene and Torvik2006; Bhattacharyya and Hodler, Reference Bhattacharyya and Hodler2010; Hartwell et al., Reference Hartwell, Horvath, Horvathova and Popova2019). Fum and Hodler (Reference Fum and Hodler2010) discover that in an ethnically divided country, resource abundance increases income inequality while having the opposite effect in homogeneous countries. Kim et al. (Reference Kim, Chen and Lin2020) stress that oil abundance increases human capital investment, improves institutional quality, and hence reduces income inequality, whereas oil volatility has the reverse effect. They claim that institutions determine whether natural resources are cursed or not in resource-rich countries.
Based on this evidence, the main factor that causes resource-rich countries to remain poor is that their GDP growth is highly concentrated around exports of unprocessed natural resources. Kuznets (Reference Kuznets1973) argues that a country should determine a technological and institutional structure that shapes a set of proximate determinants of income distribution, defining growth as a country's ability to provide increasingly diverse goods to its population (Kuznets, Reference Kuznets1955). Indeed, GDP growth is not the only factor that contributes to inequality (Jones and Klenow, Reference Jones and Klenow2016), as trade, human and physical capital, geography, history, culture, and institutions all play a role (Acemoglu and Robinson, Reference Acemoglu and Robinson2012; Atkinson and Søgaard, Reference Atkinson and Søgaard2016; Saviotti et al., Reference Saviotti, Pyka and Jun2020). Thus, income inequality in an even more resource-rich country seems far from being influenced only by the monetary instrument such as GDP, but rather by a much broader and complex framework of productive structure.
Economic complexity would therefore enable resource-rich countries to reduce their dependence on exports of unprocessed natural resources and its effects on income inequality in several ways. First, increased economic complexity is associated with increased entrepreneurial activity and technological innovation, creating an environment in which new entrepreneurs would have incentives to produce new products that are less reliant on natural resources, which are expensive and highly dependent on external factors (Youssef et al., Reference Youssef, Boubaker and Omri2018; Douglas and Prentice, Reference Douglas and Prentice2019). Increasing economic complexity, on the other hand, improves the quality of the production system and the efficiency of activities that use fewer natural resource rents (Balsalobre-Lorente et al., Reference Balsalobre-Lorente, Shahbaz, Roubaud and Farhani2018). The work of Canh et al. (Reference Canh, Schinckus and Thanh2020) shows, for example, that economic complexity reduces total resource dependence, as it reduces mining rents and natural gas rents, but increases coal rents. In Africa, Tabash et al. (Reference Tabash, Mesagan and Farooq2022) document that economic complexity mitigates the negative impact of natural resources on growth, while Ajide (Reference Ajide2022) shows that the empirical regularity of the natural resource curse thesis is unconditionally established on economic complexity.
Thus, countries with advanced capacity and product baskets would benefit from economic complexity, resulting in greater economic diversification, less resource dependence, and better income distribution (Saad et al., Reference Saad, Brahim, Schaffar, Guesmi and Saad2023). Economic complexity, with a high level of sophistication in the commodities produced and exported, would allow a resource-dependent country to increase its stock of knowledge because it governs know-how that is not captured by any formal education indicator (Hidalgo, Reference Hidalgo2021). Hence, as the poverty-reducing effect of low diversified growth fades over time, resource-dependent economies will see economic complexity as a beacon of hope and an effective tool for reducing inequality (Wan et al., Reference Wan, Wang and Zhang2021).
3. Data and methodology
3.1 Data and descriptive statistics
We use an unbalanced panel of 111 countries, both developed and developing, over 1995–2016. One explanation for the choice of this period is the availability of key data on economic complexity (starting in 1995) and income inequality (ending in 2016 for most countries). Table A1 in the appendix provides the list of countries.
3.1.1 Measurement of income inequality (gini)
We use the Gini index from the Standardized World Income Inequality Database (SWIID) to measure income inequality (Solt, Reference Solt2020). SWIID combines data from the Luxembourg Income database (LIS) and the UNU-WIDER World Income Inequality Database (WIID) to create a unified dataset with improved comparability across countries and over time. SWIID data is derived from the LIS and WIID databases after inequalities are assessed using substantially comparable LIS and WIID income data (Kim et al., Reference Kim, Chen and Lin2020). As a result, SWIID data is more comparable to LIS data, but with greater temporal coverage and comparability. SWIID standardises the Gini index of income inequality before and after taxation. This allows for a thorough comparison of income disparity before and after taxation and transfers. Because both Gini indices are highly connected, we utilize the net income Gini index instead of the market one.
3.1.2 Share of commodities exports as resource-dependence indicator (nrx)
Following Sala-i Martin and Subramanian (Reference Sala-i Martin and Subramanian2013), we measure natural resource dependence or intensity by the sum of: (i) fossil fuel, (ii) metal and ores, (iii) agricultural raw materials, and (iv) food and beverage exports in total merchandise exports. This measure allows us to assess the impact of distancing the economy from natural resources on social development, and thus diversification (Sala-i Martin and Subramanian, Reference Sala-i Martin and Subramanian2013; Kim et al., Reference Kim, Chen and Lin2020). Figure 2 presents the average contribution of commodity exports to total merchandise exports in our sample. It is found that intensive countries are from all regions and income groups except the North America region.
Contribution of commodities exports to total merchandise exports, 1995–2016.
Source: Authors, based on WDI database (World Bank, 2020).

3.1.3 Measure of economic complexity (eci)
Economic complexity, as defined by Hidalgo (Reference Hidalgo2023), is an integration of science, networks, and machine learning methods to understand, predict, and advise changes in economic structures. Indeed, economic structure is crucial because it explains and forecasts major macroeconomic outcomes such as economic growth, the intensity of greenhouse gas emissions, and income inequality. Economic complexity represents the diversity and ubiquity of products that a country produces and exports (Hidalgo and Hausmann, Reference Hidalgo and Hausmann2009). Indeed, by diversifying its exports and trade partners (network), a country can increase the complexity of its economy. Diversity quantifies the number of products that a country can produce competitively, and ubiquity indicates the number of countries exporting this product.
Intuitively, economic complexity reflects the degree of sophistication of a country's export products (Hartmann et al., Reference Hartmann, Guevara, Jara-Figueroa, Aristarán and Hidalgo2017). It allows for a new approach for a country's international competitiveness based on its level of income, stock of knowledge, and revealed comparative advantage. This indicator is constructed on countries/product data from the World Trade Flows database. Data on the economic complexity index come from MIT's Observatory of Economic Complexity (Simoes et al., Reference Simoes, Landry, Hidalgo and Teng2018).
3.1.4 Control variables
Our control variables are broadly related to the literature on the drivers of income inequality (Ravallion, Reference Ravallion2018; Nolan et al., Reference Nolan, Richiardi and Valenzuela2019).
• Gross Domestic Product per capita (gdppc). There is an extensive ambiguous relationship between the level of economic development and income inequality following Kuznets (Reference Kuznets1955). We introduce both the level of GDP per capita and its square (gdppc_sq) into our empirical model and expect a positive sign for the former and a negative one for the latter.
• Domestic credit to the private sector (dmcps). This variable is included to control for the level of a country's financial development. Empirical evidence suggests that the relationship between financial development and income inequality can be positive, negative, or neutral (Baiardi and Morana, Reference Baiardi and Morana2018).
• Globalization (kofgi) has undoubtedly been the most important progress in economic and social systems for human beings. It describes the process of economic, financial, social, and political integration of countries. In this study, we measure globalization by the KOF index (kofgi) provided by the KOF Swiss Economic Institute (Gygli et al., Reference Gygli, Haelg, Potrafke and Sturm2019).
• Economic Freedom Index (wef). We consider the economic freedom index provided by the Fraser Institute as an indicator of institutions (Gwartney et al., Reference Gwartney, Lawson and Hall2019). It is constructed as the mean of five sub-indices: (i) size of government, (ii) property rights and legal structure, (iii) access to sound money, (iv) international trade and trade policies, and (v) market regulation. It scales between 0 and 10, where a high value indicates higher economic freedom and vice versa. Continuous data on this variable are available since 2000 and in five-year periods prior to that date.
Table A2 in the appendix presents the main data sources, variables and their definitions, and a summary of the descriptive statistics, while table A3 (appendix) gives the correlation matrix.
The descriptive statistics in table A2 show that income inequality is rising steadily across the sample. During the study period, the Gini index ranged from a low of 30.5 in Ukraine to a high of 71.4 in Namibia (one of the most unequal countries in Sub-Saharan Africa) in 1995. The economic complexity of Nigeria, which also has a very high level of dependence on oil, is −2.35, compared to 2.89 for Japan. Indeed, it is absolutely arduous to establish a relationship between natural resources, income equality, and economic complexity, as some countries are highly unequal and highly complex, slightly dependent on resources (US, Germany, Japan). Conversely, others are highly unequal, marginally complex, and highly dependent on natural resources (Nigeria, Cameroon, Algeria). One of the reasons for this paradox is due, for instance, to the automation and digitalization in the former countries and the low quality of redistribution institutions in the latter countries.
3.2 Estimation strategy
To systematically test the key role of economic complexity on the resource dependence-income inequality nexus, we rely on the model represented by equation (1):

In equation (1), the left-hand side variable $gin{i_{i,t}}$ is the logarithm of the Gini index, $nr{x_{i,t - 1}}$
 indicates the logarithm of total commodities exports as a percentage of total merchandise exports, $ec{i_{i,t - 1}}$
 denotes the economic complexity index, and the vector ${{\rm X}_{i,t - 1}}$
 includes control variables. ${\eta _t}$
 and ${\mu _i}$
 refer to the common and specific shocks and are approximated by time and country dummy variables respectively, while ${\varepsilon _{i,t}}$
 is the error term.
Reverse causality is likely to influence the relationship between natural resource exports, economic complexity, and income inequality. A system of simultaneous equations could be used to estimate equation (1). Indeed, the simultaneous equation model (SEM) approach uses single-equation estimation, whereas GMM uses a system of equations analysis (Roodman, Reference Roodman2009; Wooldridge, Reference Wooldridge2010). The most important step in avoiding computational errors, underestimation, and overestimation is model specification. When the model specification is correct, the SEM outperforms single equation models and techniques. However, if one of the system's equations is not correctly specified, the reported estimates may contain misleading results and contaminated parameters. Some researchers therefore rely on the dynamic GMM to reduce the risk associated with model specification (Blundell and Bond, Reference Blundell and Bond1998).
Anderson and Hsiao (Reference Anderson and Hsiao1982) suggest a first-difference transformation to get rid of the fixed effects in dynamic panel-data models and to deal with endogeneity. The lagged differentiated explanatory variables and the lagged differentiated error term may still show a correlation after this, though. In the case where instruments are not correlated with the error term, the diff-GMM (dGMM) estimator can be applied. Blundell and Bond (Reference Blundell and Bond1998) emphasise, however, that the dGMM estimator might not be appropriate for finite samples. Using lagged level instruments for the difference equation and lagged difference instruments for the level equation, they propose the system GMM (sGMM) estimator, which combines the difference and level regressions in a system of equations.
Arellano and Bond (Reference Arellano and Bond1991) present a set of tests for determining the validity of sGMM estimates. The first is a Sargan–Hansen test for instrument validity, which looks for the absence of a second-order correlation in the model. To begin with, the Arellano–Bond autocorrelation test is used to ensure that the estimated findings do not contain second-order autocorrelation. Indeed, the lagged dependent variable introduced on the right-hand side of equation (1) is mathematically obvious to be associated with the one introduced in the first difference. As a result, to determine whether there is a first-order autocorrelation at levels, a second-order autocorrelation in differences must be investigated. The model does not suffer from autocorrelations if the AR(2) statistic is over a 10 per cent threshold (Roodman, Reference Roodman2009). Regarding the validity of the instruments, the null hypothesis to be tested here is that the instruments are not correlated with the residuals. As a result, it is preferable to reject the model when the Hansen statistic's critical value is bigger than the critical value ${\chi ^2}$ .
4. Results and discussion
4.1 Preliminary evidence
Preliminary evidence on the connections between economic complexity, income inequality, and resource dependence are shown in figure 3. Panel 1 demonstrates the regional variations in income inequality. The relationship between total commodities exports as a share of total merchandise exports and income inequality is depicted in panel 2 of the graph. When economic complexity is divided into quartiles, panels 3 and 4 demonstrate a similar relationship. The analysis of panel 2 in the entire sample shows no obvious link. For countries with lower levels of economic complexity, panel 3 shows a positive correlation, and panel 4 shows a negative correlation for those with higher levels. These results suggests that dependence on natural resources increases income inequality in marginally complex economies.
Resource intensity, economic complexity, and income inequality.
Notes: In the box plots of panel 1, the lower and upper hinges of each box display the 25th and 75th percentiles of the samples, the line in the box indicates the respective medians, and the endpoints of whiskers mark the next adjacent values. EAP: East Asia and Pacific; ECA: Europe and Central Asia, LAC: Latin America and the Caribbean, MNA: Middle East and North Africa; NAC: North America; SAS: South Asia, SSA: Sub-Saharan Africa. In all panels, the Gini index (measure of income inequality) is on the y-axis while commodities export (nrx) is on the x-axis. We define the lower (upper) quantile of economic complexity as when a country's average complexity across the study period is lower (higher) than the sample median, i.e., 0.139.
Source: Authors' construction.

4.2 Main results
Globally, in all our specifications, the non-rejection of the null hypothesis of Hansen's test confirms that our instruments are valid. Further, the non-significance of the AR(2) indicates that there is no second-order correlation in all our specifications. Our main results are reported in table 1. Panel A presents pooled and fixed-effects results, while panel B gives those with the sGMM estimator.
Resource dependence, economic complexity, and income inequality: mains results

Notes: sGMM indicates the system generalized moments estimator. The dependent variable in all columns is the natural logarithm of the Gini index. The bold values refer to the coefficients which are needed to compute the marginal effect of natural resources on income inequality given the level of economic complexity. The numbers in parentheses are t-statistics and are based on robust standard errors.
In all columns of table 1, the coefficients of nrx and eci are both significant but those of the first variable are positive (increasing inequalities) while those of the second are negative (reducing inequalities). This is consistent with the literature (Kim and Lin, Reference Kim and Lin2018; Chu and Hoang, Reference Chu and Hoang2020; Kim et al., Reference Kim, Chen and Lin2020). Regarding the interaction variable, its coefficients (nrx*eci) are negative and statistically significant at the 10 per cent level in column (2) and the 1 per cent level in column (3).
The lagged dependent variable's coefficients are considerably large and highly significant in the last four columns of table 1. This implies that income inequality persists over time, justifying the adoption of the dynamic approach. The coefficients of total commodities exports are positive and significant at the 1 per cent level in columns (4) and (5), and the 5 per cent level in columns (6) and (7). However, these effects are mitigated by the reducing effect of the estimated interaction coefficient terms between economic complexity and commodities exports which is negative and statistically significant in all columns. Thus, the marginal effect of nrx on the gini is reversed given the significant coefficient of the interaction variable. These results suggest that economic complexity considerably reduces the positive impact of natural resource dependence on income inequality.
Looking at the control variables, the Kuznets' hypothesis is confirmed with gdppc as a measure of economic development. The projected gdppc coefficients have a positive sign and are significant at the 5 per cent level, the coefficients of gdppc-sq are negative and significant. The coefficients of financial development (dmcps) are positive and significant, confirming the widening inequality hypothesis (Baiardi and Morana, Reference Baiardi and Morana2018). In columns (3) to (7), the coefficient of globalization (kofgi) is negative and significant, but non-significant in column (2).
4.3 A matter of appropriability: point versus diffuse-source commodities
Considering the appropriability of natural resources (Boschini et al., Reference Boschini, Pettersson and Roine2007), we examine the effect of point-source and diffuse-source commodity exports on income inequality separately. Indeed, there is a lot of evidence on the fact that point-source resources are more likely to cause ‘resource curse’ than diffuse-source resources. As such, point-source resources are relatively easy to monitor and govern, and promote expropriation (Dauvin and Guerreiro, Reference Dauvin and Guerreiro2017). We total the exports of fossil fuels, ores, and metals to calculate point-source resources, whereas agricultural raw materials, food, and beverage exports are considered diffuse-source resources. The results are shown in table 2.
Type of commodity, economic complexity, and income inequality: system-GMM results
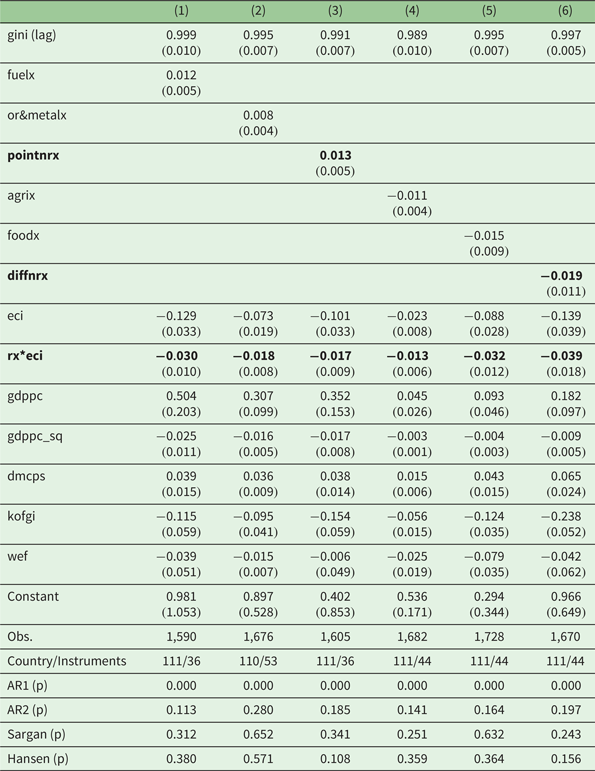
Notes: The dependent variable in all columns is the natural logarithm of the Gini index. ‘rx’ indicates the type of commodity considered. The bold values refer to the coefficients which are needed to compute the marginal effect of natural resources on income inequality given the level of economic complexity. The numbers in parentheses are t–statistics and are based on robust standard errors.
The coefficient of point resource exports (pointnrx) in column (3) is, as expected, positive and significant at the 1 per cent level, whereas the coefficient of diffuse resource exports (diffnrx) in column (6) is negative and non-significant. The results remain the same when we disaggregate point and diffuse resources. The coefficients of fossil fuels and gold and metals export are positive and significant at the 5 per cent level (columns (1) and (2)). Agricultural raw material exports, like food and beverage exports, have a negative but non-significant coefficient. According to these findings, reliance on point-source resources, rather than diffuse ones, has the greatest effect on income inequality. The interaction term between resources exports and economic complexity (rx*eci) remains negative and significant at the 1 per cent level regardless of the type of resource considered.
4.4 Resource abundance as an alternative measures of natural resources
Resource curse refers to the paradox that countries with abundant natural resources have weaker socioeconomic and institutional development than their less endowed counterparts (Atangana Ondoa, Reference Atangana Ondoa2019). A distinction must therefore be made between measures of natural resources close to endowment or wealth and those of dependence or intensity (previously used). Thus, we use the natural logarithm of resource rents per capita (totrentspc) as an indicator of resource abundance and repeat our main estimations from tables 1 and 2 in table 3.
Resource abundance, economic complexity, and income inequality: results
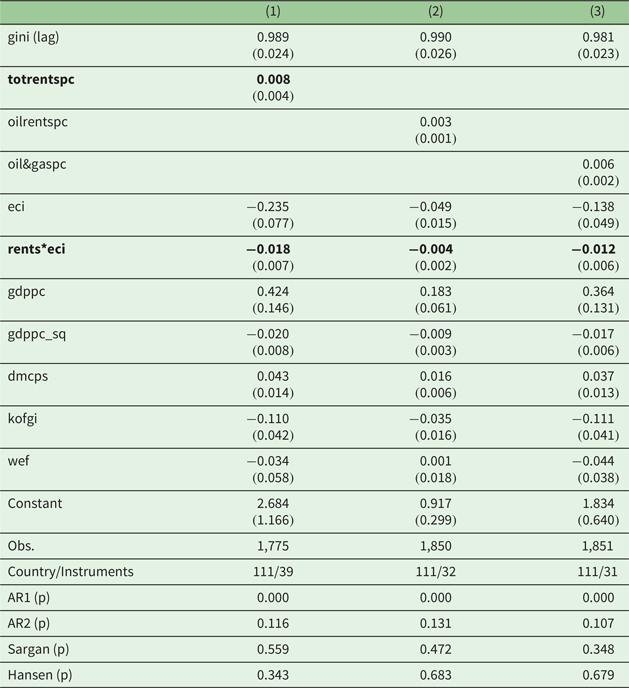
Notes: The dependent variable in all columns is the natural logarithm of the Gini index. The bold values refer to the coefficients which are needed to compute the marginal effect of natural resources on income inequality given the level of economic complexity. The numbers in parentheses are t-statistics and are based on robust standard errors.
In line with previous findings, the resource curse–income inequality nexus still holds with resource rents per capita as an indicator of resource abundance. In column (1) the coefficient of the natural logarithm of total resource rents per capita (totrentspc) is positive and significant. This result remains the same when we consider oil rents per capita (oilrentspc) and oil and gas rents per capita (oil&gaspc) separately. Furthermore, economic complexity still plays its mitigating role in all cases. The coefficients of the interaction terms (rents*eci) are all negative and significant at the 5 per cent level.
4.5 Dealing with heterogeneities: subsample analysis
Heterogeneity is one of the main challenges in the empirical analysis of the resource curse. For example, our sample contains 111 countries with diverse economic policies, institutions, and ethnic groups. We have, however, treated them as a single entity thus far. We continue our robustness analyses while considering country-specific characteristics. The results are presented in table 4.
Heterogeneity and subsample results

Note: The numbers in parentheses are t-statistics and are based on robust standard errors.
We had mistakenly assumed that countries' economic policies and progress were all the same. Columns (1) and (2) present GMM estimates for non-OECD and OECD countries, respectively. This exercise admits knowing whether a country's economic development matters. The estimated coefficient of the interactive variable (nrx*eci) is negative, significant in the sample of non-OECD sample, but non-significant in the OECD one. Note that the latter does not imply the absence of significant effects, but rather highlights that structural change and technological level highlight heterogeneity across countries by cancelling out on average. Thus, results obtained with the non-OECD sample are consistent with the previous findings.
In columns (3) and (4) we distinguish between high and low ethnically divided countries using the ethnic fractionalisation index of Alesina et al. (Reference Alesina, Devleeschauwer, Easterly, Kurlat and Wacziarg2003). Results indicate that economic complexity significantly mitigates the increasing effect of the resource curse hypothesis on income inequality in highly fractionalised countries. Thus, ethnic fractionation may limit not only the development of economic complexity but also its mediating effect on the resource-equality relationship.
Columns (5) and (6) in table 4 detail a comparable experience with high and low democratic countries. The latter is measured by the Polity2 index of political regime. The index ranks countries on a scale of −10 (total autocracy) to +10 (complete democracy). Not surprisingly, we find that the impact of the interaction term on income inequality tends to be higher for countries with higher levels of democratization. Thus, democratic countries are conducive to policies that generate resource-enhancing public goods and services, relevant for economic complexity and income equality.
4.6 Marginal effects of natural resources on income inequality
Table 5 provides a comprehensive overview of the previous sub-sections' results (based on tables 1–3) by calculating the marginal effects of natural resources at various levels of economic complexity. According to the results in columns (1) and (4), a 1 per cent increase in total commodities exports ratio (dependence), and total resource rents per capita (abundance), would significantly increase income inequality by 4.8 per cent and 5 per cent, respectively in countries with the lowest level of economic complexity. On average, the impact is still positive, but the magnitude and significance are much lower, at 5 per cent for total commodities exports and non-significant for resource rents per capita. However, turning to countries with the highest level of economic complexity, the coefficients of resource dependence and abundance turn negative and significant at the 5 per cent level. All these marginal effects are graphically represented in figure 4.
Marginal effects of natural resources on income inequality

Notes: eci is the economic complexity index, and the lowest (highest) value is considered as the worst (best) economic complexity. Standard errors are in parentheses.
Average marginal effects of natural resources on income inequality.
Notes: Marginal effects of different measures of natural resources on income inequalities at different levels of economic complexity for the total sample (1995–2016). The upper and lower bars are the upper and lower bounds of the 95% confidence intervals (CIs).

5. Conclusion
Based on the observation that income inequality is increasing heterogeneously in both resource-rich and resource-poor countries, this study aims to assess the moderating role of economic complexity. In a sample of 111 countries around the world, it uses the system GMM to conduct the empirical analyses. The results show that resource dependence has a positive and significant influence on income inequality, but that this influence is reversed when economic complexity increases. Indeed, considering the share of commodity exports in total goods, we prove in our empirical analyses that this moderating effect of economic complexity remains robust when considering the point versus diffuse resource distinction.
Economic complexity allows resource-dependent countries to diversify their economies and break the curse. Economic complexity, in fact, measures a country's ‘trade network,’ and its improvement leads to greater diversification of export partners and products. It reduces the intensity of non-manufactured export concentration by encouraging countries to make better use of their productive capacities (labour force, human capital, innovation, and institutions). A resource-rich country promotes good income redistribution and a prosperous society by allocating rents efficiently to productive sectors and infrastructure.
The results of this study are of great importance to policymakers and scholars worldwide. These results serve as a reminder to policymakers, particularly those in developing countries, of the urgent need for structural reform to support the job creation required for egalitarian income transfer and effective management of resource. The relevance for developed countries is a bit fuzzy, as certain countries, such as the United States, Canada, and Japan, with highly complex economies and growing income inequalities, would undoubtedly find a solution in effective automation and tax policies management rather than efficient resource management. For researchers, the results reflect the current lack of knowledge of the causes of rising inequality in resource-rich countries.
Other research could be conducted based on the results of this study. The literature indicates that there is still no consensus on the effects of economic complexity and natural resources on income inequalities; an in-depth analysis could then assess the joint influence of natural resources and economic complexity on income inequalities by distinguishing wage inequalities from capital inequalities (Mohtadi and Castells-Quintana, Reference Mohtadi and Castells-Quintana2021). Furthermore, where data is available, the influence of economic complexity and/or natural resources on gender income inequality could also be analysed.
Acknowledgements
The authors would like to thank the editor and the anonymous reviewers for their comments and suggestions to improve this work.
Authors' contributions
All authors contributed to the conception and design of this study. Material preparation, data collection and analysis were performed by Paul Awoa Awoa. All the authors have read and approved the final manuscript.
Competing interests
The authors declare none.
Appendix A
List of countries

Definition of variables, source and descriptive statistics

Correlation matrix



