



1 Introduction
The problem of an evaporating sessile droplet has attracted much attention recently due to its connection to the so-called ‘coffee ring’ problem. It is an easily observable fact that a puddle of coffee, or a sessile liquid droplet suspending non-volatile particles, leaves a clear pattern after the droplet evaporates. Interestingly, most of the suspended particles are deposited in the neighbourhood of the contact line. The reason for this preferential deposit near the contact line was formulated by the pioneering work of Deegan et al. (Reference Deegan, Bakajin, Dupont, Huber, Nagel and Witten1997) and involves a singularity of the evaporative flux at the contact line. Such evaporative-flux singularity is caused by the corner-like geometry near the contact line. Many subsequent works provide refinement of this theory by means of local analysis in close to the contact line (Gelderblom, Bloemen & Snoeijer Reference Gelderblom, Bloemen and Snoeijer2012) or non-local description where the effect of evaporation is included in a thin film approximation for the droplet dynamics (Eggers & Pismen Reference Eggers and Pismen2010).
Meanwhile, the formation of periodic or quasi-periodic deposit patterns is also observed and explained by stick–slip motion of the contact line (Adachi, Dimitrov & Nagayama Reference Adachi, Dimitrov and Nagayama1995; Deegan Reference Deegan2000; Abkarian, Nunes & Stone Reference Abkarian, Nunes and Stone Howard2004; Rio et al. Reference Rio, Daerr, Lequeux and Limat2006; Maheshwari et al. Reference Maheshwari, Zhang, Zhu and Chang2008; Bodiguel, Doumenc & Guerrier Reference Bodiguel, Doumenc and Guerrier2009, Reference Bodiguel, Doumenc and Guerrier2010; Orejon, Sefiane & Shanahan Reference Orejon, Sefiane and Shanahan2011; Snoeijer & Andreotti Reference Snoeijer and Andreotti2013; Stauber et al. Reference Stauber, Wilson, Duffy and Sefiane2014). The contact line remains pinned (stick) at the growing deposit up to a moment when the contact line is unpinned, which was studied by Deegan et al. (Reference Deegan, Bakajin, Dupont, Huber, Nagel and Witten1997). After unpinning, the contact line slips (without the deposit growth) toward a different location where the contact line is pinned again and a new deposit starts to grow.
1.1 The particle accumulation and stick–slip motion
Particles suspended in an evaporating sessile liquid droplet are usually the cause of ‘stick–slip’ behaviour of the contact line. Such particles prevent spreading of the liquid and cause the so-called ‘self-pinning’ of the contact line (Weon & Je Reference Weon and Je2013). For the case of ‘slip’ behaviour, a potential energy barrier for unpinning can explain such a jump of the contact line (Moffat, Sefiane & Shanahan Reference Moffat, Sefiane and Shanahan2009). It was suggested in Moffat et al. (Reference Moffat, Sefiane and Shanahan2009) that during evaporation, the free energy increases until it exceeds the energy barrier, if the contact line is pinned. Moreover, it was also proposed that a sequence of deposited particles near the contact line makes the effect of pinning be weak (Moffat et al. Reference Moffat, Sefiane and Shanahan2009). Therefore, the accumulation of particles in the vicinity of the contact line can be considered as an important factor in unpinning of the contact line.
In this work we study the pinning–unpinning mechanism of the contact line, of which a liquid droplet suspending particles evaporates on a solid substrate, and establish the threshold between the pinned–unpinned transition.
We idealize the deposit shape by a wedge near the contact line (see figure 1) and look at equilibrium configurations of a planar liquid interface in contact with the tip of the wedge. We compute the resulting fluid flow and observe that the streamline tends to flow toward the contact line. Then we perform stability analysis to show that the liquid interface becomes unstable and compute the equilibrium contact angles of the liquid interface and wedge for which such instability occurs. In the mathematical point of view, the pinning–unpinning mechanism corresponds to stability and instability of the equilibrium configurations. Our (linear) stability analysis yields criteria for stability and instability of the equilibrium interfaces, where the instability represents the ‘pinned-to-unpinned’ transition of the liquid–gas interface near the contact line. Our formulation relies on the introduction of the interfacial energy with the energy dissipation/supply mechanism.
2 The model equations for the equilibrium configurations
2.1 Preliminaries: the vanishing normal stress on the liquid interface
Surface tension determines the shape of a droplet on a substrate in the macroscopic region where the capillary number has a tiny value. The normal-stress boundary condition of (A 1) can be written as
 $$\begin{eqnarray}\text{(the pressure difference)}+\frac{{\it\mu}U}{{\it\sigma}}\text{ (the normal stress by the flow)}={\it\kappa},\end{eqnarray}$$
where
 ${\it\mu}$
is the dynamic viscosity,
 $U$
is the characteristic velocity of the liquid,
 ${\it\sigma}$
is the surface tension coefficient and
 ${\it\kappa}$
is the mean curvature of the liquid interface. Then, in the region where
 $\mathit{Ca}={\it\mu}U/{\it\sigma}\ll 1$
, the static position of the interface is determined by the normal-stress boundary condition of the leading order
 $$\begin{eqnarray}\text{(the pressure difference)}={\it\kappa}.\end{eqnarray}$$
Moreover, under the assumption of slow evaporation, the pressure difference decreases in time. In the case of evaporating sessile droplets, the equation, which determines the liquid interface, can be written as follows: for a thin droplet
 $$\begin{eqnarray}(\partial _{xx}+\partial _{yy})h(x,y,t)=-{\it\xi}(t),\end{eqnarray}$$
where
 $h(x,y,t)$
is the height of the droplet at each position
 $(x,y)$
and the pressure difference
 ${\it\xi}(t)$
is decreasing and goes to zero in finite time. If the contact line, which is circular, is pinned during the whole process of evaporation, then the shape of an evaporating droplet is merely a spherical cap that is turning flat. This is a simple and usual case that can describe the interface motion of evaporating sessile droplets, which have been studied by, for example, Deegan et al. (Reference Deegan, Bakajin, Dupont, Huber, Nagel and Witten1997), Popov (Reference Popov2005), Zheng (Reference Zheng2009) and Gelderblom et al. (Reference Gelderblom, Bloemen and Snoeijer2012).
However, the smallness condition of
 $\mathit{Ca}$
breaks down in the vicinity of the contact line, where the liquid velocity increases rapidly. More precisely, from the local-conservation law, we deduce
 $$\begin{eqnarray}\text{(the horizontal velocity of the liquid)}\sim \text{the evaporative flux }J(r),\end{eqnarray}$$
where
 $r$
is the distance from the contact line and
 $$\begin{eqnarray}J(r)\sim r^{({\rm\pi}/2b)-1},\quad b\text{ is the gas-phase angle.}\end{eqnarray}$$
For instance, for a thin droplet,
 $J(r)\sim r^{-1/2}$
as
 $r$
approaches zero (see appendix B). In the region where
 $\mathit{Ca}\ll 1$
, the usual approach (for example, in Popov (Reference Popov2005), Ristenpart et al. (Reference Ristenpart, Kim, Domingues, Wan and Stone2007) and Gelderblom et al. (Reference Gelderblom, Bloemen and Snoeijer2012)) uses the shear-stress condition of (A 1) and the flux condition (2.4) as boundary conditions on the liquid interface to deduce the velocity field of the liquid. These two boundary conditions can be imposed in the macroscopic region where the local capillary number
 $\mathit{Ca}$
is small. The full stress-balance condition (A 1) should be considered at the liquid interface very near the contact line.
Our analysis in this study intends to show the pinned–unpinned transition as the instability of the liquid interface near the contact line. For the purpose of such stability analysis, the deposit shape should be constructed by studying the following problems:
-
(i) the Stokes equation with the full stress-balance condition (A 1), because the condition
 $\mathit{Ca}\ll 1$
breaks down near the contact line;
-
(ii) equilibrium shapes of the liquid interface and the deposition near the contact line.

In general, the second problem is difficult to analyse because the liquid interface may not be a graph and the singular evaporative flux makes the problem hard to handle with variational methods. Therefore, with the assumption of planar interfaces (
 ${\it\kappa}=0$
) and wedge-shaped deposits, we perform stability analysis as a simple and ideal case. Section 6 presents evidence of the crossover between the region where our analysis is worked and the outer region where the usual approach for
 $\mathit{Ca}\ll 1$
is used.
2.2 The mathematical model
The geometry of the droplet close to the contact line can be approximated by a two-dimensional triangular mound (see figure 1). In the following we use a polar coordinate system
 $(r,{\it\theta})$
whose origin is located at the tip of the mound. Moreover, we assume that the liquid–gas interface is located at
 ${\it\theta}=0$
.
An evaporating drop on a substrate with a solid wedge near the contact line. The contact line is located at the origin of the polar coordinate system
 $(r,{\it\theta})$
.

We define the fluid flow
 $\boldsymbol{u}$
inside the droplet in terms of the stream function
 ${\it\psi}(r,{\it\theta})$
as
 $$\begin{eqnarray}u_{r}(r,{\it\theta})=\frac{1}{r}\frac{\partial {\it\psi}}{\partial {\it\theta}},\quad u_{{\it\theta}}(r,{\it\theta})=-\frac{\partial {\it\psi}}{\partial r},\end{eqnarray}$$
where
 $\boldsymbol{u}$
is defined by
 $\boldsymbol{u}=u_{r}\boldsymbol{e}_{r}+u_{{\it\theta}}\boldsymbol{e}_{{\it\theta}}$
. The flow is governed by the Stokes system, or equivalently by the biharmonic equation
 $$\begin{eqnarray}{\rm\Delta}^{2}{\it\psi}=0\quad \text{in }-a<{\it\theta}<0.\end{eqnarray}$$
The mound is considered as a new solid substrate. Moreover, we assume that the mound is permeable, so that vertical fluid drainage is allowed. Thus, as boundary conditions we have no slip and permeability of the mound on
 ${\it\theta}=-a$
:
 $$\begin{eqnarray}\displaystyle & \displaystyle \frac{1}{r}\left.\frac{\partial {\it\psi}}{\partial {\it\theta}}\right|_{{\it\theta}=-a}=0, & \displaystyle\end{eqnarray}$$
 $$\begin{eqnarray}\displaystyle & \displaystyle \left.-\frac{\partial {\it\psi}}{\partial r}\right|_{{\it\theta}=-a}=\frac{k_{d}}{{\it\mu}{\it\varpi}}\left.\frac{1}{r}\frac{\partial p_{m}}{\partial {\it\theta}}\right|_{{\it\theta}=-a}, & \displaystyle\end{eqnarray}$$
where
 $k_{d}$
is the permeability of the mound,
 ${\it\mu}$
is the dynamic viscosity,
 ${\it\varpi}$
is the volume fraction at the porous media and
 $p_{m}$
is the pressure inside the mound. The deposit viscosity should be high to retain approximated triangular shapes of the deposit. Thus the deposit has low permeability, i.e. the associated dimensionless parameter
 ${\it\nu}=k_{d}P/({\it\mu}LV)$
in terms of the characteristic length
 $L$
, velocity
 $V$
, and pressure
 $P$
satisfies
 ${\it\nu}\ll 1$
. The Stokes system reads
 $P={\it\mu}V/L$
, so that we deduce
 ${\it\nu}=k_{d}/L^{2}$
. At the liquid–gas interface (
 ${\it\theta}=0$
), the shear and normal stresses are imposed respectively:
 $$\begin{eqnarray}\displaystyle & \displaystyle \left.\left[-r\frac{\partial }{\partial r}\left(\frac{1}{r}\frac{\partial {\it\psi}}{\partial r}\right)+\frac{1}{r^{2}}\frac{\partial ^{2}{\it\psi}}{\partial {\it\theta}^{2}}\right]\right|_{{\it\theta}=0}=0,\qquad \quad & \displaystyle\end{eqnarray}$$
 $$\begin{eqnarray}\displaystyle & \displaystyle \left.-\left\{\frac{\partial }{\partial r}\left[\frac{1}{r}\frac{\partial ^{2}{\it\psi}}{\partial r\partial {\it\theta}}\right]+\frac{1}{r^{3}}\frac{\partial ^{3}{\it\psi}}{\partial {\it\theta}^{3}}+\frac{2}{r^{2}}\frac{\partial ^{2}{\it\psi}}{\partial {\it\theta}\partial r}\right\}+2\frac{\partial }{\partial r}\left(-\frac{1}{r}\frac{\partial ^{2}{\it\psi}}{\partial {\it\theta}\partial r}+\frac{1}{r^{2}}\frac{\partial {\it\psi}}{\partial {\it\theta}}\right)\right|_{{\it\theta}=0}=0.\qquad \quad & \displaystyle\end{eqnarray}$$
Detailed derivation of (2.10)–(2.11) will be given in appendix A.
The vapour concentration
 ${\it\varphi}$
outside the droplet satisfies a diffusion equation. Assuming that the evaporation process is slow, the diffusion equation is reduced to Laplace’s equation (Deegan et al.
Reference Deegan, Bakajin, Dupont, Huber, Nagel and Witten1997; Eggers & Pismen Reference Eggers and Pismen2010; Gelderblom et al.
Reference Gelderblom, Bloemen and Snoeijer2012; Fontelos, Hong & Hwang Reference Fontelos, Hong and Hwang2015). As boundary conditions, we impose no vapour flux across the mound wall and a vapour saturation value
 ${\it\varphi}_{s}$
at the droplet surface
 ${\it\varphi}={\it\varphi}_{s}$
. If we write
 ${\it\varphi}={\it\varphi}_{s}+{\it\phi}$
, then
 ${\it\phi}$
satisfies
 $$\begin{eqnarray}\displaystyle & \displaystyle {\rm\Delta}{\it\phi}=0\quad \text{in }0<{\it\theta}<b, & \displaystyle\end{eqnarray}$$
 $$\begin{eqnarray}\displaystyle & \displaystyle \frac{\partial {\it\phi}}{\partial {\it\theta}}=0\quad \text{on }{\it\theta}=b, & \displaystyle\end{eqnarray}$$
 $$\begin{eqnarray}\displaystyle & \displaystyle {\it\phi}=0\quad \text{on }{\it\theta}=0. & \displaystyle\end{eqnarray}$$
The kinematic boundary condition reads
 $$\begin{eqnarray}\displaystyle v_{\boldsymbol{n}} & = & \displaystyle \boldsymbol{u}\boldsymbol{\cdot }\boldsymbol{n}+C_{E}\frac{\partial {\it\phi}}{\partial \boldsymbol{n}}\nonumber\\ \displaystyle & = & \displaystyle -\frac{\partial {\it\psi}}{\partial r}+C_{E}\frac{1}{r}\frac{\partial {\it\phi}}{\partial {\it\theta}}\quad \text{on }{\it\theta}=0,\end{eqnarray}$$
where
 $\boldsymbol{n}$
is the normal vector of the interface (from the liquid to the gas),
 $v_{\boldsymbol{n}}$
is the normal velocity of the liquid–gas interface (in the direction of the normal vector) and
 $C_{E}>0$
represents relative intensity of the evaporation. To study pinning of the contact line depending on the geometry of the deposit, equation (2.15) is reduced to
 $$\begin{eqnarray}0=-\frac{\partial {\it\psi}}{\partial r}+C_{E}\frac{1}{r}\frac{\partial {\it\phi}}{\partial {\it\theta}}\quad \text{on }{\it\theta}=0.\end{eqnarray}$$
As for the flow
 $\boldsymbol{u}_{m}$
of the porous material model inside the mound, we use Darcy’s law,
 $\boldsymbol{{\rm\nabla}}\boldsymbol{\cdot }\boldsymbol{u}_{m}=0$
and
 $\boldsymbol{u}_{m}=(k_{d}/{\it\mu}{\it\varpi})\boldsymbol{{\rm\nabla}}p_{m}$
, to deduce the following system
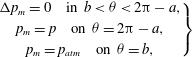 $$\begin{eqnarray}\left.\begin{array}{@{}c@{}}{\rm\Delta}p_{m}=0\quad \text{in }b<{\it\theta}<2{\rm\pi}-a,\\ p_{m}=p\quad \text{on }{\it\theta}=2{\rm\pi}-a,\\ p_{m}=p_{atm}\quad \text{on }{\it\theta}=b,\end{array}\right\}\end{eqnarray}$$
where
 $p$
is the pressure inside the droplet and
 $p_{atm}$
is the pressure of the gas phase.
3 The equilibrium configurations
We have assumed that the mound is considered as a solid substrate with the dimensionless parameter
 ${\it\nu}$
associated to the permeability
 $k_{d}$
which has low magnitude, i.e.
 ${\it\nu}\ll 1$
. Thus, the mound can retain its approximated triangular shape. Moreover, by the low permeability of the mound, the permeability effect only has the leading order near the tip of the mound. We will explain such a boundary layer property in the following lines.
By solving Laplace’s equation (2.12)–(2.14), one can see that the evaporative flux close to the contact line is
 $$\begin{eqnarray}\frac{1}{r}\frac{\partial {\it\phi}}{\partial {\it\theta}}\sim r^{({\rm\pi}/2b)-1},\end{eqnarray}$$
where we restrict
 $b>{\rm\pi}/2$
(see Deegan et al. (Reference Deegan, Bakajin, Dupont, Huber, Nagel and Witten1997) or appendix B). Thus, from the kinematic boundary condition (2.16), we are led to
 $$\begin{eqnarray}{\it\psi}(r,{\it\theta})\sim r^{{\rm\pi}/2b}.\end{eqnarray}$$
Moreover, by the Stokes system, the pressure inside the droplet satisfies
 $$\begin{eqnarray}p(r,{\it\theta})\sim r^{({\rm\pi}/2b)-2}\end{eqnarray}$$
and consequently, from (2.17), the pressure inside the mound also follows
 $$\begin{eqnarray}p_{m}(r,{\it\theta})\sim r^{({\rm\pi}/2b)-2}.\end{eqnarray}$$
Then, by the permeability condition (2.9) on
 ${\it\theta}=-a$
, we finally have
 $$\begin{eqnarray}r^{({\rm\pi}/2b)-1}\sim -\left.\frac{\partial {\it\psi}}{\partial r}\right|_{{\it\theta}=-a}=\frac{k_{d}}{{\it\mu}{\it\varpi}}\left.\frac{1}{r}\frac{\partial p_{m}}{\partial {\it\theta}}\right|_{{\it\theta}=-a}\sim {\it\nu}r^{({\rm\pi}/2b)-3}.\end{eqnarray}$$
Therefore, a boundary layer occurs in the region of
 $r\sim {\it\nu}^{1/2}$
. Inside this region the permeability condition (2.9) influences the velocity field, however outside this region, since we have assumed that
 ${\it\nu}\ll 1$
, we can consider
 ${\it\nu}\rightarrow 0$
so that the boundary conditions (2.8) and (2.9) can be replaced by the no-slip and non-penetrate conditions:
 $$\begin{eqnarray}\left.\frac{1}{r}\frac{\partial {\it\psi}}{\partial {\it\theta}}\right|_{{\it\theta}=-a}=0,\quad \left.-\frac{\partial {\it\psi}}{\partial r}\right|_{{\it\theta}=-a}=0.\end{eqnarray}$$
The main cause of the mound growth near the tip is the permeability effect. However, the whole shape of the mound and the velocity field are not affected by the permeability effect. Hence, it is enough to deduce possible approximated shapes of the mound and the velocity field for the case of
 ${\it\nu}=0$
. The mound growth near the tip will be explained in § 4.
We will now deduce the equilibrium configurations for
 ${\it\nu}=0$
. These equilibriums imply pinning of the contact line and give a mechanism of the deposit growth.
The vapour concentration
 ${\it\phi}$
solves (2.12)–(2.14). The stream function
 ${\it\psi}$
solves (2.7), (2.10)–(2.11), and (3.6). By using these solutions, one can see the non-trivial solution
 $({\it\phi},{\it\psi})=({\it\phi}_{0},{\it\psi}_{0})$
and the angles
 $(a,b)$
generated by the stationary kinematic condition (2.16) such that
 $$\begin{eqnarray}\displaystyle & \displaystyle {\it\phi}_{0}(r,{\it\theta})=Er^{{\rm\pi}/2b}\cos \left(\frac{{\rm\pi}(b-{\it\theta})}{2b}\right), & \displaystyle\end{eqnarray}$$
 $$\begin{eqnarray}\displaystyle {\it\psi}_{0}(r,{\it\theta}) & = & \displaystyle \frac{1}{4b}C_{E}E{\rm\pi}r^{{\rm\pi}/2b}\left[\cos \left(\left(-2+\frac{{\rm\pi}}{2b}\right){\it\theta}\right)-\frac{({\rm\pi}-4b)\cos \left({\displaystyle \frac{{\rm\pi}{\it\theta}}{2b}}\right)}{{\rm\pi}}\right.\nonumber\\ \displaystyle & & \displaystyle -\,\frac{({\rm\pi}-4b)\left(\sin \left(a\left(-2+{\displaystyle \frac{{\rm\pi}}{2b}}\right)\right)-\sin \left({\displaystyle \frac{{\rm\pi}a}{2b}}\right)\right)\sin \left(\left(-2+{\displaystyle \frac{{\rm\pi}}{2b}}\right){\it\theta}\right)}{({\rm\pi}-4b)\cos \left(a\left(-2+{\displaystyle \frac{{\rm\pi}}{2b}}\right)\right)-{\rm\pi}\cos \left({\displaystyle \frac{{\rm\pi}a}{2b}}\right)}\nonumber\\ \displaystyle & & \displaystyle +\left.\frac{({\rm\pi}-4b)\left[\sin \left(a\left(-2+{\displaystyle \frac{{\rm\pi}}{2b}}\right)\right)-\sin \left({\displaystyle \frac{{\rm\pi}a}{2b}}\right)\right]\sin \left({\displaystyle \frac{{\rm\pi}{\it\theta}}{2b}}\right)}{({\rm\pi}-4b)\cos \left(a\left(-2+{\displaystyle \frac{{\rm\pi}}{2b}}\right)\right)-{\rm\pi}\cos \left({\displaystyle \frac{{\rm\pi}a}{2b}}\right)}\right],\end{eqnarray}$$
where the values of the angles
 $(a,b)$
are merely determined by
 $$\begin{eqnarray}\displaystyle & & \displaystyle \displaystyle 8\left(\frac{{\rm\pi}}{2b}-2\right)\left(\frac{{\rm\pi}}{2b}-1\right)^{2}\left(\frac{{\rm\pi}}{2b}\right)^{2}\nonumber\\ \displaystyle & & \displaystyle \quad \times \left[-\frac{{\rm\pi}}{2b}\left(\frac{{\rm\pi}}{2b}-2\right)+\left(\frac{{\rm\pi}}{2b}-1\right)^{2}\cos (2a)+\cos \left(2a\left(\frac{{\rm\pi}}{2b}-1\right)\right)\right]=0.\qquad\end{eqnarray}$$
We remark that
 $E<0$
and
 $C_{E}>0$
. Moreover, because of
 $b>{\rm\pi}/2$
, the velocity field near the contact line has enough capacity to produce the deposit growth. In figure 2, we represent a typical flow pattern given by (3.8). Detailed derivation of (3.7)–(3.9) will be given in appendix C. Figure 6 describes (3.9) with the result of our stability analysis.
A streamline plot of the solution (3.8) for
 $a=1.52578\simeq 87.4^{\circ }$
and
 $b=3.97201\simeq 227.6^{\circ }$
.

4 Deposit growth with the permeability effect
We assume that the solute is carried along by the velocity field inside the droplet. We have seen in § 3, by using the boundary layer property for
 ${\it\nu}\ll 1$
, that the normal flux into the mound is dominant close to the tip of the mound. Thus, the deposit growth near the tip is consistent with the magnitude of the normal velocity adjacent to the mound. The permeability boundary condition (2.9) reads
 $$\begin{eqnarray}\boldsymbol{u}\boldsymbol{\cdot }\boldsymbol{n}={\it\nu}\frac{\partial p_{m}}{\partial \boldsymbol{n}}={\it\nu}\frac{\partial p}{\partial \boldsymbol{n}}\end{eqnarray}$$
on the boundary close to the liquid. By the Stokes system, we have
 $$\begin{eqnarray}\frac{\partial p}{\partial \boldsymbol{n}}\propto {\rm\Delta}\boldsymbol{u}\boldsymbol{\cdot }\boldsymbol{n}.\end{eqnarray}$$
Moreover,
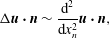 $$\begin{eqnarray}{\rm\Delta}\boldsymbol{u}\boldsymbol{\cdot }\boldsymbol{n}\sim \frac{\text{d}^{2}}{\text{d}x_{n}^{2}}\boldsymbol{u}\boldsymbol{\cdot }\boldsymbol{n},\end{eqnarray}$$
where
 $x_{n}$
is the distance from the boundary toward the liquid. Therefore, we are finally led to the following ordinary differential equation for
 $\boldsymbol{u}\boldsymbol{\cdot }\boldsymbol{n}$
,
 $$\begin{eqnarray}{\it\nu}\frac{\text{d}^{2}}{\text{d}x_{n}^{2}}\boldsymbol{u}\boldsymbol{\cdot }\boldsymbol{n}-\boldsymbol{u}\boldsymbol{\cdot }\boldsymbol{n}=0\end{eqnarray}$$
whose solution is
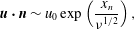 $$\begin{eqnarray}\boldsymbol{u}\boldsymbol{\cdot }\boldsymbol{n}\sim u_{0}\exp \left(\frac{x_{n}}{{\it\nu}^{1/2}}\right),\end{eqnarray}$$
where
 $u_{0}$
is determined by matching to the outer solutions. Consequently, from the equilibrium solution (3.8), we have
 $$\begin{eqnarray}u_{0}\sim r^{({\rm\pi}/2b)-1},\end{eqnarray}$$
so that the normal flux
 $\boldsymbol{u}\boldsymbol{\cdot }\boldsymbol{n}$
is larger at the tip than at the basement of the mound. The exponential decay given by (4.5) indicates rapid slowing down of the flow near the mound. Hence, a larger number of deposit particles carried by the flow will be placed at the tip. Therefore, if we ignore other effects such as lateral motion of the deposit particles along the mound’s edge (induced by gravity, for instance), the mound will tend to be sharper. This yields a mechanism of the deposit growth which is schematically represented in figures 3 and 4.
The direction of the velocity field close to the tip, which has the permeability effect. The dashed line is a unique straight line satisfying
 $u_{{\it\theta}}=-\partial {\it\psi}_{0}/\partial r=0$
so that there merely exists a radial velocity toward the tip. By the symmetry, opposite directional flows occur in the each region
 $A$
and
 $B$
. In both regions, the magnitude of the velocity increases as approaching to the tip.

A schematic figure that describes how the deposit grows sharper. The growth amount is proportional to the magnitude of the velocity field. Therefore, the angle of the subsequent deposit is lower than that of the previous one.

The dashed line in figure 3 is a straight line such that
 $\partial {\it\psi}_{0}/\partial r=0$
holds. For each angle
 $a$
satisfying the solvability condition (3.9), we can construct a unique straight line for
 $\partial {\it\psi}_{0}/\partial r=0$
. On such lines, a radial velocity merely exists, which has a direction toward the contact line. The dashed line of
 $\partial {\it\psi}_{0}/\partial r=0$
divides the liquid phase near the tip into the two regions, i.e.
 $A$
and
 $B$
in figure 3. In region
 $A$
, the permeability effect produces the velocity field which has the normal flux
 $\boldsymbol{u}\boldsymbol{\cdot }\boldsymbol{n}$
into the mound side. Then, by symmetry, region
 $B$
has the velocity field approaching the liquid–gas interface. A subsequent deposit can be shaped by these opposite directional flows whose magnitude increases as converging to the tip. Therefore, a sharper deposit is set continuously. A schematic description about the formation of a sharper deposit is given in figure 4.
5 The evolution equation
We deduce an evolution equation to study stability of the equilibrium configurations (3.7)–(3.9). Write
 ${\it\phi}={\it\phi}_{0}+{\it\epsilon}{\it\phi}_{1}$
,
 ${\it\psi}={\it\psi}_{0}+{\it\epsilon}{\it\psi}_{1}$
, and
 $y={\it\epsilon}f(r,t)$
as a time-dependent interface near the equilibrium interface
 ${\it\theta}=0$
. The perturbed solutions
 ${\it\phi}_{1}$
and
 ${\it\psi}_{1}$
satisfy Laplace’s equation (2.12) and the biharmonic equation (2.7), respectively, as
 ${\it\epsilon}\rightarrow 0$
:
 $$\begin{eqnarray}\displaystyle & \displaystyle {\rm\Delta}{\it\phi}_{1}=0\quad \text{in }0<{\it\theta}<b, & \displaystyle\end{eqnarray}$$
 $$\begin{eqnarray}\displaystyle & \displaystyle {\rm\Delta}^{2}{\it\psi}_{1}=0\quad \text{in }-a<{\it\theta}<0. & \displaystyle\end{eqnarray}$$
The corresponding boundary conditions for
 ${\it\phi}_{1}$
and
 ${\it\psi}_{1}$
to the leading order in
 ${\it\epsilon}$
are
 $$\begin{eqnarray}\displaystyle & \displaystyle E\cdot r^{({\rm\pi}/2b)-1}\frac{{\rm\pi}}{2b}f+{\it\phi}_{1}=0\quad \text{on }{\it\theta}=0, & \displaystyle\end{eqnarray}$$
 $$\begin{eqnarray}\displaystyle & \displaystyle \frac{\partial {\it\phi}_{1}}{\partial {\it\theta}}=0\quad \text{on }{\it\theta}=b, & \displaystyle\end{eqnarray}$$
 $$\begin{eqnarray}\displaystyle & \displaystyle -\frac{4}{r^{3}}\frac{\partial {\it\psi}_{1}}{\partial {\it\theta}}-\frac{1}{r^{3}}\frac{\partial ^{3}{\it\psi}_{1}}{\partial {\it\theta}^{3}}+\frac{3}{r^{2}}\frac{\partial ^{2}{\it\psi}_{1}}{\partial r\partial {\it\theta}}-\frac{3}{r}\frac{\partial ^{3}{\it\psi}_{1}}{\partial r^{2}\partial {\it\theta}}=\frac{{\it\sigma}}{{\it\mu}}\frac{\partial ^{3}f}{\partial r^{3}},\quad {\it\theta}=0, & \displaystyle\end{eqnarray}$$
 $$\begin{eqnarray}\displaystyle & \displaystyle -4C_{E}E\left(\frac{{\rm\pi}}{2b}-1\right)r^{({\rm\pi}/2b)-2}\frac{\partial f}{\partial r}G(a,b)+\frac{1}{r}\frac{\partial {\it\psi}_{1}}{\partial r}+\frac{1}{r^{2}}\frac{\partial ^{2}{\it\psi}_{1}}{\partial {\it\theta}^{2}}-\frac{\partial ^{2}{\it\psi}_{1}}{\partial r^{2}}=0,\quad {\it\theta}=0,\qquad & \displaystyle\end{eqnarray}$$
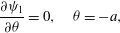 $$\begin{eqnarray}\displaystyle & \displaystyle \frac{\partial {\it\psi}_{1}}{\partial {\it\theta}}=0,\quad {\it\theta}=-a, & \displaystyle\end{eqnarray}$$
 $$\begin{eqnarray}\displaystyle & \displaystyle \frac{\partial {\it\psi}_{1}}{\partial r}=0,\quad {\it\theta}=-a, & \displaystyle\end{eqnarray}$$
where
 $$\begin{eqnarray}G(a,b)=\frac{(4b-{\rm\pi}){\rm\pi}\left[\sin \left(a\left({\displaystyle \frac{{\rm\pi}}{2b}}-2\right)\right)-\sin \left({\displaystyle \frac{{\rm\pi}a}{2b}}\right)\right]}{2b\left[(4b-{\rm\pi})\cos \left(a\left({\displaystyle \frac{{\rm\pi}}{2b}}-2\right)\right)+{\rm\pi}\cos \left({\displaystyle \frac{{\rm\pi}a}{2b}}\right)\right]}.\end{eqnarray}$$
The kinematic boundary condition
 $$\begin{eqnarray}v_{\boldsymbol{n}}=\boldsymbol{u}\boldsymbol{\cdot }\boldsymbol{n}+C_{E}\frac{\partial {\it\phi}}{\partial \boldsymbol{n}}\quad \text{on }y={\it\epsilon}f(r,t)\end{eqnarray}$$
can be linearized when
 ${\it\epsilon}\ll 1$
and hence written as follows:
 $$\begin{eqnarray}\frac{\partial f}{\partial t}=-C_{E}E\cdot G(a,b)r^{({\rm\pi}/2b)-1}\frac{\partial f}{\partial r}+C_{E}\frac{1}{r}\frac{\partial {\it\phi}_{1}}{\partial {\it\theta}}-\frac{\partial {\it\psi}_{1}}{\partial r},\quad {\it\theta}=0,r>0.\end{eqnarray}$$
We now apply the
 ${\it\alpha}$
-Mellin transform to (5.11) to perform stability analysis. The transform procedure will be given in appendix D. Finally we deduce the transformed evolution equation
 $$\begin{eqnarray}\widetilde{{\displaystyle \frac{\partial ^{2}f}{\partial t\partial r}}}^{{\it\alpha}+2}=C\unicode[STIX]{x1D648}({\it\lambda})\widetilde{\left(r^{({\rm\pi}/2b)-1}{\displaystyle \frac{\partial f}{\partial r}}\right)}^{{\it\alpha}+1}+\frac{{\it\sigma}}{2{\it\mu}}N({\it\lambda})\widetilde{{\displaystyle \frac{\partial f}{\partial r}}}^{{\it\alpha}+1}\quad \text{on }{\it\theta}=0,\end{eqnarray}$$
where
 $C=C_{E}E$
has the dimension of a velocity,
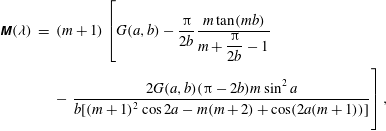 $$\begin{eqnarray}\displaystyle \unicode[STIX]{x1D648}({\it\lambda}) & = & \displaystyle (m+1)\left[G(a,b)-\frac{{\rm\pi}}{2b}\frac{m\tan (mb)}{m+{\displaystyle \frac{{\rm\pi}}{2b}}-1}\right.\nonumber\\ \displaystyle & & \displaystyle -\left.\frac{2G(a,b)({\rm\pi}-2b)m\sin ^{2}a}{b[(m+1)^{2}\cos 2a-m(m+2)+\cos (2a(m+1))]}\vphantom{\frac{m\tan (mb)}{m+{\displaystyle \frac{{\rm\pi}}{2b}}-1}}\right],\end{eqnarray}$$
 $$\begin{eqnarray}\displaystyle & \displaystyle N({\it\lambda})=(m+1)\left[\frac{\sin (2a(m+1))-(m+1)\sin 2a}{(m+1)^{2}\cos 2a-m(m+2)+\cos (2a(m+1))}\right], & \displaystyle\end{eqnarray}$$
with
 $m=\text{i}{\it\lambda}+{\it\alpha}+1/2$
.
6 Matching the equilibrium configurations to apparent contact angles
The velocity field inside the droplet does not influence the shape of the droplet and the shape is determined by surface tension, when the capillary number has a tiny value. Such a case has been studied by a precise model in Popov (Reference Popov2005). If the contact line is prescribed and pinned, the droplet shape satisfies the Young–Laplace equation
 $$\begin{eqnarray}2{\it\kappa}=-\frac{{\rm\Delta}P}{{\it\sigma}},\end{eqnarray}$$
where
 ${\rm\Delta}P$
is the pressure difference across the liquid–gas interface. It defines the equilibrium shape at any given time. For instance, if the pinned contact line is a circle, the droplet shape is just a spherical cap. Moreover, by the pinned contact line and the Young–Laplace equation, the apparent contact angle is varying and decreasing in time. The decreasing contact angle have been considered as the hinge condition near the contact line in Gelderblom et al. (Reference Gelderblom, Bloemen and Snoeijer2012).
Surface inhomogeneities or chemical heterogeneities influence whether the contact line is pinned or not. In § 3, we have deduced the equilibrium configurations which can be interpreted as pinning of the contact line. It means that the presence of the deposit can be a possibility of the contact line pinning. Therefore, the crossover between the region of the varying apparent contact angles and the region of the equilibrium configurations should be explained. We will deduce how such a crossover can be worked.
The crossover is guaranteed by the existence of a stationary solution
 $f_{s}(r)$
to the evolution equation (5.11) with a different contact angle at infinity. A stationary solution
 $f_{s}(r)$
satisfies
 $$\begin{eqnarray}-C_{E}E\cdot G(a,b)r^{({\rm\pi}/2b)-1}\frac{\partial f_{s}}{\partial r}+C_{E}\frac{1}{r}\frac{\partial {\it\phi}_{1}}{\partial {\it\theta}}-\frac{\partial {\it\psi}_{1}}{\partial r}=0,\quad {\it\theta}=0,r>0\end{eqnarray}$$
as well as the boundary conditions for the normal and tangential stress on the interface:
 $$\begin{eqnarray}\displaystyle & \displaystyle \boldsymbol{n}\unicode[STIX]{x1D64F}[\boldsymbol{u},p]\boldsymbol{n}=-{\it\sigma}{\it\kappa}={\it\sigma}{\it\epsilon}\frac{\partial ^{2}f_{s}}{\partial r^{2}}\left[1+\left({\it\epsilon}\frac{\partial f_{s}}{\partial r}\right)^{2}\right]^{-3/2} & \displaystyle\end{eqnarray}$$
 $$\begin{eqnarray}\displaystyle & \displaystyle \boldsymbol{t}\unicode[STIX]{x1D64F}[\boldsymbol{u},p]\boldsymbol{n}=0. & \displaystyle\end{eqnarray}$$
Equation (6.3) can be viewed as an integro-differential equation for
 $f_{s}$
in the following sense:
 $\boldsymbol{u}$
can be obtained, by solving the corresponding equations with the boundary conditions given (6.2) and (6.4), in terms of integrals involving Green’s functions that depend on the geometry i.e. on
 $f_{s}(r)$
. Although the corresponding analysis is highly involved, it is simple to analyse the asymptotics of the solutions and in this way we can match with the asymptotics described in Gelderblom et al. (Reference Gelderblom, Bloemen and Snoeijer2012) for the flow away from the contact line. Since the geometry away from the contact line is expected to be a corner of the angle
 ${\it\theta}_{0}$
, we have to solve the following problem in order to find the correct asymptotics for
 ${\it\psi}_{1}(r,{\it\theta})$
:
 $$\begin{eqnarray}\displaystyle & \displaystyle {\rm\Delta}^{2}{\it\psi}_{1}=0\quad \text{in }0<{\it\theta}<{\it\theta}_{0} & \displaystyle\end{eqnarray}$$
 $$\begin{eqnarray}\displaystyle & \displaystyle \frac{\partial {\it\psi}_{1}}{\partial r}=-C_{E}E\cdot G(a,b)r^{({\rm\pi}/2b)-1}\frac{\partial f_{s}}{\partial r}+C_{E}\frac{1}{r}\frac{\partial {\it\phi}_{1}}{\partial {\it\theta}},\quad {\it\theta}=0, & \displaystyle\end{eqnarray}$$
 $$\begin{eqnarray}\displaystyle & \displaystyle \frac{1}{r}\frac{\partial {\it\psi}_{1}}{\partial r}+\frac{1}{r^{2}}\frac{\partial ^{2}{\it\psi}_{1}}{\partial {\it\theta}^{2}}-\frac{\partial ^{2}{\it\psi}_{1}}{\partial r^{2}}=0,\quad {\it\theta}=0, & \displaystyle\end{eqnarray}$$
 $$\begin{eqnarray}\displaystyle & \displaystyle \frac{\partial {\it\psi}_{1}}{\partial {\it\theta}}=0,\quad {\it\theta}=-{\it\theta}_{0}, & \displaystyle\end{eqnarray}$$
 $$\begin{eqnarray}\displaystyle & \displaystyle \frac{\partial {\it\psi}_{1}}{\partial r}=0,\quad {\it\theta}=-{\it\theta}_{0}. & \displaystyle\end{eqnarray}$$
Near the mound, the stream function
 ${\it\psi}_{1}$
will solve the same system with
 ${\it\theta}=-{\it\theta}_{0}$
replaced by
 ${\it\theta}=-a$
. Both near the origin and far away from the mound,
 ${\it\psi}_{1}$
will be sum of the homogeneous solution
 ${\it\psi}_{1h}$
(with zero right hand side at (6.6)) and the non-homogeneous contribution
 ${\it\psi}_{1n}$
which, by simple dimensional arguments, is
 ${\it\psi}_{1n}=O(r^{{\rm\pi}/2b})$
. On the other hand, we seek for
 ${\it\psi}_{1h}$
in the following form: write
 $$\begin{eqnarray}\displaystyle & \displaystyle {\it\psi}_{1h}(r,{\it\theta})=C_{1}r^{{\it\delta}_{1}}g_{1}({\it\theta})\quad \text{as }r\rightarrow 0, & \displaystyle\end{eqnarray}$$
 $$\begin{eqnarray}\displaystyle & \displaystyle {\it\psi}_{1h}(r,{\it\theta})=C_{2}r^{{\it\delta}_{2}}g_{2}({\it\theta})\quad \text{as }r\rightarrow \infty & \displaystyle\end{eqnarray}$$
and solve the homogeneous system which yields the following equation for the exponents
 ${\it\delta}_{i}$
,
 $i=1,2$
:
 $$\begin{eqnarray}-4({\it\delta}_{i}-1){\it\delta}_{i}^{2}[\sin (({\it\delta}_{i}-1)2{\it\alpha})-({\it\delta}_{i}-1)\sin 2{\it\alpha}]=0,\end{eqnarray}$$
where
 ${\it\alpha}$
is the opening angle, i.e.
 $a$
for
 $r\rightarrow 0$
and
 ${\it\theta}_{0}$
for
 $r\rightarrow \infty$
. In figure 5 we represent the
 ${\it\delta}_{i}-1$
versus
 ${\it\alpha}$
, neglecting the trivial lines
 ${\it\delta}_{i}=0$
, 1, 2. If we choose
 ${\it\delta}_{1}$
such that
 ${\it\delta}_{1}-1-{\rm\pi}/2b>0$
and
 ${\it\delta}_{2}$
such that
 ${\it\delta}_{2}-1-{\rm\pi}/2b<0$
(note that both choices are possible according to figure 5) we find that the homogeneous contributions to
 ${\it\psi}_{1}$
are dominant with respect to
 ${\it\psi}_{1n}$
both at the origin and at infinity. Hence, according to (6.3) and since
 ${\it\delta}_{2}-1<0$
, we deduce
 $$\begin{eqnarray}\frac{\partial ^{2}f_{s}}{\partial r^{2}}=O(r^{{\it\delta}_{2}-1})\rightarrow 0\quad \text{as }r\rightarrow \infty ,\end{eqnarray}$$
so that
 $f_{s}(r)$
is asymptotically linear at infinity. The slope should be such that the angle with respect to the substrate is
 ${\it\theta}_{0}$
. Determining the constant
 $C_{2}$
in (6.11), and the
 $C_{1}$
in (6.10) a function of it, such that the angle
 ${\it\theta}_{0}$
is prescribed, represents a difficult mathematical problem that we do not attempt to solve here. Our aim is to show the consistency of our approach with previous studies (e.g. Gelderblom et al.
Reference Gelderblom, Bloemen and Snoeijer2012).
The thick line is the values of
 ${\it\delta}_{1}-1$
or
 ${\it\delta}_{2}-1$
which make
 ${\it\psi}_{1h}$
be non-trivial solutions. The dashed line is the value of
 ${\rm\pi}/2b$
. For each angle
 $a$
, we choose
 ${\it\delta}_{1}-1$
on the right thick line of the dashed line and
 ${\it\delta}_{2}-1$
on the left thick line of the dashed line.

7 Results: stability and the pinned–unpinned transition
The length of the liquid–gas interface from the tip of the mound is
 $$\begin{eqnarray}\int _{0}^{r_{0}}\sqrt{1+\left|{\it\epsilon}\frac{\partial f}{\partial r}(r,t)\right|^{2}}\,\text{d}r\sim r_{0}+\frac{1}{2}\int _{0}^{r_{0}}\left|{\it\epsilon}\frac{\partial f}{\partial r}(r,t)\right|^{2}\,\text{d}r+O({\it\epsilon}^{4})\end{eqnarray}$$
for any constant
 $r_{0}>0$
and a sufficiently small
 ${\it\epsilon}>0$
. Here,
 $r_{0}$
is the length of the equilibrium configurations
 ${\it\theta}=0$
from the tip. Therefore, if
 $$\begin{eqnarray}\int _{0}^{r_{0}}\left|\frac{\partial f}{\partial r}(r,t)\right|^{2}\,\text{d}r<\infty \quad \text{in time},\end{eqnarray}$$
we can conclude that the corresponding equilibrium configuration is stable.
By looking at equation (5.12), we recognize that the parameters
 $C$
and
 ${\it\sigma}{\it\mu}^{-1}$
multiply the two terms on the right-hand side, respectively. The first term is due to the evaporation and the second is due to the surface tension. If
 $C$
is only present, i.e.
 ${\it\sigma}=0$
, the evaporation is a dominant mechanism. Otherwise, if
 ${\it\sigma}$
is present with
 $C=0$
, then the surface tension is dominant. We will refer to these particular cases as the evaporation-dominated and the surface-tension-dominated limits. We will discuss the two limits and consider the combined effect of the evaporation and the surface tension in the following subsections.
A plot for the solvability condition (3.9) when substituting
 $2{\rm\pi}-a-c$
into
 $b$
. In the evaporation-dominated limit, the threshold of the stability is the point between the thick line and the thin line, where
 $c=0.78706752635\simeq 45.1^{\circ }$
. The thick line represents stable configurations.

7.1 The surface-tension-dominated limit
From (5.12) with
 $C=0$
, the following equation is reduced
 $$\begin{eqnarray}\widetilde{\frac{\partial ^{2}f}{\partial t\partial r}}^{{\it\alpha}+2}=\frac{{\it\sigma}}{2{\it\mu}}N({\it\lambda})\widetilde{\frac{\partial f}{\partial r}}^{{\it\alpha}+1}.\end{eqnarray}$$
Using appendix F and Lemma E.1, we arrive at
 $$\begin{eqnarray}\int _{0}^{\infty }\left|\frac{\partial f}{\partial r}(r,t)\right|^{2}\,\text{d}r<\infty \quad \text{in time.}\end{eqnarray}$$
Thus, the liquid–gas interface is always stable for any of equilibrium configurations. The result is of course expected from the surface tension, which usually plays the role of a stabilizing force.
7.2 The evaporation-dominated limit
When the surface tension is neglected, we have the equation
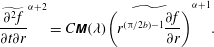 $$\begin{eqnarray}\widetilde{\frac{\partial ^{2}f}{\partial t\partial r}}^{{\it\alpha}+2}=C\unicode[STIX]{x1D648}({\it\lambda})\widetilde{\left(r^{({\rm\pi}/2b)-1}\frac{\partial f}{\partial r}\right)}^{{\it\alpha}+1}.\end{eqnarray}$$
By applying Lemma E.1 to (F 2) and substituting
 $2{\rm\pi}-a-c$
into
 $b$
, we conclude that the threshold for the stability, i.e.
 $\text{Re}\,\unicode[STIX]{x1D648}({\it\lambda})$
to be non-negative, is the point between the thick line and the thin line in figure 6 such that
 $c=0.78706752635\simeq 45.1^{\circ }$
. The thick line and the thin line in figure 6 represent the stable configurations and the unstable configurations, respectively, in the evaporation-dominated limit.
7.3 The combined effect of the evaporation and the surface tension
Using the
 ${\it\alpha}$
-Mellin transform, we deduce the following integral equation from (5.12): let
 $h:=\partial f/\partial r$
, then
 $$\begin{eqnarray}\frac{\text{d}}{\text{d}t}\int _{0}^{\infty }h^{2}\,\text{d}r=\frac{1}{2{\rm\pi}}\int _{-\infty }^{\infty }\,\text{d}{\it\lambda}\left(C\unicode[STIX]{x1D648}({\it\lambda})|\widetilde{h}^{({\rm\pi}/4b)-1}|^{2}+\frac{{\it\sigma}}{2{\it\mu}}N({\it\lambda})|\widetilde{h}^{-1/2}|^{2}\right)\equiv I[h].\end{eqnarray}$$
By changing the value of
 $Ca^{-1}={\it\sigma}/2{\it\mu}|C|$
, we find the stable regime satisfying
 $$\begin{eqnarray}\min _{\int f=0}(-I[h])>0.\end{eqnarray}$$
Here, we use a polynomial approximation method such that
 $h(r)$
is assumed to be
 $h(r)=\text{e}^{-r}\sum _{k=1}^{n}a_{k}r^{k}$
. Then the
 ${\it\alpha}$
-Mellin transform of
 $h$
can be expressed as a linear combination of Gamma functions, and hence
 $-I[h]$
is a quadratic form in
 $\{a_{1},a_{2},\ldots ,a_{n}\}$
varied to minimize. By letting
 $n=9$
, we compute the result in figure 7.
The stability relation between
 $\mathit{Ca}^{-1}$
and
 $c$
. The angle
 $a$
can be obtained from
 $c$
by the plot in figure 6.

7.4 Concluding remarks
The result of the combined effect in figure 7 implies that if the capillary number
 $\mathit{Ca}$
becomes small, then the threshold for the stability will be moved to some point in the left along the thin line in figure 6. During the contact line is pinned, the deposit grows and, as argued in § 4, the angle
 $c$
of the deposit is getting smaller. Moreover, the angle
 $c$
follows the equilibrium configurations. Consequently, after the angle
 $c$
passes through the stability threshold, depinning of the contact line occurs.
The energy difference between the surface tension and the evaporation process influences the behaviour of the evolution equation (5.11) or its transformed one (5.12). Let
 ${\rm\Delta}L$
denote the interfacial energy, or the length difference between an equilibrium configuration and its perturbed interface,
 $$\begin{eqnarray}{\rm\Delta}L=\left|\int _{0}^{r_{0}}\sqrt{1+\left|{\it\epsilon}\frac{\partial f}{\partial r}(r,t)\right|^{2}}\,\text{d}r-r_{0}\right|\end{eqnarray}$$
for any constant
 $r_{0}>0$
. Then the evolution equation (5.11) or (5.12) can be interpreted as
 $$\begin{eqnarray}\frac{\text{d}}{\text{d}t}{\rm\Delta}L=V_{e}+V_{{\it\sigma}},\end{eqnarray}$$
where
 $V_{e}$
is the dimension of the velocity determined by the evaporation and
 $V_{{\it\sigma}}$
is the dimension of the velocity determined by the surface tension. Some properties of
 $V_{e}$
and
 $V_{{\it\sigma}}$
can be explained as follows. The dimension term
 $V_{e}$
has a tendency to squash the interface in the horizontal direction. Since
 $V_{e}$
is constructed from the terms consisting of
 $r^{({\rm\pi}/2b)-1}$
, the magnitude of
 $V_{e}$
increases when the angle
 $b$
is larger. By the result in § 7.1 one can see that
 $V_{{\it\sigma}}$
always has a negative value. Thus,
 $V_{{\it\sigma}}$
and
 $V_{e}$
correspond to the energy dissipation and supply, respectively. These properties conclude that the bigger
 $a$
is stable but the smaller
 $a$
is unstable, when
 $c$
has a same value in the equilibrium plot of figure 6.
7.5 Overview of the process
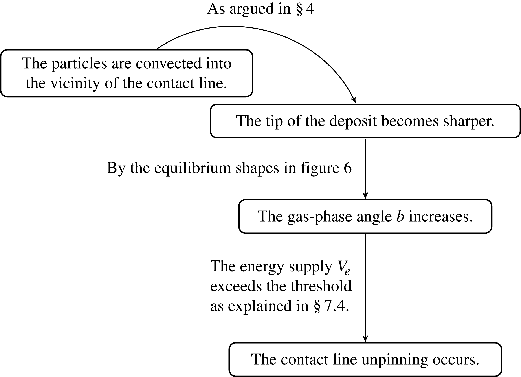
We now explain the process of the pinned–unpinned transition within the results of our analysis. A sessile droplet containing non-volatile particles, whose contact line is pinned, evaporates, and as a result the particles begin to accumulate near the contact line, studied by Deegan et al. (Reference Deegan, Bakajin, Dupont, Huber, Nagel and Witten1997). The tip of the deposit is wedge-shaped and it becomes sharper and sharper while the particles are deposited as explained in § 4. When the sharpness of the tip exceeds some critical point, i.e. the angle
 $c$
of the tip enters the unstable line described in figures 6 and 7, rupture or a jump of the contact line represented as the instability of the liquid interface in our analysis occurs. We have introduced the cause of the stability–instability by using the energy description in the § 7.4. The equilibrium shapes plotted in figure 6 shows that the sharpness of the tip (low values of the angle
 $c$
) corresponds to large values of the angle
 $b$
of the gas phase. The energy supply
 $V_{e}$
by the evaporation increases when the angle
 $b$
becomes larger, because
 $V_{e}$
is deduced from the terms involving powers of the order
 $r^{({\rm\pi}/2b)-1}$
which implies the singular evaporative flux. To sum up, we give the following diagram that explains the process briefly:
Further references supporting the implication of our analysis can be found. In Bodiguel et al. (Reference Bodiguel, Doumenc and Guerrier2009, Reference Bodiguel, Doumenc and Guerrier2010) the authors studied the relation between the deposit geometry and the pinning force. They found that, in the stick–slip regime, the pinning force grows, up to some value before it vanishes instantaneously, during the accumulation of the particles, and it is proportional to the deposit slope. On the other hand, it was found in Morales et al. (Reference Morales, Parlange, Wu, Perez-Reche, Zhang, Sang and Steenhuis2013) that increasing surfactant concentration (thus, decreasing surface tension) causes unpinning of the contact line. It can be compared with figure 7 and the energy description, because our result indicates that low values of surface tension reduce the energy barrier of the instability.
8 Discussion
We have deduced the equilibrium configurations with the wedge deposit, which can describe pinning of the contact line when the evaporative flux exists. To study the dependence of the contact line pinning on the deposit shape, we have assumed that the deposit is a new solid substrate. Moreover, porous material properties of the deposit have been considered to allow vertical liquid drainage. By applying such a penetration condition with low permeability, we have explained how the deposit grows and gets sharper.
The derived equilibrium configurations have fixed wedge shapes. Thus, a possibility of matching the equilibrium wedges to outer solutions have been studied in § 6. An example of outer solutions can be found in Gelderblom et al. (Reference Gelderblom, Bloemen and Snoeijer2012) which consider the decreasing apparent contact angles.
Our criteria for pinning and depinning of the contact line are based on the energy dissipation/supply mechanism. As discussed in § 7.4, when the energy supply exceeds some point of
 $V_{e}+V_{{\it\sigma}}>0$
, depinning occurs. However, it is not a trivial task to derive the inverse
 ${\it\alpha}$
-Mellin transform equations of (5.12). Hence, finding explicit formulae for the corresponding energy might be limited.
The equilibrium configurations lead the diverging energy dissipation (merely related to the leading-order solution
 ${\it\phi}_{0}$
and
 ${\it\psi}_{0}$
) near the tip of the mound, because the configurations are constructed by (2.16) with the diverging evaporative flux
 $(1/r)(\partial {\it\phi}/\partial {\it\theta})\sim r^{({\rm\pi}/2b)-1}$
, where
 $b>{\rm\pi}/2b$
. Note that the energy dissipation of the wedge configurations is more singular than the moving contact line paradox by Huh & Scriven (Reference Huh and Scriven1971). Regularization near the tip should be explained.
Acknowledgements
The authors are grateful to the anonymous referees for their careful reading and valuable comments on this paper. M.A.F. is partially supported by MTM2014-57158-R from the Spanish research agency. H.J.H. is partially supported by (2015R1A2A2A0100251, 2013053914) from the National Research Foundation of Korea (NRF).
Appendix A. The stress-balance equations
The stress-balance condition between the viscous stress and the surface tension at the liquid–gas interface is
 $$\begin{eqnarray}\unicode[STIX]{x1D64F}[\boldsymbol{u},p]\boldsymbol{n}=-{\it\sigma}{\it\kappa}\boldsymbol{n},\end{eqnarray}$$
where
 $p$
is the pressure field inside the liquid,
 ${\it\kappa}$
is the mean curvature of the interface,
 ${\it\sigma}$
is the surface tension coefficient,
 $\boldsymbol{n}$
is the normal vector of the interface (from the liquid to the gas) and
 $(\unicode[STIX]{x1D64F}[\boldsymbol{u},p])_{ij}=-p{\it\delta}_{ij}+{\it\mu}(\partial u_{i}/\partial x_{j}+\partial u_{j}/\partial x_{i})$
is the viscous stress tensor. In the polar coordinate system, equation (A 1) near the contact line can be rewritten as follows: the shear and normal stresses are defined by
 $$\begin{eqnarray}{\it\sigma}_{r{\it\theta}}={\it\mu}\left[r\frac{\partial }{\partial r}\left(\frac{u_{{\it\theta}}}{r}\right)+\frac{1}{r}\frac{\partial u_{r}}{\partial {\it\theta}}\right]=0,\quad {\it\sigma}_{{\it\theta}{\it\theta}}=-p+2{\it\mu}\frac{1}{r}\left(\frac{\partial u_{{\it\theta}}}{\partial {\it\theta}}+u_{r}\right)=0,\end{eqnarray}$$
respectively, where
 ${\it\mu}$
is the dynamic viscosity. The pressure
 $p$
can be eliminated from (A 2) by taking the
 $r$
-derivative of
 ${\it\sigma}_{{\it\theta}{\it\theta}}$
and using the
 $r$
-momentum of the Stokes equations. Finally, in terms of the stream function, the equations of (A 2) become (2.10) and (2.11), respectively.
Appendix B. The evaporative flux
We seek for solutions of the self-similar form
 ${\it\phi}=r^{{\it\lambda}}f({\it\theta})$
to the vapour concentration. By solving (2.12), we have
 $f({\it\theta})=A\sin {\it\lambda}{\it\theta}+B\cos {\it\lambda}{\it\theta}$
. Applying the boundary conditions (2.13) and (2.14), we deduce the leading-order solution near
 $r=0$
as follows:
 $$\begin{eqnarray}{\it\phi}=Er^{{\rm\pi}/2b}\cos \left[\frac{{\rm\pi}}{2b}(b-{\it\theta})\right],\quad 0<{\it\theta}<b,\end{eqnarray}$$
where
 $E$
is some negative constant. Therefore, the evaporative flux on
 ${\it\theta}=0$
is
 $$\begin{eqnarray}\left.\frac{1}{r}\frac{\partial {\it\phi}}{\partial {\it\theta}}\right|_{{\it\theta}=0}\sim r^{({\rm\pi}/2b)-1}.\end{eqnarray}$$
Appendix C. The equilibrium configurations
For the liquid domain, substituting solutions of the self-similar form
 ${\it\psi}=r^{{\it\lambda}}f({\it\theta})$
into (2.7), we have
 $$\begin{eqnarray}{\it\psi}=r^{{\it\lambda}}[A\cos ({\it\lambda}{\it\theta})+B\sin ({\it\lambda}{\it\theta})+C\cos (({\it\lambda}-2){\it\theta})+D\sin (({\it\lambda}-2){\it\theta})],\end{eqnarray}$$
where the cases
 ${\it\lambda}=0,1,2$
, which give irrelevant solutions to the problem, are excluded. As boundary conditions (2.10)–(2.11) and (3.6) are valid on
 ${\it\theta}=0$
and
 ${\it\theta}=-a$
, respectively, where
 $a$
is the angle of the liquid medium as seen in figure 1. Substituting (C 1) into these boundary conditions, we deduce the linear system for the constants
 $A$
,
 $B$
,
 $C$
,
 $D$
:
 $$\begin{eqnarray}\unicode[STIX]{x1D648}\left(\begin{array}{@{}cccc@{}}A & B & C & D\end{array}\right)^{\text{T}}=0,\end{eqnarray}$$
where
 $\unicode[STIX]{x1D648}$
is the
 $4\times 4$
matrix in terms of
 ${\it\lambda}$
and
 $a$
. In a similar way as in Moffatt (Reference Moffatt1964), for a non-trivial solution of the system (C 2), the following condition should hold:
 $$\begin{eqnarray}\det \unicode[STIX]{x1D648}=8({\it\lambda}-2)({\it\lambda}-1)^{2}{\it\lambda}^{2}[-{\it\lambda}({\it\lambda}-2)+({\it\lambda}-1)^{2}\cos (2a)+\cos (2a({\it\lambda}-1))]=0.\end{eqnarray}$$
However, the exponent
 ${\it\lambda}$
of the stream function
 ${\it\psi}=r^{{\it\lambda}}f({\it\theta})$
should be equal to
 ${\rm\pi}/2b$
in order to satisfy the stationary kinematic boundary condition (2.16). Therefore, we finally have the solvability condition (3.9) from (C 3) for
 $a$
and
 $b$
. One can find the solution
 $({\it\phi},{\it\psi})=({\it\phi}_{0},{\it\psi}_{0})$
in the form of (3.7)–(3.8) by direct calculation.
Appendix D. The
${\it\alpha}$
-Mellin transform

We define the
 ${\it\alpha}$
-Mellin transform
 $$\begin{eqnarray}\widetilde{g}^{{\it\alpha}}({\it\lambda})=\int _{0}^{\infty }r^{\text{i}{\it\lambda}+{\it\alpha}-1/2}g(r)\,\text{d}r,\quad {\it\lambda}\in \mathbb{R}.\end{eqnarray}$$
Applying the
 ${\it\alpha}$
-Mellin transform to (5.1) and (5.2), we have two ordinary differential equations with respect to
 ${\it\theta}$
for
 $\tilde{{\it\phi}_{1}}^{{\it\alpha}}({\it\lambda},{\it\theta})$
and
 $\tilde{{\it\psi}_{1}}^{{\it\alpha}}({\it\lambda},{\it\theta})$
, respectively. Solving these ordinary differential equations with the boundary conditions (5.3)–(5.8), we deduce that, on
 ${\it\theta}=0$
,
 $$\begin{eqnarray}\widetilde{\frac{1}{r}\frac{\partial {\it\phi}_{1}}{\partial {\it\theta}}}^{{\it\alpha}+1}=E\frac{{\rm\pi}}{2b}\frac{m}{m+{\displaystyle \frac{{\rm\pi}}{2b}}-1}\tan (mb)\widetilde{\left(r^{({\rm\pi}/2b)-1}\frac{\partial f}{\partial r}\right)}^{{\it\alpha}+1},\end{eqnarray}$$
 $$\begin{eqnarray}\displaystyle \widetilde{\frac{\partial {\it\psi}_{1}}{\partial r}}^{{\it\alpha}+1} & = & \displaystyle \frac{-2C_{E}E\cdot G(a,b)({\rm\pi}-2b)m\sin ^{2}a}{b[(m+1)^{2}\cos 2a-m(m+2)+\cos (2a(m+1))]}\widetilde{\left(r^{({\rm\pi}/2b)-1}\frac{\partial f}{\partial r}\right)}^{{\it\alpha}+1}\nonumber\\ \displaystyle & & \displaystyle -\,\frac{{\it\sigma}}{2}\frac{(m+1)\sin 2a-\sin (2a(m+1))}{(m+1)^{2}\cos 2a-m(m+2)+\cos (2a(m+1))}\widetilde{\frac{\partial f}{\partial r}}^{{\it\alpha}+1},\end{eqnarray}$$
where
 $m=\text{i}{\it\lambda}+{\it\alpha}+1/2$
. Applying the
 ${\it\alpha}$
-Mellin transform to (5.11) and using equations (D 2) and (D 3), we finally arrive at (5.12).
Equation (5.12), when inverting the
 ${\it\alpha}$
-Mellin transform, becomes an integro-differential partial differential equation of the form
 $(\partial f/\partial t)(r,t)=\int _{0}^{\infty }K(r,{\it\rho})f({\it\rho},t)\,\text{d}{\it\rho}$
which cannot be integrated by standard analytical methods. Instead, we study the stability, understood as a tendency for
 $f(r,t)$
to converge to a bounded function as
 $t\rightarrow \infty$
, by indirect means. To this end, we introduce a lemma in appendix E.
Appendix E. The stability lemma
Lemma E.1. Consider the following
 ${\it\alpha}$
-Mellin multiplier equation
 $$\begin{eqnarray}\widetilde{\frac{\partial h}{\partial t}}^{{\it\gamma}}=B({\it\lambda})\widetilde{h}^{{\it\beta}}.\end{eqnarray}$$
If
 $\text{Re}\,B({\it\lambda})<0$
for almost everywhere real
 ${\it\lambda}$
, then
 $h(r,t)$
is stable in a suitable weighted norm.
Proof. We have
 $\widetilde{h}^{{\it\beta}}\overline{\widetilde{(\partial h/\partial t)}^{{\it\gamma}}}=\overline{B({\it\lambda})}\widetilde{h}^{{\it\beta}}\overline{\widetilde{h}^{{\it\beta}}}$
and
 $\overline{\widetilde{h}^{{\it\beta}}}\widetilde{(\partial h/\partial t)}^{{\it\gamma}}=B({\it\lambda})\widetilde{h}^{{\it\beta}}\overline{\widetilde{h}^{{\it\beta}}}$
, so that
 $$\begin{eqnarray}\widetilde{h}^{{\it\beta}}\overline{\widetilde{\frac{\partial h}{\partial t}}^{{\it\gamma}}}+\overline{\widetilde{h}^{{\it\beta}}}\widetilde{\frac{\partial h}{\partial t}}^{{\it\gamma}}=2[\text{Re}\,B({\it\lambda})]|\widetilde{h}^{{\it\beta}}|^{2}.\end{eqnarray}$$
Applying
 $1/2{\rm\pi}\int _{-\infty }^{\infty }\,\text{d}{\it\lambda}$
over (E 2) and using Parseval’s identity, we deduce
 $$\begin{eqnarray}\frac{\text{d}}{\text{d}t}\int _{0}^{\infty }r^{{\it\gamma}+{\it\beta}}|h|^{2}\,\text{d}r=\frac{1}{{\rm\pi}}\int _{-\infty }^{\infty }\text{Re}\,B({\it\lambda})|\widetilde{h}^{{\it\beta}}|^{2}\,\text{d}{\it\lambda}<0\end{eqnarray}$$
and hence
 $\int _{0}^{\infty }r^{{\it\gamma}+{\it\beta}}|h|^{2}\,\text{d}r\rightarrow c$
as
 $t\rightarrow \infty$
, where
 $c$
is some real constant.◻
Appendix F. The formulae of
$\text{Re}\,N({\it\lambda})$
and
$\text{Re}\,\unicode[STIX]{x1D648}({\it\lambda})$


The formula for
 $\text{Re}\,N({\it\lambda})$
is
 $$\begin{eqnarray}\text{Re}\,N({\it\lambda})=\frac{{\it\lambda}({\it\lambda}\sin 2a-\sinh (2a{\it\lambda}))}{1+{\it\lambda}^{2}-{\it\lambda}^{2}\cos 2a+\cosh (2a{\it\lambda})},\end{eqnarray}$$
so that one can easily check
 $\text{Re}\,N({\it\lambda})<0$
for any real
 ${\it\lambda}\neq 0$
and
 $a$
.
The formula of
 $\text{Re}\,\unicode[STIX]{x1D648}({\it\lambda})$
as a function of
 $(a,b)$
is
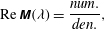 $$\begin{eqnarray}\text{Re}\,\unicode[STIX]{x1D648}({\it\lambda})=\frac{\mathit{num.}}{\mathit{den.}},\end{eqnarray}$$
where
 $$\begin{eqnarray}\displaystyle \mathit{num.} & = & \displaystyle {\it\lambda}\left(2(2b-{\rm\pi}){\it\lambda}({\rm\pi}^{2}-8b{\rm\pi}+4b^{2}(4+{\it\lambda}^{2}))(\cos (2b)+\cosh (2b{\it\lambda}))\right.\nonumber\\ \displaystyle & & \displaystyle \times \,G[a,b]\sin ^{3}(a)+b{\rm\pi}(1+{\it\lambda}^{2}-{\it\lambda}^{2}\cos (2a)+\cosh (2a{\it\lambda}))\nonumber\\ \displaystyle & & \displaystyle \times \left.(({\rm\pi}-2b){\it\lambda}\sin (2b)+({\rm\pi}-2b(2+{\it\lambda}^{2}))\sinh (2b{\it\lambda}))\right),\end{eqnarray}$$
 $$\begin{eqnarray}\displaystyle \mathit{den.} & = & \displaystyle b({\rm\pi}^{2}-8b{\rm\pi}+4b^{2}(4+{\it\lambda}^{2}))(1+{\it\lambda}^{2}-{\it\lambda}^{2}\cos (2a)+\cosh (2a{\it\lambda}))\nonumber\\ \displaystyle & & \displaystyle \times \,(\cos (2b)+\cosh (2b{\it\lambda})).\end{eqnarray}$$
We compute
 $\text{Re}\,\unicode[STIX]{x1D648}({\it\lambda})$
by using numerical calculation.



