





1 Introduction
Low-density porous materials, commonly referred to as foams, with densities in the range of 1 mg cm–3 ≲ ρ ≲ 500 mg cm–3, have found widespread applications in high-energy-density physics and laser–plasma experiments[ Reference Betti and Zhou 1 – Reference Atzeni and Meyer-ter-Vehn 3 ]. In the context of inertial confinement fusion (ICF), foams have been proposed and explored for multiple roles, including laser ablators, intermediate buffers and fuel configurations .
Laser focal spots are intrinsically affected by spatial nonuniformities, including hot spots, which can seed hydrodynamic instabilities such as the Rayleigh–Taylor instability during target acceleration[ Reference Frenje, Li, Séguin, Kurebayashi, Petrasso, Soures, Delettrez, Glebov, Meyerhofer, Radha, Roberts, Sangster, Skupsky and Stoeckl 4 ]. A variety of optical smoothing techniques, including spectral dispersion, random phase plates (RPPs) and induced spatial incoherence, have been developed to mitigate these effects[ Reference Kato, Mima, Miyanaga, Arinaga, Kitagawa, Nakatsuka and Yamanaka 5 – Reference Dixit, Thomas, Woods, Morgan, Henesian, Wegner and Powell 7 ]. However, during the early phase of laser–matter interaction, when the target remains cold and the electron mean free path is short, the spatial structure of the laser intensity can be directly imprinted onto the target, limiting the effectiveness of purely optical approaches.
The use of foam-buffered targets was first proposed by Dunne et al. [ Reference Dunne, Kilkenny and Wallace 8 ], who demonstrated that low-density foams rapidly generate extended plasma scale lengths, thereby enhancing the thermal smoothing of laser nonuniformities. Beyond imprint mitigation, foams offer additional advantages, including enhanced radiative effects during shock wave propagation, access to supercritical shock regimes and opportunities to study equations of state at multi-megabar pressures[ Reference Zel’dovich and Raizer 9 , Reference Hoarty, Iwase, Meyer, Edwards and Willi 10 ]. Foams have also been explored as pressure amplifiers in laser-driven shock wave experiments, as well as in fast-ignition studies and secondary radiation-source generation.
In addition to their use as ablators and buffering layers, there is growing interest in the use of low-density foams as fuel configurations, particularly in the context of DT-wetted porous media. Such concepts have been proposed as a possible route to improved fuel compression and burn efficiency in ICF targets and have been investigated both experimentally and numerically in recent years[ Reference Betti and Zhou 1 , Reference Olson and Leeper 11 , Reference Paddock, Martin, Ruskov, Scott, Garbett, Haines, Zylstra, Aboushelbaya, Mayr, Spiers, Wang and Norreys 12 ].
These concepts aim to combine favourable hydrodynamic properties with improved fuel assembly characteristics and have recently attracted renewed attention in the design of next-generation fusion targets.
Motivated by these considerations, we performed an experiment at the Vulcan laser facility to investigate the propagation of a laser-driven shock in a low-density foam target. The shock wave was generated by laser ablation of an ablator–pusher assembly and subsequently propagated through a cylindrical foam sample. The shock wave dynamics were diagnosed using side-on, time-resolved X-ray radiography, enabling direct visualization of both the pusher motion and the shock front within the foam[ Reference Antonelli, Atzeni, Schiavi, Baton, Brambrink, Koenig, Rousseaux, Richetta, Batani, Forestier-Colleoni, Le Bel, Maheut, Nguyen-Bui, Ribeyre and Trela 13 , Reference Antonelli, Barbato, Mancelli, Trela, Zeraouli, Boutoux, Neumayer, Atzeni, Schiavi, Volpe, Bagnoud, Brabetz, Zielbauer, Bradford, Woolsey, Borm and Batani 14 ].
This work complements recent studies of shock wave propagation in porous materials, notably those by Parisuaña et al. [ Reference Parisuaña, Valdivia, Bouffetier, Kurzer-Ogul, Pérez-Callejo, Bott-Suzuki, Casner, Christiansen, Czapla, Eder, Galtier, Glenzer, Goudal, Haines, Hodge, Ikeya, Izquierdo, Khaghani, Kim, Klein, Koniges, Lee, Leininger, Leong, Lester, Makita, Mancelli, Martin, Nagler, Sandberg, Truong, Vescovi, Gleason and Kozlowski 15 ], who investigated aerogel and triphenyl phosphate (TPP) foams over a wide density range using Talbot-based X-ray phase-contrast imaging and velocity interferometry system for any reflector (VISAR) diagnostics. Although different foam materials and diagnostic techniques were employed, our results exhibit comparable shock wave dynamics under similar laser-intensity conditions. In the present study, experimental observations are systematically compared with hydrodynamic simulations performed using both Lagrangian and Eulerian codes, providing a robust assessment of modelling assumptions relevant to foam-based ICF target designs.
2 Experimental design and results
2.1 Laser and diagnostics
A schematic of the experimental arrangement is shown in Figure 1. The campaign was performed at the Vulcan Nd laser facility (Rutherford Appleton Laboratory, UK), using long-pulse beams to drive a strong shock wave into a cylindrical foam target. Three long-pulse beamlines at the second harmonic (2ω, wavelength λ = 527 nm) were employed, with a pulse duration of 2 ns and a typical total energy of approximately 550 J. In most shots, RPPs were used to produce a near-Gaussian focal-spot intensity distribution with a full width at half maximum (FWHM) of about 400 μm, corresponding to a nominal on-target intensity of the order of 1014 W cm–2.
Schematic layout of the experimental setup for time-resolved X-ray radiography at the Vulcan laser facility. The distance between the copper-wire backlighter target and the main target is 50 mm, while the distance between the main target and the imaging-plate detector is 700 mm. A magnet is positioned between the target and the detector to deflect energetic electrons.

Time-resolved X-ray radiography was used to diagnose the shock wave propagation. A short-pulse laser beam generated the backlighter pulse, with a duration of 1 ps, an energy of approximately 50 J and a focal spot of about 50 μm, corresponding to a peak intensity of the order of 1018 W cm–2. The backlighter targets were 10-μm-diameter copper wires emitting Cu Kα radiation at approximately 8 keV, together with a harder bremsstrahlung component extending to higher photon energies. In the present configuration, no pinhole was used in the imaging system, and the effective X-ray source size was therefore determined by the wire diameter.
Imaging plates (BAS-MS) were used as detectors and were positioned 700 mm from the main target. The plates were scanned 15–35 min after each shot using a Fujifilm BAS-5000 scanner operating at a wavelength of 635 nm; this delay was sufficiently short that no additional fading correction was required. A magnet was installed between the target and the detector to deflect energetic electrons and prevent saturation of the imaging plates.
A spatial calibration of the radiographic system was performed using grid targets fabricated from copper wires with a pitch of 50 μm. Three shots were dedicated to this calibration. A representative calibration image is shown in Figure 2.
Radiographic image of a copper grid used for spatial calibration of the diagnostic (shot #63). The known grid pitch of 50 μm (distance between the Cu wires forming the grid) yields a spatial calibration of 3.9 μm per pixel in the analysed radiographs.

The pixel size in the imaging-plate scanner was set to 50 μm. Taking into account the geometric magnification of approximately 14, resulting from the distances of 50 mm (backlighter–target) and 700 mm (target–detector), the spatial calibration of the recorded images corresponds to 3.9 μm per pixel at the target plane. The calibration uncertainty is primarily determined by the grid pitch and the image-analysis procedure and is estimated to be at the few-percent level.
To evaluate the effective spatial resolution, we analysed the edge sharpness of the images of the wires forming the grid, adopting the classical definition based on the distance between the 10% and 90% levels of the maximum grey value. Taking into account the image magnification, this corresponds to an effective spatial resolution of approximately 15 μm at the target plane.
Time-resolved radiographs were acquired at different delays between the nanosecond drive pulse and the picosecond backlighter pulse. In the following, the delay between the two pulses is denoted by τ.
2.2 Target design
The target consisted of a cylindrical polyimide tube with a diameter of 1.05 mm and a height of 1 mm, with 5-μm-thick walls, filled with trimethylolpropane triacrylate (TMPTA) foam at a nominal density of 0.1 g cm–3. The foam pore size was typically between 1 and 4 μm, as measured using a scanning electron microscope[ Reference Falconer, Nazarov and Horsfield 16 ]. At one end of the tube, an ablator–pusher package was mounted, comprising a 25 μm parylene layer followed by a 5 μm titanium foil acting as the pusher (see Figure 3). The titanium layer also served as a shield for the foam against direct irradiation, as well as X-ray and hot-electron preheating originating from the laser–plasma interaction at the drive surface.
Schematic representation of the target design. The ablator–pusher package consists of a 25 μm parylene layer followed by a 5 μm titanium pusher, mounted on a cylindrical polyimide tube filled with TMPTA foam at a density of 0.1 g cm–3.

Under the present experimental conditions, the X-ray backlighter spectrum penetrates the target assembly sufficiently to enable side-on radiographic imaging of both the titanium pusher motion and the shock wave front propagating within the foam. The combination of a relatively thin titanium pusher and a broadband backlighter spectrum (Cu Kα plus harder bremsstrahlung) is also important for the interpretation of the synthetic radiography discussed in Section 3.3, where an effective photon energy is used to represent the experimental spectrum in a simplified manner.
2.3 Experimental results
Figure 4 shows representative radiographic images obtained with and without the use of an RPP. Owing to the short duration of the picosecond X-ray backlighter pulse compared with the hydrodynamic time scale, the images provide effectively frozen snapshots of the shock wave propagation in the foam. In the following, the delay τ denotes the time interval between the peak of the nanosecond drive pulse and the backlighter pulse.
Radiographic images of the target obtained with a delay τ between the nanosecond drive pulse and the picosecond backlighter pulse. (a) Shot with a random phase plate (shot 71, E = 617 J, τ = 35 ns), showing an approximately Gaussian transverse profile. (b) Shot without a phase plate (shot 60, E = 551 J, τ = 10 ns), for which the Gaussian shape is not observed. The spatial scale corresponds to the target plane. The spatial dimensions can be estimated from the image, taking into account that the target size is 1.05 mm in diameter and 1 mm in height, corresponding here to the vertical and horizontal dimensions, respectively.

Figure 4 Long description
Two side-by-side radiographic panels show the effects of laser drive pulses on a target.
* Panel (a), labeled shot number 71 at the top-left, shows a target driven with a random phase plate. At the center, a distinct, dark orange-red region forms a smooth, approximately Gaussian curve pointing toward the left. This curved feature is bounded by a dashed line. To the right of this curve is a vertical dark purple-red bar representing the target edge, with a horizontal protrusion extending to the right near the top.
* Panel (b), labeled shot number 60 at the top-left, shows a target driven without a phase plate. The central orange-red region is less defined and more diffuse compared to panel a, lacking the clear Gaussian symmetry. The vertical target edge on the right appears slightly tilted and more fragmented, with irregular dark purple-red shapes at the top-right corner.
The background of both panels is a grainy yellow-orange texture. The spatial scale represents a target 1.05 millimeters in diameter vertically and 1 millimeter in height horizontally.
The comparison highlights the role of the RPP in producing a smoother and more uniform transverse pressure profile. In addition, the curvature and transverse shape of the shock wave front differ significantly from shot to shot, suggesting variations in the effective laser focal spot and beam superposition on the target. This effect is particularly evident when comparing the morphology of the shock wave front in Figures 4(a) and 4(b), even for shots with comparable laser energies.
All radiographs were analysed and normalized using ImageJ software[ Reference Schneider, Rasband and Eliceiri 17 ]. The target length and width were measured for each shot, and transmission profiles were extracted from selected regions of interest. Figure 5 illustrates the identification of distinct regions within the radiographic images, together with a representative transmission profile extracted along the horizontal direction. Time-resolved radiographs were acquired for a series of shots performed with an RPP and similar drive-pulse parameters, at delays of τ = 15, 25 and 35 ns. The resulting sequence of images is shown in Figure 6.
(a) Radiographic image from shot 71 (E = 617 J, τ = 35 ns). (b) Transmission profile extracted along the horizontal direction from the highlighted region. The numbered labels indicate the following: (1) vacuum (source intensity), (2) unshocked plastic, (3) shock wave front, (4) titanium pusher, (5) decompressed material behind the pusher, (6) entrance of the target and (7) vacuum. The horizontal scale in panel (b) is given in micrometres. The pusher FWHM is obtained by fitting the transverse displacement profile extracted from the radiograph and calculating the width of the profile at half of its maximum displacement.

Figure 5 Long description
Panel a is a radiographic photo labeled number 71 in the top left. It shows a grainy yellow background with a central darker rectangular region. Within this rectangle, a purple-tinted shock structure moves from right to left. A vertical double-headed arrow indicates the transverse displacement. A horizontal dashed box highlights the area where the transmission profile is extracted.
Panel b is a line graph with the y-axis labeled Transmission ranging from 0.4 to 1.1 and the x-axis labeled distance in micrometers ranging from minus 200 to 1600. The blue data line fluctuates across seven distinct zones marked by red dashed boxes and numbers.
1. Vacuum source intensity: Transmission is stable near 1.0 from minus 200 to 50 micrometers.
2. Unshocked plastic: Transmission drops slightly to approximately 0.9 from 50 to 500 micrometers.
3. Shock wave front: A sharp decline in transmission from 0.9 down to 0.75 between 500 and 650 micrometers.
4. Titanium pusher: Transmission plateaus with high noise around 0.75 from 650 to 900 micrometers.
5. Decompressed material: Transmission rises slightly to 0.8 before dropping again between 900 and 1100 micrometers.
6. Entrance of the target: A deep V-shaped trough where transmission reaches its minimum of 0.45 at approximately 1250 micrometers.
7. Vacuum: Transmission returns to a stable level near 1.0 from 1300 to 1600 micrometers.
Normalized radiographic images obtained at different delays between the nanosecond drive pulse and the picosecond backlighter pulse. From left to right: shot 68 (τ = 15 ns), shot 69 (τ = 25 ns) and shot 71 (τ = 35 ns). The spatial scale corresponds to the target plane. The images allow the temporal evolution of the pusher position (white arrow) and the transverse full width at half maximum (FWHM) of the shock wave front to be tracked. The spatial dimensions can be estimated from the image, taking into account that the target size is 1.05 mm in diameter and 1 mm in height, corresponding here to the vertical and horizontal dimensions, respectively.

Figure 6 Long description
The sequence consists of three vertical panels labeled shot number 68, shot number 69, and shot number 71. Each panel displays a false-color radiographic image where orange and yellow represent the background and purple to dark blue represent the denser shock wave and pusher material.
* Shot number 68 at tau equals 15 n s. On the left, a rectangular target area is visible. On the right side of this target, a slight purple curvature indicates the initial pusher position and the beginning of the shock wave front.
* Shot number 69 at tau equals 25 n s. The purple shock wave front has progressed further to the left into the target area, showing a wider and more pronounced parabolic curvature. The transverse F W H M of the front has increased compared to the first panel.
* Shot number 71 at tau equals 35 n s. The shock wave front has moved significantly deeper into the target area toward the left. The purple region is now a large, well-defined triangular or cone-shaped structure, indicating the continued temporal evolution and expansion of the shock front.
The target dimensions are 1.05 mm in diameter vertically and 1 mm in height horizontally.
The titanium pusher position is clearly visible in all images and exhibits increasing curvature at later times. The shock wave front is also discernible ahead of the pusher, although its identification is more sensitive to the noise level in the experimental radiographs. For this reason, in the present work the pusher position is emphasized as the primary experimental observable, as it can be identified more robustly and consistently than the shock wave front[ Reference Hoarty, Iwase, Meyer, Edwards and Willi 10 ].
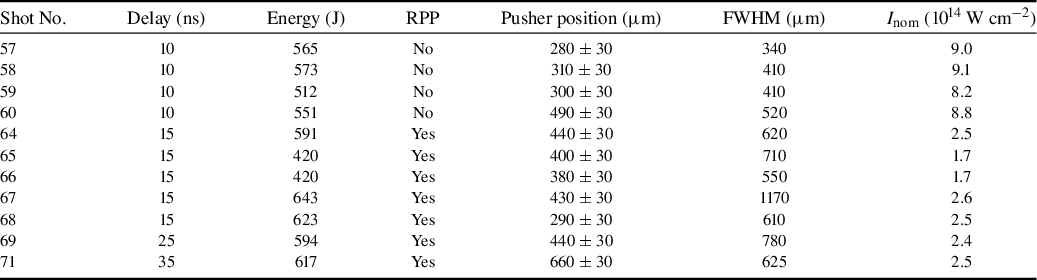
Table 1 summarizes the performed shots and the key observables extracted from the images. The uncertainty in the pusher position is determined, on the one hand, by the effective spatial resolution of the diagnostic (≈15 μm) and, on the other hand, by the uncertainty in identifying the exact position of the pusher front due to the noise present in the images. We estimate the total uncertainty to be approximately 30 μm. The ‘pusher FWHM’ was obtained by fitting the transverse displacement profile extracted from the radiographs and measuring the full width at half of the maximum displacement. This procedure is illustrated in Figure 5.
Summary of the performed shots and experimental results. The pusher position corresponds to the maximum displacement of the titanium pusher from the initial target plane, as measured from the radiographic images. The quoted laser intensity is the nominal on-target intensity estimated from the measured laser energy, the pulse duration and the nominal focal-spot size. The effective intensity experienced by the target may differ due to beam overlap, the spatial intensity distribution and shot-to-shot variations in the focal spot.

Table 1 Long description
The table consists of seven columns: Shot number, Delay in nanoseconds, Energy in Joules, R P P, Pusher position in micrometers, F W H M in micrometers, and I sub nom in 10 super 14 Watts per centimeter squared.
* Shot 57: 10 ns, 565 J, R P P No, Pusher 280 plus or minus 30, F W H M 340, Intensity 9.0.
* Shot 58: 10 ns, 573 J, R P P No, Pusher 310 plus or minus 30, F W H M 410, Intensity 9.1.
* Shot 59: 10 ns, 512 J, R P P No, Pusher 300 plus or minus 30, F W H M 410, Intensity 8.2.
* Shot 60: 10 ns, 551 J, R P P No, Pusher 490 plus or minus 30, F W H M 520, Intensity 8.8.
* Shot 64: 15 ns, 591 J, R P P Yes, Pusher 440 plus or minus 30, F W H M 620, Intensity 2.5.
* Shot 65: 15 ns, 420 J, R P P Yes, Pusher 400 plus or minus 30, F W H M 710, Intensity 1.7.
* Shot 66: 15 ns, 420 J, R P P Yes, Pusher 380 plus or minus 30, F W H M 550, Intensity 1.7.
* Shot 67: 15 ns, 643 J, R P P Yes, Pusher 430 plus or minus 30, F W H M 1170, Intensity 2.6.
* Shot 68: 15 ns, 623 J, R P P Yes, Pusher 290 plus or minus 30, F W H M 610, Intensity 2.5.
* Shot 69: 25 ns, 594 J, R P P Yes, Pusher 440 plus or minus 30, F W H M 780, Intensity 2.4.
* Shot 71: 35 ns, 617 J, R P P Yes, Pusher 660 plus or minus 30, F W H M 625, Intensity 2.5.
In the following, we focus on the analysis of shots 68, 69 and 71, performed with RPPs and comparable energies and acquired at the end of the experimental campaign, when the experimental setup and diagnostics had been optimized. The other shots are intended primarily to provide qualitative information. We note, however, that the FWHM of the pusher profile is larger in shot 69 than in the other two shots, as is clearly visible in Figure 6. This may be due to a slight displacement of the three beams on target during shot 69, thereby producing an effectively larger focal spot.
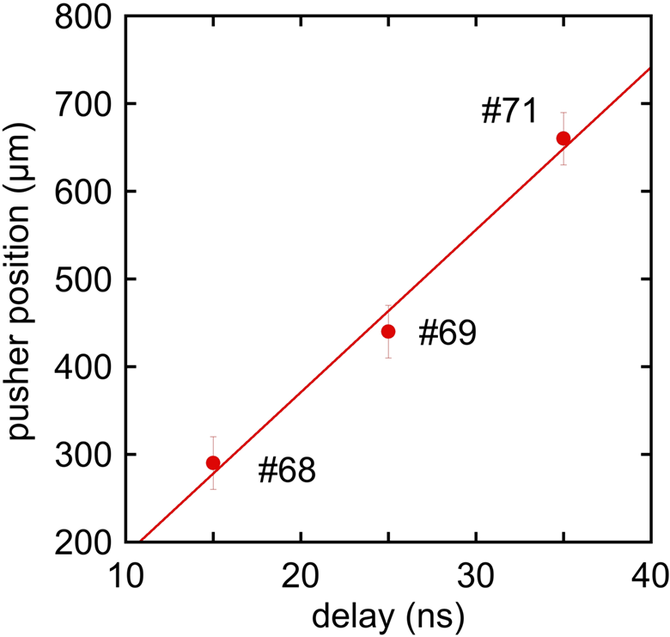
Figure 7 shows the pusher position as a function of time for these shots. The experimentally measured pusher positions shown in Figure 7 provide a quantitative characterization of the target dynamics and form the basis for the comparison with the hydrodynamic simulations presented in the next section.
Pusher position as a function of time for shots performed with random phase plates and a laser energy of approximately 600 J. The pusher position is extracted from time-resolved X-ray radiographs acquired at delays of 15, 25 and 35 ns. The error bars associated with the position uncertainty (
$\sim$
 30 μm) are not shown in the plot. We infer a pusher velocity of u
pusher
$\sim$
 18.5
$\pm$
 2 km s
−1, consistent with the experimental temporal resolution and spatial uncertainty.

3 Analysis of experimental data
3.1 One-dimensional hydrodynamic simulations
As a first step in the interpretation of the experimental data, one-dimensional (1D) hydrodynamic simulations were performed to relate the measured pusher dynamics to the effective laser-drive conditions. The objective of these simulations is not only to reproduce the experimental observables but also to assess the sensitivity of the inferred shock wave dynamics to uncertainties in the laser intensity and target parameters. From Table 1, the measured FWHM of the transverse pusher displacement for shots performed with RPPs is typically of the order of 600–800 μm.
This behaviour can be understood by considering the transverse dependence of the ablation pressure on the laser-intensity distribution. For a Gaussian laser focal spot, the intensity profile can be written as follows:

where
$D$
 is the FWHM of the focal spot. Since the ablation pressure scales with laser intensity approximately as
$P\propto {I}^{2/3}$
 (see, for instance, Ref. [Reference Lindl2]), regions irradiated at higher local intensity experience higher ablation pressure and, consequently, higher shock wave and pusher velocities[
Reference Lindl
2
,
Reference Atzeni and Meyer-ter-Vehn
3
,
Reference Zhou, Li, Zhu, Wang and Tang
18
–
Reference Trickey, Walsh and Pasley
20
]. This leads to a curvature of both the shock front and the pusher position as they propagate through the material. Furthermore, since both the shock velocity and the fluid velocity scale as
$\sqrt{P}$
 , it follows that the spatial profile of the shock front (and of the pusher position) will also be Gaussian, but with an FWHM increased by a factor of
$\sqrt{3}$
 with respect to the focal-spot size.
The FWHM of the pusher position can be directly extracted from the analysis of the experimental radiographic images, such as those shown in Figures 4 and 6. From Table 1, we see that the observed transverse extent of the pusher displacement reflects the effective spatial profile of the driving pressure. This indicates that, under the present conditions, the shock wave and pusher dynamics can be interpreted locally within a quasi-1D framework, despite the two-dimensional (2D) experimental geometry.
One-dimensional simulations were carried out using the MULTI radiation-hydrodynamics code[ Reference Ramis, Meyer-ter-Vehn and Ramírez 21 ]. The laser temporal profile was modelled as a 2 ns Gaussian pulse, and the target composition and layer thicknesses were taken from the experimental design described in Section 2.2. The equations of state for the different materials were modelled using SESAME tables[ Reference Lyon and Johnson 22 ]. The foam was modelled using the equation of state for polystyrene with a reduced density corresponding to the foam density (SESAME material 7590). In the simulations, the foam is treated as a homogeneous medium with the same average density.
Finally, the laser intensity was treated as a free parameter within a physically plausible range to account for uncertainties in the focal-spot size, beam overlap and energy coupling to the target. Figure 8 compares the simulated pusher position as a function of time for several laser intensities with the experimental measurements. The experimental data are best reproduced by simulations corresponding to effective laser intensities in the range of (3–5) × 1013 W cm–2. Lower intensities underestimate the pusher displacement, while higher intensities lead to faster dynamics than those observed experimentally.
One-dimensional MULTI simulations of the pusher position as a function of time for different assumed laser intensities. The symbols indicate the experimental measurements for shots 68, 69 and 71.

Figure 8 Long description
A four-panel grid of graphs showing M U L T I simulations. Each panel shares a vertical y-axis representing Time in n s from 0 to 35 and a horizontal x-axis representing Position in micron from 0 to 1000. A color scale on the right of each row indicates Density in g forward slash c c on a logarithmic scale from 0.1 to over 1.
* Top-Left Panel: Laser intensity 2 10 super 13 W forward slash c m squared. A narrow high-density band curves upward and rightward. Three red circular symbols representing experimental shots 68, 69, and 71 are positioned at approximately (300, 15), (450, 25), and (650, 35). The simulation band passes through the first point but falls slightly to the left of the upper two points.
* Top-Right Panel: Laser intensity 3 10 super 13 W forward slash c m squared. The high-density band shows a steeper curve. The simulation band aligns closely with all three red experimental symbols.
* Bottom-Left Panel: Laser intensity 5 10 super 13 W forward slash c m squared. The high-density band curves more sharply to the right. The simulation band now passes to the right of all three red experimental symbols.
* Bottom-Right Panel: Laser intensity 1 10 super 14 W forward slash c m squared. The high-density band shows the most extreme curvature to the right, significantly overshooting the positions of the three red experimental symbols which remain fixed at their original coordinates.
It is important to note that this effective intensity is systematically lower than the nominal intensity estimated from the measured laser energy and focal-spot size, which is of the order of 1014 W cm–2. The discrepancy between the nominal and effective intensities is not unique to the present experiment and has been reported in other laser-driven shock studies. Several factors may contribute to this effect, including uncertainties in the focal-spot characterization, imperfect superposition of the driving beams on target, temporal and spatial variations in the intensity distribution and energy losses associated with laser–plasma interaction processes at the drive surface. In this context, the effective intensity inferred from hydrodynamic simulations should be interpreted as an experimentally constrained parameter that encapsulates the combined influence of these effects, rather than as a direct measure of the laser output.
Within these limitations, the 1D simulations provide a consistent quantitative framework for interpreting the measured pusher dynamics and estimating the pressure transmitted into the foam. The results of the 1D modelling also serve as a reference for the 2D simulations discussed in the next section.
3.2 Two-dimensional simulations
To assess the role of transverse hydrodynamic effects and to test the validity of the quasi-1D interpretation suggested by the experimental data and 1D simulations, 2D hydrodynamic simulations were performed using the MULTI-2D code[ Reference Ramis, Meyer-ter-Vehn and Ramírez 21 ]. The simulations employed the same target geometry, material properties and laser temporal profile as in the 1D calculations, while the spatial laser-intensity distribution was modelled by a Gaussian profile with a focal-spot FWHM of 400 μm.
Representative mass-density maps obtained at delays of 15 and 25 ns are shown in Figure 9. The simulations reproduce the main features observed experimentally, including the overall morphology of the titanium pusher, the formation of a shock wave front in the foam and the longitudinal propagation of both structures. The displacement of the pusher is consistent with that inferred from the 1D analysis, and the transverse extent of the pusher (FWHM of the displacement profile) remains approximately the same at 15 and 35 ns, indicating that lateral hydrodynamic effects are indeed moderate over the investigated time scale.
Mass-density profiles obtained from MULTI-2D simulations at delays of 15 and 25 ns for a laser intensity of 3 × 10¹³ W cm −2. The mass density is indicated by the colour scale.

Figure 9 Long description
Two side-by-side heat maps with identical axes. The x-axis and y-axis both range from 0 to 0.09 in increments of 0.01.
Left panel: Labeled 25 n s in the top-left corner. A horizontal yellow band of density approximately 1.2 extends from x equals 0 to x equals 0.085 at a y-height of 0.05. A dark red curved line representing high density starts at the bottom around x equals 0.06 and curves upward to meet the horizontal band at x equals 0.085, then continues vertically to the top of the frame.
Right panel: Labeled 15 n s in the top-left corner. The structure is similar to the 25 n s panel, but the curved high-density line is shifted slightly further to the right, starting at the bottom around x equals 0.07.
Color Scale: Located on the far right, a vertical gradient bar ranges from 0.4 at the bottom (bright yellow) to 4.8 at the top (dark purple/black). The scale indicates mass density values, with red representing approximately 2.8 and purple representing values above 4.0.
The 2D simulations also provide insight into the spatial structure of the shock wave front. In particular, variations in the curvature and shape of the shock front are observed for different assumed laser-intensity profiles, suggesting that the experimental shock morphology is sensitive to details of the focal-spot distribution. This observation is consistent with the experimental radiographs shown in Figure 6, where differences in the shock-front shape between shots indicate variations in the effective spatial intensity distribution, even when the nominal laser energy is similar.
Within the range of parameters explored, the 2D simulations confirm that the longitudinal dynamics of the pusher and the shock wave front are dominated by the local drive conditions and can be interpreted, to first order, within a 1D framework. At the same time, the simulations highlight that the effective laser intensity inferred from the experimental data is influenced not only by the total laser energy, but also by the spatial distribution of the intensity and by the coupling efficiency at the drive surface. This provides a natural explanation for the systematic difference between the nominal intensity estimated from laser diagnostics and the effective intensity required to reproduce the experimental observations.
In this context, the effective intensity derived from the simulations should be regarded as an experimentally constrained parameter that encapsulates the combined influence of focal-spot structure, beam overlap and laser–plasma interaction effects, rather than as a direct measure of the laser output. The consistency between the 1D and 2D simulations in reproducing the measured pusher dynamics indicates that this effective intensity provides a robust description of the drive conditions experienced by the target.
It is worth emphasizing that 2D effects do not dominate the dynamics under the present experimental conditions. This is evidenced not only by the close agreement between the 1D and 2D simulations but also by the fact that the FWHM of the pusher profile remains approximately constant in time and is directly related to the FWHM of the laser focal spot, as discussed earlier. The dynamics can therefore be interpreted as locally 1D, while the observed curvature of the pusher position arises primarily from the transverse intensity distribution within the focal spot.
Finally, the 2D simulations establish the physical framework for the analytic interpretation of shock transmission across the titanium–foam interface discussed in the next section. In particular, they clarify that the experimentally measured pusher motion reflects the relation between pressure and fluid velocity established by impedance matching at the material interface, rather than the ablation pressure alone. This connection between simulations and analytic modelling is essential for interpreting the inferred shock pressures in the foam and for assessing the role of material-impedance contrast in the present experimental configuration.
3.3 Synthetic radiography
To enable a direct and quantitative comparison between simulations and experimental diagnostics, synthetic X-ray radiographs were generated by post-processing the 2D mass-density distributions obtained from the MULTI-2D simulations. The X-ray transmission through the target was calculated assuming exponential attenuation according to the Lambert–Beer law, integrating the mass density along the line of sight under the assumption of cylindrical symmetry. This leads to a formulation in which the transmitted intensity at a point (y, r) is given by an Abel transform:

where
$a=\sqrt{R^2-{y}^2}$
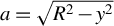 ,
$y$
 is the distance from the initial target plane,
$\mu$
 is the mass absorption coefficient for X-ray radiation ,
${I}_0$
 is the initial intensity,
$\rho$
 is the mass density and
$R$
 is the radius of the cylindrical target.
Mass attenuation coefficients for plastic and titanium were taken from tabulated NIST data[ 23 ]. As discussed in Section 2.1, the experimental backlighter spectrum consists of Cu Kα emission superimposed on a harder bremsstrahlung continuum. Since a full spectral reconstruction of the backlighter was beyond the scope of the present work, the synthetic radiography was performed using effective photon energies chosen to represent different portions of the experimental spectrum. This approach provides a controlled framework for investigating the sensitivity of the radiographic contrast to the assumed photon energy and for assessing the robustness of the comparison between experiment and simulation.
Figure 10 shows a comparison between experimental and synthetic radiographs at t = 35 ns for the Cu Kα photon energy. The simulated images reproduce the main experimental features, including the position and curvature of the titanium pusher. However, the shock wave front in the foam remains only weakly visible, particularly when experimental noise is included. This behaviour reflects the strong absorption of Cu Kα photons by titanium and highlights the intrinsic limitations of low-energy backlighters for diagnosing shock propagation through dense pushers.
Comparison of experimental and synthetic time-resolved X-ray radiographs at t = 35 ns, assuming Cu Kα emission. The upper halves of the images correspond to the experimental data, while the lower halves show synthetic radiographs derived from MULTI-2D simulations with (a) experimental-level noise, (b) reduced noise and (c) no noise. The laser intensity is 5 × 10¹³ W cm–2.

Figure 10 Long description
A three-panel set of vertical rectangular radiographs in false-color orange and purple. Each panel is divided horizontally. The top half of all three panels shows the same experimental data: a grainy orange background with a dark purple triangular shock front expanding from the right edge toward the center. The bottom halves show synthetic M U L T I 2 D simulations.
* Panel a: The bottom half contains high experimental-level noise, making the synthetic shock front appear pixelated and nearly identical in texture to the top experimental half.
* Panel b: The bottom half shows reduced noise. The orange region is smoother, and the purple triangular feature has sharper, more defined edges compared to the top half.
* Panel c: The bottom half has no noise. The synthetic data is perfectly smooth, showing a clear gradient in the orange region and a sharp, solid purple triangular boundary, highlighting the underlying physical structure without stochastic interference.
To explore the impact of the harder X-ray components of the backlighter spectrum, synthetic radiographs were also generated for photon energies of 40 and 50 keV, shown in Figures 11 and 12, respectively.
Comparison of experimental and synthetic time-resolved X-ray radiographs for harder X-rays with a photon energy of 40 keV. The upper halves correspond to the experimental data, while the lower halves show synthetic radiographs with (a) experimental-level noise, (b) reduced noise and (c) no noise. At this photon energy, the titanium pusher becomes partially transparent, resulting in improved agreement with the experimental images. The laser intensity is 5 × 10¹³ W cm–2.

Figure 11 Long description
Three vertical rectangular panels labeled a, b, and c show false-color X-ray radiographs in orange and purple hues. In all three panels, the upper half remains constant, showing experimental data with a grainy, high-noise texture and a dark purple diagonal feature on the right.
* Panel a: The lower half shows a synthetic radiograph with experimental-level noise. The texture and clarity of the diagonal boundary between the orange and purple regions closely match the upper experimental half.
* Panel b: The lower half shows a synthetic radiograph with reduced noise. The orange region is smoother, and the curved interface of the titanium pusher is more distinct than in panel a.
* Panel c: The lower half shows a synthetic radiograph with no noise. The orange and purple regions are perfectly smooth, revealing a sharp, clean curved boundary and a horizontal base line where the pusher material is partially transparent.
Across all panels, the vertical alignment of the dark purple features on the right side demonstrates the spatial agreement between the experimental data and the synthetic models.
The same as Figure 10, but for harder X-rays with a photon energy of 50 keV. The increased transparency of the pusher further improves the agreement between the experimental and synthetic radiographs. The laser intensity is 5 × 10¹³ W cm–2.

Figure 12 Long description
A multi-panel figure containing three vertical rectangular panels labeled a, b, and c from left to right. Each panel shows a grainy, false-color X-ray radiograph in shades of orange, purple, and dark blue.
* Panel a shows the base experimental radiograph. A dark blue, triangular shock front or pusher structure extends from the right edge toward the center against an orange-speckled background.
* Panel b introduces a rectangular synthetic radiograph overlay in the lower half of the frame. This overlay is smoother than the background and attempts to match the shape of the dark blue pusher and the horizontal orange boundary below it.
* Panel c shows a refined synthetic radiograph overlay in the same position. The transition between the orange lower section and the dark blue upper-right section in the overlay is much smoother and more precisely aligned with the underlying experimental features, showing a curved, high-contrast interface that matches the physical shock structure.
The overall progression from a to c demonstrates increasing agreement between the simulated data and the experimental results due to the 50 k e V photon energy setting.
As the effective photon energy increases, the titanium pusher becomes progressively more transparent, and the shock wave front in the foam becomes more clearly distinguishable. The improved agreement between the experimental and synthetic images at higher photon energies indicates that the experimental radiographs are influenced by a significant contribution from the harder bremsstrahlung component of the backlighter spectrum. This result is consistent with previous studies of laser-driven shock diagnostics using mixed-spectral backlighters[ Reference Antonelli, Atzeni, Schiavi, Baton, Brambrink, Koenig, Rousseaux, Richetta, Batani, Forestier-Colleoni, Le Bel, Maheut, Nguyen-Bui, Ribeyre and Trela 13 , Reference Antonelli, Barbato, Mancelli, Trela, Zeraouli, Boutoux, Neumayer, Atzeni, Schiavi, Volpe, Bagnoud, Brabetz, Zielbauer, Bradford, Woolsey, Borm and Batani 14 ].
To reproduce the experimental image quality, artificial noise was added to the synthetic radiographs. The noise level was adjusted to match the characteristic granularity observed in the experimental imaging-plate data. While this procedure does not provide a rigorous statistical description of the experimental noise, it enables a meaningful qualitative comparison between measured and simulated radiographs and allows the relative visibility of the pusher and shock wave front to be assessed under realistic diagnostic conditions.
The synthetic-radiography analysis demonstrates that the pusher position is the most robust observable accessible with the present diagnostic configuration, whereas the shock wave front is intrinsically more sensitive to the backlighter spectrum and to experimental noise. This observation justifies the emphasis placed on the pusher displacement as the primary quantitative observable in the comparison between experiment and simulations.
Finally, the consistency between the pusher positions extracted from the experimental radiographs and those obtained from the hydrodynamic simulations further supports the interpretation that the effective laser intensity inferred from the modelling reflects the actual drive conditions at the target surface. In this sense, synthetic radiography provides a crucial bridge between the hydrodynamic simulations and the experimental diagnostics and underpins the analytic interpretation of shock transmission discussed in the following section.
3.4 Comparison between MULTI and FLASH simulations
To assess the robustness of the hydrodynamic interpretation and the sensitivity of the results to the numerical approach, 2D simulations were also performed using the FLASH code[ Reference Fryxell, Olson, Ricker, Timmes, Zingale, Lamb, MacNeice, Rosner, Truran and Tufo 24 ]. FLASH is an Eulerian adaptive-mesh hydrodynamics code, fundamentally different from the Lagrangian formulation adopted in MULTI. The use of both codes therefore provides an important cross-check of the physical conclusions derived from the simulations.
The FLASH simulations employed the same target geometry, material composition and laser temporal and spatial profiles as those used in the MULTI calculations. In particular, the laser drive was modelled with a Gaussian spatial-intensity distribution and a 2 ns temporal pulse shape, and the same equation-of-state tables were used for the target materials wherever possible.
Figure 13 compares the mass-density distributions obtained with MULTI and FLASH at t = 35 ns. Both codes predict very similar longitudinal positions of the titanium pusher and the shock wave front, as well as comparable propagation velocities through the foam. This agreement indicates that the primary experimental observables are largely insensitive to the numerical scheme and to the details of the hydrodynamic solver.
Comparison between MULTI and FLASH two-dimensional hydrodynamic simulations at t = 35 ns for a laser intensity of 5 × 10¹³ W cm −2. Both simulations predict similar pusher and shock wave positions, while small differences are observed in the lateral expansion of the shock.

Figure 13 Long description
A two-dimensional density plot with two panels sharing a vertical z-axis and a horizontal r-axis. The y-axis on the far left represents z in centimeters, ranging from 0.0 to 0.08. The x-axis represents r in centimeters, ranging from negative 0.06 to 0.08. A color scale on the far right indicates Density in grams per cubic centimeter (g / cm super 3), ranging from 0 (light yellow) to 5 (dark purple/black).
* Left Panel (35 ns, M U L T I): Shows a shock wave expanding from the origin at r = 0. A thin, high-density dark line (pusher) curves from r = negative 0.06, z = 0.005 up toward r = 0, z = 0.055. A vertical orange bar is positioned at r = negative 0.05. The shock front forms a smooth, semi-circular arc above the pusher.
* Right Panel (35 ns, FLASH): Shows a similar shock structure mirrored on the positive r-axis. The high-density pusher follows a nearly identical trajectory to the M U L T I simulation. A vertical orange bar is positioned at r = 0.05. The shock front in this panel exhibits more turbulent, rippled features along its lateral expansion compared to the smoother arc in the left panel.
* Comparison: Both simulations show the shock front reaching approximately z = 0.065 at the center (r = 0). The primary difference is the increased structural complexity and small-scale instabilities visible in the FLASH simulation's shock wave boundary.
Differences between the two simulations are mainly observed in the lateral expansion of the shocked region and in the detailed morphology of the pusher and shock front. In particular, FLASH predicts a slightly faster transverse expansion of the shock and enhanced small-scale structure near the polyimide tube walls. These differences can be attributed to the Eulerian nature of FLASH, which is more sensitive to material mixing and numerical diffusion at interfaces, whereas MULTI, as a Lagrangian code, tends to preserve sharper material boundaries.
Importantly, these discrepancies do not significantly affect the quantities directly compared with experimental data, namely the longitudinal position of the pusher and the overall shock-propagation dynamics. The consistency between MULTI and FLASH therefore supports the interpretation that the experimentally observed dynamics are governed primarily by 1D shock physics, with multidimensional effects playing a secondary role over the time scales investigated in this experiment.
The agreement between two independent hydrodynamic codes also provides additional confidence in the inferred effective laser intensity used in the simulations. While uncertainties in the experimental laser parameters and target conditions inevitably affect the quantitative interpretation, the fact that both MULTI and FLASH reproduce the measured pusher dynamics within the same intensity range indicates that the conclusions are not artefacts of a particular numerical model.
Overall, the comparison between MULTI and FLASH simulations demonstrates that the main conclusions of this work are robust with respect to both the choice of hydrodynamic code and the treatment of multidimensional effects, thereby strengthening the physical interpretation developed in the following section.
4 Discussion
The experimental results and numerical analysis presented in this work provide a coherent physical picture of laser-driven shock wave propagation in low-density foam targets under the explored conditions. Time-resolved X-ray radiography enables direct visualization of both the titanium pusher motion and the shock wave front propagating in the foam, while hydrodynamic simulations allow a quantitative interpretation of the observed dynamics.
Several key conclusions emerge from the present study.
Firstly, the results provide insight into the optimization of radiographic shock wave diagnostics. The comparison between experimental radiographs and synthetic images shows that, for Cu Kα emission, the titanium pusher remains largely opaque, limiting the visibility of the shock wave front in both experimental and synthetic images. When harder X-ray photon energies are assumed in the synthetic radiography, the pusher becomes partially transparent and the agreement with the experimental images improves, particularly with respect to the identification of the shock wave front. This highlights the sensitivity of radiographic diagnostics to the backlighter spectrum and suggests that higher-energy backlighters could significantly enhance shock wave diagnostics in similar experiments.
A notable aspect of the present results is the discrepancy between the nominal laser intensity estimated from laser energy and focal-spot parameters and the effective intensity required in the simulations to reproduce the experimental data. The effective intensity inferred from the simulations is lower by a factor of approximately 4–6. Similar discrepancies have been reported in previous laser-driven shock experiments and are likely attributable to a combination of factors, including uncertainties in focal-spot characterization, imperfect beam overlap on target and energy losses associated with laser–plasma interaction processes at the drive surface. In this context, the simulations should be regarded as providing an effective description of the coupled laser–target system, rather than a direct validation of the nominal laser parameters.
The comparison between MULTI and FLASH simulations demonstrates that the main experimental observables are robust with respect to the choice of hydrodynamic code. Both codes predict similar pusher and shock wave positions and comparable longitudinal propagation velocities. Differences are primarily observed in the lateral expansion of the shock wave and in the treatment of material mixing at late times, reflecting the different numerical approaches adopted by Lagrangian and Eulerian schemes. Importantly, these differences do not affect the primary conclusions of this work.
Despite the 2D geometry of the experiment, the pusher and shock wave dynamics can be interpreted locally within a quasi-1D framework. This conclusion is supported by several independent observations. Firstly, the transverse FWHM of the pusher displacement is well explained by the convolution of a Gaussian laser-intensity distribution with the known scaling of ablation pressure with intensity[ Reference Lindl 2 , Reference Atzeni and Meyer-ter-Vehn 3 ]. Secondly, 1D MULTI simulations reproduce the experimentally measured pusher positions for an effective on-target laser intensity in the range of (3–5) × 1013 W cm–2. Finally, 2D simulations show only moderate transverse hydrodynamic effects at early and intermediate times, with the overall pusher morphology remaining consistent with a locally 1D interpretation.
Although the simulations provide the most direct quantitative interpretation of the experiment, it is instructive to complement them with an analytic treatment that helps clarify certain aspects of the pusher–foam dynamics. The experiment is characterized by several distinct time scales.
Initially, a strong shock is generated in the plastic ablator and subsequently propagates through the titanium pusher into the foam. During this phase, the pusher velocity does not directly correspond to the laser ablation pressure, but rather reflects the conditions established at the titanium–foam interface through the shock-transmission (impedance-matching) process[ Reference Atzeni and Meyer-ter-Vehn 3 , Reference Zel’dovich and Raizer 9 , Reference Holmes 25 , Reference Batani, Benuzzi, Koenig, Faral, Temporal, Nazarov, Hall and Granjouan 26 ]. In the limit of weak shocks, and assuming for simplicity that the adiabatic constants γ are the same for the foam and for titanium, the transmitted pressure can be expressed as follows:

This formula was first derived in Ref. [Reference Batani, Balducci, Nazarov, Löwer, Koenig, Faral, Benuzzi and Temporal27] in the limit of weak shocks by combining the Rankine–Hugoniot relation for momentum conservation with the perfect-gas model, which in the present case is further justified by the low density of the foam. Although the present shocks are not strictly weak, this expression illustrates that, for
${\rho}_{\mathrm{foam}}\ll {\rho}_{\mathrm{Ti}}$
 , only a fraction of the pusher pressure is transmitted into the foam.
At later times, after the laser pulse ends at t = 2 ns, the pressure is no longer sustained and a rarefaction wave is generated, which propagates through the titanium pusher and subsequently into the foam. The pulse duration of 2 ns is therefore insufficient to sustain the propagation of a constant-pressure shock over 35 ns. Our simulations show that the density of the titanium pusher decreases to approximately 2–3 g cm–3, significantly below the density of cold titanium (4.5 g cm–3), confirming the influence of the rarefaction wave. Even during this phase, the titanium pusher and the foam immediately behind it move with the same velocity u, corresponding to the fluid velocity at the interface.
The value of pusher (interface) velocity, u
pusher
$\sim$
 18 km s
−1, inferred from Figure 7, corresponds to this later phase since all observation times are much longer than the pulse duration. The approximately constant pusher velocity suggests that the conditions ahead of the pusher evolve only slowly with time. In practice, the simulations shown in Figure 8 for intensities in the range of (3–5) × 1013 W cm–2 predict a gradual deceleration of the shock, particularly at times more than approximately 30 ns, consistent with the fact that the driving pressure is no longer maintained. However, this deceleration remains relatively modest. The simulations also indicate that the pressure at the shock front is of the order of 1 Mbar, whereas the pressure within the pusher and in the foam behind it remains below approximately 0.5 Mbar.
Finally, it is important to recall that, in the simulations, the foam was modelled using the equation of state of polystyrene at a reduced density corresponding to the average foam density. This approximation neglects the actual foam microstructure, which consists of solid polymer clusters separated by voids (pores). Such an approximation would not be realistic for experiments in which the foam is directly irradiated by the laser beam, since the propagation of radiative heat waves is strongly influenced by the foam microstructure and by the homogenization process, as shown in Refs. [Reference Colvin, Larsen, Hammel and Suter28–Reference Pérez, Patterson, May, Colvin, Biener, Wittstock, Kucheyev, Charnvanichborikarn, Satcher, Gammon, Poco, Fujioka, Zhang, Ishihara, Tanaka, Ikenouchi, Nishimura and Fournier30], particularly in undercritical foams.
In contrast, in the present experiment the foam is not directly irradiated, owing to the presence of the ablator–pusher assembly, and the foam remains overcritical. The dynamics are therefore dominated by a shock wave launched by the pusher. Under these conditions, we find that shock propagation can be reasonably described using an effective homogeneous-medium approximation, consistent with several previous experimental and numerical studies[ Reference Parisuaña, Valdivia, Bouffetier, Kurzer-Ogul, Pérez-Callejo, Bott-Suzuki, Casner, Christiansen, Czapla, Eder, Galtier, Glenzer, Goudal, Haines, Hodge, Ikeya, Izquierdo, Khaghani, Kim, Klein, Koniges, Lee, Leininger, Leong, Lester, Makita, Mancelli, Martin, Nagler, Sandberg, Truong, Vescovi, Gleason and Kozlowski 15 , Reference Paddock, von der Leyen, Aboushelbaya, Norreys, Chapman, Eakins, Oliver, Clarke, Notley, Baird, Booth, Spindloe, Haddock, Irving, Scott, Pasley, Cipriani, Consoli, Albertazzi, Koenig, Martynenko, Wegert, Neumayer, Tchórz, Rączka, Mabey, Garbett, Goshadze, Karasiev and Hu 31 – Reference Dezulian, Canova, Barbanotti, Orsenigo, Redaelli, Vinci, Lucchini, Batani, Rus, Polan, Kozlová, Stupka, Praeg, Homer, Havlicek, Soukup, Krousky, Skala, Dudzak, Pfeifer, Nishimura, Nagai, Ito, Norimatsu, Kilpio, Shashkov, Stuchebrukhov, Vovchenko, Chernomyrdin and Krasuyk 34 ].
Our results therefore support the modelling of low-density foams as homogeneous media characterized by an effective average density, at least for the shock strengths and time scales investigated here. While microstructural effects may become important in other regimes, the present study provides experimental validation of a simplified modelling approach commonly employed in ICF target design.
5 Conclusions
In conclusion, we have conducted an experimental and numerical investigation of laser-driven shock propagation in low-density foams, using time-resolved X-ray radiography at the Vulcan laser facility. The titanium pusher and cylindrical foam geometry enabled direct tracking of the shock dynamics, with the pusher displacement identified as the most reliable observable due to the greater noise sensitivity of the shock-front position.
Time-resolved radiographs confirm the reproducibility of the platform and allow reconstruction of the temporal evolution of both the pusher and the shock front. One-dimensional MULTI simulations reproduce the measured pusher motion for an effective on-target intensity of (3–5) × 1013 W cm–2, while 2D simulations show that transverse effects remain modest, validating a locally 1D interpretation. Synthetic radiographs further indicate better agreement with experiment when harder backlighter spectra are assumed, underscoring the diagnostic importance of the X-ray source.
An analytical model based on shock relations and impedance matching relates the measured pusher velocity to the transmitted foam pressure, providing a transparent physical interpretation consistent – within order-of-magnitude accuracy – with the hydrodynamic simulations. The systematically lower effective laser intensity required in the simulations relative to nominal estimates highlights the influence of experimental uncertainties, beam-overlap geometry and laser–plasma coupling at the drive surface.
Comparison of MULTI and FLASH results shows that the primary observables – pusher and shock positions and longitudinal velocities – are robust across hydrodynamic models, with differences confined mainly to lateral expansion and mixing, leaving the main conclusions unchanged. Overall, the results support modelling low-density foams as homogeneous materials with an effective average density over the relevant pressures and time scales, and they establish a validated benchmark for future studies employing higher drive pressures, enhanced diagnostics and more detailed physics relevant to ICF and high-energy-density applications.
Acknowledgements
The authors thank staff at the STFC Central Laser Facility for their dedication to our experiment. We gratefully acknowledge funding from EPSRC Grant No. EP/L01663X/1 and No. EP/P026486/1. This work has also been supported in the framework of the EUROfusion Enabling Research Project: CfP-FSD-AWP26-ENR-01 ‘Conceptual design for a European High Power Laser Fusion Research Facility’ (HiPER+RF) and has been funded by the European Union via the Euratom Research and Training Programme (Grant Agreement No. 101052200 - EUROfusion). Views and opinions expressed are however those of the authors only and do not necessarily reflect those of the European Union or the European Commission. Neither the European Union nor the European Commission can be held responsible for them. The work of A. S. Martynenko was supported by the Alexander von Humboldt Foundation (Humboldt Research Fellowship for Postdocs). The work of A. A. Aliverdiev was supported by the Ministry of Science and Higher Education of the Russian Federation (State Assignment No. 075-00270-26-00).




 Open access

